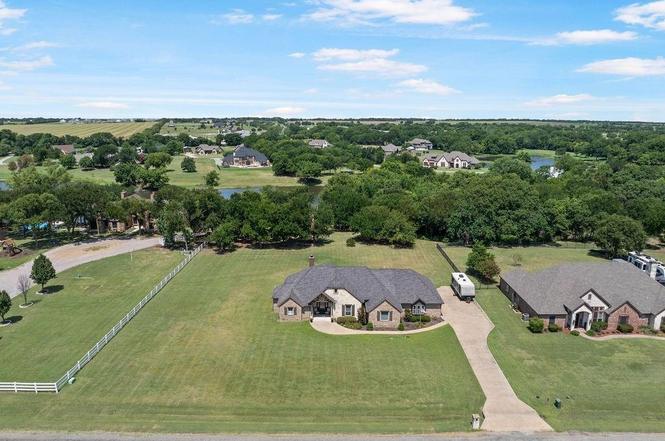
577 Hidden Lakes Blvd · Gunter, TX
Flood risk 1/10 · Minimal
- FEMA flood zone
- X (unshaded)
- Chance of flooding over 30 yrs
- 0.0%
- Est. flood insurance / yr
- $507 – $1,088
Fire risk 4/10 · Minor
- Est. fire insurance / yr
- $1,222 – $2,270
Heat risk 7/10 · Major
- Hot days now (above 110°F)
- 7 days/yr
- Hot days in 30 yrs
- 21 days/yr
Wind risk 5/10 · Moderate
- Chance of severe wind over 30 yrs
- 26.0%
Air-quality risk 3/10 · Minor
- Unhealthy air days now
- 3 days/yr
- Unhealthy air days in 30 yrs
- 3 days/yr
Risk factors via First Street. Map © Google.
Why this score? — see what drove the C+ grade
The composite is a weighted blend of 9 inputs, each scored 0–100. Each bar is that input's sub-score; the figure is the points it added to the 100-point composite (weight × sub-score).
- Cash flow +16.5/30.0
- ARV discount +14.8/15.0
- Appreciation +10.0/10.0
- DSCR +5.1/10.0
- Schools +4.8/10.0
- 1% rule +4.5/10.0
- Livability +3.6/5.0
- Rent growth +2.5/5.0
- Condition / age +2.5/5.0
$718,000
🖨 Deal sheet 📄 Offer letter ✓ Due diligence
Listing remarks
Beautifully crafted custom home set directly on the water in one of Gunter’s most peaceful and private communities. From the moment you arrive, this property blends luxury, comfort, and natural beauty with the rare opportunity to live in the coveted Hidden Lakes Ranch. Located on a cul-de-sac, this thoughtfully designed home features warm, inviting architecture, including built ins, a hidden safe closet with bookshelves, en-suite baths, an tons of storage. Third car garage is perfect for a workshop or extra storage. The large back porch with newly installed tv is the best place to be in the mornings or evenings. Large private primary suite, and an open-concept layout that feels b
Key facts
- Custom home
- Hidden safe closet
- Large back porch
Tags
Neighborhood map
What this means for you Summary
Snapshot
- This is a 3-bed/2.5-bath single-family listed at $718k.
Deal economics
- At list price, monthly cash flow is $414 ($5k/yr) — positive.
- The deal already cash-flows at list — no discount required.
- To meet the 1% rule (rent ≥ 1% of price), the offer needs to be $680k (5.3% below list).
- Recommended offer: $675k (6.0% below list) — sets the bar for market timing.
- Cap rate 7.0% vs local median 1.9% in Gunter — top-decile yield for the area; either an underpriced asset or a hidden risk that comps aren't pricing in. Stress-test before assuming the spread holds.
Location & tenants
- Location reads 72/100 on livability (#236 in TX) — a middle-class / working-renter tenant base. Strengths: crime A+, employment A+, housing A+; Watch: amenities F, commute F, health & safety F.
- Gunter ISD (rural): math 47% / reading 58% proficiency, ranked #103 of 826 in TX (top 12%) — acceptable for families but not a draw, mixed tenant base, ~2y average lease.
- Zoned schools: Gunter El (math 52% / reading 57%, grade C, #621 of 4,322 statewide, top 15%, 414 students, 23% FRL) — zoned schools at 23% FRL track the district average.
- Market conditions: 201 active listings in the ZIP; 1 comparable units currently listed for rent nearby; 2,272 units permitted in Grayson County in 2024 (750 in 5+ unit buildings).
Forward outlook
- In year one you build about $77k of equity ($5k loan paydown + $72k appreciation (10.0% local appreciation)).
- Grayson County population projected at +12% by 2050 — modest demand growth; plan on rents tracking national, not racing it.
- At projected returns (10.0% appreciation + 3.0% rent growth), your $201k cash investment doubles in ~3 years — after that, you're playing with house money.
- By year 2, paydown + projected appreciation supports a ~$123k cash-out refi (75% LTV) — recoverable capital for the next deal without selling this one.
Negotiation context
- It's been on market 67 days — a 6% lower offer ($675k) is reasonable based on typical stale-listing flexibility.
- 3 sale attempts with the ask held roughly flat each time — persistent listings suggest the price (not the market) is what's stuck; bring a comps-based counter.
Risks & watch-outs
- Climate carrying-cost: moderate wind risk, 26% chance of damaging wind over 30y; extreme-heat days projected 7→21/yr by 2055 (HVAC capex compounding) — expect insurance premiums to compound above CPI over the hold.
Questions for the listing agent
- It's been on market 67 days. Have you received any prior offers? Is the seller open to a 6% concession, seller financing, or rate buy-down credit?
- What does the HOA fee cover, when was the last increase, and are there any pending special assessments or reserve-fund shortfalls?
- Why hasn't it sold? Are there any deal-killer items the seller is aware of (foundation, flood, title, zoning, code violations)?
- Is there a deadline driving the sale (1031 exchange, divorce, estate, relocation)? That informs how much negotiation room exists.
- What's the average days-on-market for RENTAL listings here right now (not sales)? A rising rental-DOM trend means longer vacancies and softer asking-rent achievability than the comps imply.
- What's the recent tenant-quality profile in this submarket — average credit score on applications, eviction rate, late-payment / NSF rate, and stable-employment percentage? A property-management company in the area should have these aggregated.
- How much new for-sale + rental construction is in the pipeline within 1–3 miles? Heavy new supply typically softens prices + rents 12–24 months out; constrained supply supports both.
Investment metrics
- 1% rule
- 0.95% ✗
- Cap rate
- 6.99%
- Cash-on-cash
- 2.47%
- DSCR
- 1.11
- GRM
- 8.8
CMA / ARV
- ARV (on-the-fly)
- $857,394
- Comps found
- 6
Show comp detail 6 sales within ~0.75 mi
| Address | Dist | Beds/Ba | Sqft | Sold | Price | $/sf | Match |
|---|---|---|---|---|---|---|---|
| 577 Hidden Lakes Blvd | 0.00mi | 3/2.5 | 2,507 (0%) | 1mo | $718,000 | $286 | 99 |
| 686 Cypress Point Dr | 0.21mi | 3/2.5 | 2,767 (+10%) | 1mo | $729,000 | $263 | 72 |
| 2035 Mcconnell Rd | 0.48mi | 4/3.0 (+1) | 2,624 (+5%) | 13mo | $979,000 | $373 | 52 |
| 1985 Mcconnell Rd | 0.47mi | 3/2.5 | 2,702 (+8%) | 17mo | $925,000 | $342 | 51 |
| 343 Forest Meadow Dr | 0.55mi | 4/2.5 (+1) | 2,382 (-5%) | 19mo | $525,000 | $220 | 45 |
| 1389 Mcconnell Rd | 0.74mi | 3/3.0 | 2,243 (-10%) | 16mo | $1,150,000 | $513 | 32 |
Match score weights: distance 35% · size 25% · config 20% · recency 20%. Top-matched comps best support the ARV.
Projected returns pro-forma
10.0% appreciation · 3.0% rent growth · sell at horizon
- IRR
- 26.1%
- Equity multiple
- 3.08×
- Total profit
- $417,531
- Equity at exit
- $646,831
- IRR
- 22.9%
- Equity multiple
- 7.01×
- Total profit
- $1,209,006
- Equity at exit
- $1,394,916
Cash invested: $201,040 (down + closing). Projections, not guarantees.
Landlord ↔ Tenant lean methodology
- Overall (STATE)
- 87 Strongly Landlord-Friendly
- State Texas
- 87 Strongly Landlord-Friendly · R+5
- County
- — inherits STATE
- City
- — inherits STATE
ZIP-level market 75058
- Home prices YoY
- 6.4%
- Active inventory
- 201
- Price-to-rent
- 8.8×
Monthly cashflow live
- Estimated rent
- $6,800 medium interval (Pro) →
- Mortgage (P&I)
- −$3,765
- Tax from tax record
- −$864 /mo · $10,371/yr
- Insurance
- −$299
- HOA
- −$29
- Vacancy / Maint / Mgmt
- −$1,428
- Net cashflow
- $414
Break-even live
UW: 25.0% down · 7.5% · 30yr · 1.5% tax · 5.0% vac · 8.0% maint · 8.0% mgmt
Financing live
Cash to close
- Down payment
- $179,500
- Closing costs
- $21,540
- Reserves months
- —
- Total cash needed
- —
Loan-product check · same deal, 3 products live
Conventional
25% down · 7.5% · 30yr
- Down + closing
- —
- Monthly P&I
- —
- Monthly cashflow
- —
- DSCR
- —
- Eligible?
- —
Personal DTI + credit; lowest rate.
DSCR
20% down · 8.5% · 30yr
- Down + closing
- —
- Monthly P&I
- —
- Monthly cashflow
- —
- DSCR
- —
- Eligible?
- —
No personal income docs; deal must DSCR.
Hard money
10% down · 12.0% · 12mo
- Down + closing
- —
- Monthly P&I
- —
- Monthly cashflow
- —
- DSCR
- —
- Eligible?
- —
Short-term bridge; refi at stabilization.
Rent comps 1 comps
| Address | Beds | Baths | Sqft | Rent | $/sqft | DOM | Units | Dist |
|---|---|---|---|---|---|---|---|---|
| 300 Waterview Dr Gunter, TX | 4.0 | 3.0 | 2784 | $6,800 | $2.44 | 15d | 1 | 1.00mi |
HOA detail
- Monthly dues
- $29 · $348/yr
- Likely covers
- water
Listing history 17 events
-
2026-04-24status Pending
-
2026-04-15historical Active Option Contract
-
2026-04-04price $718,000
-
2026-02-16$734,000 Active
-
2026-01-15historical
-
2025-12-27price $734,000
-
2025-12-03price $739,000
-
2025-11-14$741,500 Active
-
2025-11-11historical
-
2025-10-29price $744,000
-
2025-10-02price $749,000
-
2025-09-16price $784,000
-
2025-07-17$789,000 Active
-
2018-03-13soldstatus
-
2011-07-13soldstatus
-
2010-07-16soldstatus
-
2002-05-22soldstatus
ⓘ Source: listings_history table (triggers on properties + properties_extension) + one-shot
backfill from property_details.listing_events for pre-trigger history.
Tax reassessment forecast TX · Resets to sale price
- Current annual tax
- $10,371 · $864/mo
- Projected year-2 tax
- $13,139 · $1,095/mo
- Expected delta
- +$2,769/yr (+$231/mo · 26.7%)
ⓘ Screening estimate from a state-policy table — verify with the county assessor before closing.
Climate risk First Street
- Flood 1/10 Low FEMA zone X (unshaded) · 0% chance over 30 yrs
- Wildfire 4/10 Moderate
- Heat 7/10 Severe 7 d/yr ≥110°F today · 21 d/yr by 30 yrs out
- Wind 5/10 Major 26% chance of damaging wind over 30 yrs
- Air quality 3/10 Moderate 3 unhealthy d/yr today · 3 by 30 yrs out
Nearby sold comps map
Loading sold comps map…
Walkable amenities ~0.75 mi
Loading nearby amenities…
Taxation est. · year 1
- Rental income
- $81,600
- − Mortgage interest
- −$40,219
- − Property taxes
- −$10,371
- − Insurance
- −$3,590
- − Repairs & maintenance
- −$6,528
- − Management
- −$6,528
- − HOA
- −$348
- − Depreciation
- −$20,887
- Taxable loss
- −$6,871
- Est. tax savings @ 24.0%
- +$1,649
- After-tax cash flow
- $6,621/yr
For passive investors: Depreciation is non-cash, so a rental often shows a tax loss while cash-flowing — sheltering income. Rental losses are passive: they offset passive income freely, and up to $25,000/yr can offset ordinary (W-2) income if you actively participate and your MAGI is under $100k (phasing out to $0 by $150k); unused losses carry forward. On sale, claimed depreciation is recaptured at up to 25%, and gains may owe capital-gains tax (a 1031 exchange can defer both). Figures are a year-1 estimate at your 24.0% rate — not tax advice; consult a CPA.
Schools (NCES district)
- District
- Gunter ISD
- NCES district ID
- 4821960
- Math proficiency
- 47% ▼ -8.00%
- Reading proficiency
- 58% ▼ -3.00%
- Median HH income
- $79,375
- Composite
- 47.63/100
- National rank
- #2254
- State rank
- #103 of 826 in TX
Livability — Gunter
- Score
- 72/100
- State rank
- #236
- US rank
- #5729
Category grades
Schools grade is shown separately in the Schools card above.
Census & demographics
- Population (ZIP)
- 3,614
Population outlook (Grayson County) Hauer SSP2
- Today (2025)
- 134,540 people
- By 2030
- 138,653 · +3.1%
- By 2040
- 145,958 · +8.5%
- By 2050
- 151,218 · +12.4%
- By 2075
- 161,802 · +20.3%
- By 2100
- 159,036 · +18.2%
Race, ethnicity, and origin ACS 2023
- Neighborhood character
- Predominantly White (75%)
- Race & ethnicity
- White 75% Hispanic / Latino 21% Two or more races 18% Black 1% Native American 1%
- Hispanic origin (detail)
- Mexican 20%
- Common ancestry
- Italian 3% Slovak 2% Lithuanian 2%
- Foreign-born
- 10% · Canada
- Languages at home
- 82% English-only · Spanish 18%
Political lean MEDSL · Grayson
- 2024 margin
- Solid R (+54.3) · D 22.5% · R 76.7%
- 2008→2024 swing
- -16.4pp toward R · 2008: -37.9pp · 2024: -54.3pp
- All cycles
- 2024: R+54.3 2020: R+49.9 2016: R+53.1 2012: R+48.0 2008: R+37.9
Not yet ingested
- Civics
- —
Market trends
- HPI YoY
- ▲ 18.56%
- Current HPI
- 309.3751
- Rent YoY
- —
- Metro
- —
- State GDP YoY
- ▲ 3.95%
- F500 in state
- 110
Industry mix (Fortune 500 HQ in TX)
| Industry | F500 HQs | Revenue |
|---|---|---|
| Energy | 16 | $1,198B |
|
||
| Technology | 5 | $198B |
|
||
| Engineering / Construction | 4 | $72B |
|
||
| Energy Services | 3 | $60B |
|
||
| Utilities | 3 | $41B |
|
||
| Healthcare | 2 | $330B |
|
||
Price history
-9.0% since first listed17 events — show timeline
- 2026-04-24 Pending — NTREIS
- 2026-04-15 Contingent — NTREIS
- 2026-04-04 Price Changed $718,000 NTREIS
- 2026-02-16 Listed $734,000 NTREIS
- 2026-01-15 Listing Removed — NTREIS
- 2025-12-27 Price Changed $734,000 NTREIS
- 2025-12-03 Price Changed $739,000 NTREIS
- 2025-11-14 Listed $741,500 NTREIS
- 2025-11-11 Listing Removed — NTREIS
- 2025-10-29 Price Changed $744,000 NTREIS
- 2025-10-02 Price Changed $749,000 NTREIS
- 2025-09-16 Price Changed $784,000 NTREIS
- 2025-07-17 Listed $789,000 NTREIS
- 2018-03-13 Sold (Public Records) — Public Records
- 2011-07-13 Sold (Public Records) — Public Records
- 2010-07-16 Sold (Public Records) — Public Records
- 2002-05-22 Sold (Public Records) — Public Records
Property tax history
+20.2%/yrLatest (2025): $10,371 · +5.6% YoY. Source: county tax records.
Cash-flow waterfall
monthlySold comps — $/sqft
last 12 mo · ≤1 miLoading sold comps…