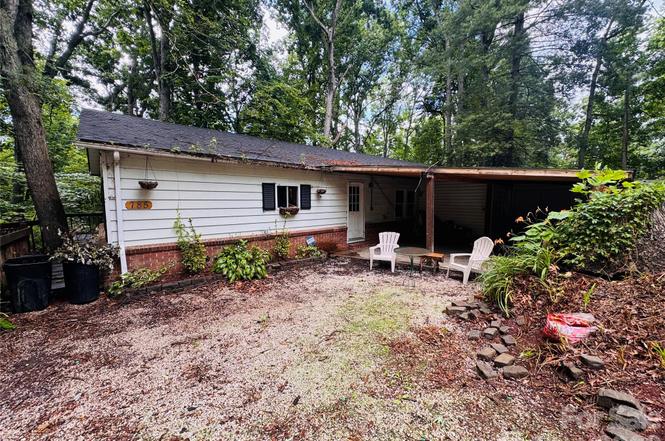
785 Hutch Mountain Rd · Fletcher, NC
Flood risk 1/10 · Minimal
- FEMA flood zone
- X (unshaded)
- Chance of flooding over 30 yrs
- 0.0%
- Est. flood insurance / yr
- $507 – $1,088
Fire risk 4/10 · Minor
- Est. fire insurance / yr
- $906 – $1,684
Heat risk 3/10 · Minor
- Hot days now (above 95°F)
- 7 days/yr
- Hot days in 30 yrs
- 19 days/yr
Wind risk 2/10 · Minimal
- Chance of severe wind over 30 yrs
- —
Air-quality risk 3/10 · Minor
- Unhealthy air days now
- 2 days/yr
- Unhealthy air days in 30 yrs
- 3 days/yr
Risk factors via First Street. Map © Google.
Why this score? — see what drove the B- grade
The composite is a weighted blend of 9 inputs, each scored 0–100. Each bar is that input's sub-score; the figure is the points it added to the 100-point composite (weight × sub-score).
- Cash flow +30.0/30.0
- DSCR +10.0/10.0
- 1% rule +8.0/10.0
- ARV discount +7.5/15.0
- Schools +4.2/10.0
- Livability +3.5/5.0
- Rent growth +2.5/5.0
- Condition / age +2.5/5.0
- Appreciation +0.0/10.0
$189,900
🖨 Deal sheet (PDF) 📄 Offer letter ✓ Due diligence
Listing remarks
Attention investors, flippers, and DIY enthusiasts! Are you looking for your next project? This 3-bedroom, 2-bath home is packed with potential and ready for a fresh start. Bring your vision, your creativity, and a little elbow grease to transform this property into something truly special. With a great floor plan, solid bones, and a fantastic location, the possibilities are endless. Whether you're looking to renovate and resell, create a rental property, or design your dream home, this could be the opportunity you've been waiting for.
Key facts
- 0.29 acre lot
- Built 1978
- Listed 3 days
Property features AI
Finance
- HOA & community: No HOA
Exterior
- Parking: Driveway (no main-level garage)
- Utilities: Well water; Septic system
- Home design: Single-family residence; Manufactured doublewide; One story; Entry level on the main level; Residential property
- Construction: Manufactured construction; Wood construction materials; Crawl space foundation; Shingle roof
- Exterior features: Storage; Dirt, gravel, and paved road access; Publicly maintained road
Interior
- Kitchen: Dishwasher; Double oven; Electric cooktop; Microwave; Refrigerator; Wall oven
- Bedrooms: 3 bedrooms on the main level
- Bathrooms: 2 full bathrooms on the main level
- Heating & cooling: Electric heating; Central air conditioning; Electric cooling
- Interior features: Ceiling fans
- Laundry & utility: Laundry on the main level
Neighborhood map
What this means for you Summary
Snapshot
- This is a 3-bed/2.0-bath manufactured listed at $190k.
Deal economics
- At list price, monthly cash flow is $837 ($10k/yr) — positive.
- The deal already cash-flows at list — no discount required.
- Meets the 1% rule at list price ($2k rent vs $190k).
- Cap rate 11.6% vs local median 4.1% in Fletcher — top-decile yield for the area; either an underpriced asset or a hidden risk that comps aren't pricing in. Stress-test before assuming the spread holds.
Location & tenants
- Location reads 70/100 on livability (#129 in NC) — a middle-class / working-renter tenant base. Strengths: crime A+, housing A+, employment B+; Watch: amenities F, commute F, health & safety F.
- Henderson County Schools (suburban): math 48% / reading 52% proficiency, ranked #64 of 178 in NC (top 36%) — acceptable for families but not a draw, mixed tenant base, ~2y average lease.
- Zoned schools: Fletcher Elementary (math 48% / reading 47%, grade D, #490 of 1,410 statewide, top 35%, 482 students, 53% FRL); North Henderson High (math 72% / reading 58%, grade B, #161 of 535 statewide, top 30%, 1,146 students, 61% FRL).
- Market conditions: 210 active listings in the ZIP; 1 comparable units currently listed for rent nearby; solid renter incomes; 1,534 units permitted in Henderson County in 2024 (558 in 5+ unit buildings).
- This rent runs 36% of the median local income ($82k/yr) — at the standard rent-burdened threshold; future hikes will face affordability resistance.
Forward outlook
- Local home prices are declining (-3.0%/yr); year-one equity from $1k of loan paydown is wiped out by about $6k of value loss. Plan a longer hold.
- Henderson County population projected at +20% by 2050 — long-run rental-demand tailwind backs the buy-and-hold thesis.
- At projected returns (-3.0% appreciation + 3.0% rent growth), your $53k cash investment doubles in ~7 years — after that, you're playing with house money.
Negotiation context
- Only 4 days on market — expect competitive offers; lowballing is unlikely to land.
- Current owner paid $51k; list at $190k implies a 272% gain — meaningful room to come down on a strong offer.
Questions for the listing agent
- Built in 1978 — when were the roof, HVAC, electrical panel, plumbing, and water heater last replaced?
- Is there a deadline driving the sale (1031 exchange, divorce, estate, relocation)? That informs how much negotiation room exists.
- Schools are B-rated — typically a magnet for longer-tenancy family renters. What's the average tenant stay here, and is there a school-zone premium baked into asking?
- What's the average days-on-market for RENTAL listings here right now (not sales)? A rising rental-DOM trend means longer vacancies and softer asking-rent achievability than the comps imply.
- What's the recent tenant-quality profile in this submarket — average credit score on applications, eviction rate, late-payment / NSF rate, and stable-employment percentage? A property-management company in the area should have these aggregated.
- How much new for-sale + rental construction is in the pipeline within 1–3 miles? Heavy new supply typically softens prices + rents 12–24 months out; constrained supply supports both.
Investment metrics
- 1% rule
- 1.30% ✓
- Cap rate
- 11.58%
- Cash-on-cash
- 18.88%
- DSCR
- 1.84
- GRM
- 6.4
CMA / ARV
No comps found within radius.
Projected returns pro-forma
-3.0% appreciation · 3.0% rent growth · sell at horizon
- IRR
- 10.7%
- Equity multiple
- 1.42×
- Total profit
- $22,426
- Equity at exit
- $28,315
- IRR
- 19.7%
- Equity multiple
- 2.65×
- Total profit
- $87,785
- Equity at exit
- $16,419
Cash invested: $53,172 (down + closing). Projections, not guarantees.
Landlord ↔ Tenant lean methodology
- Overall (STATE)
- 85 Strongly Landlord-Friendly
- State North Carolina
- 85 Strongly Landlord-Friendly · R+3
- County
- — inherits STATE
- City
- — inherits STATE
ZIP-level market 28732
- Home prices YoY
- -26.8%
- Active inventory
- 210
- Price-to-rent
- 6.4×
Monthly cashflow live
- Estimated rent
- $2,462 medium interval (Pro) →
- Mortgage (P&I)
- −$996
- Tax from tax record
- −$33 /mo · $399/yr
- Insurance
- −$79
- HOA
- −$0
- Vacancy / Maint / Mgmt
- −$517
- Net cashflow
- $837
Break-even live
Sensitivity live
| Price | -10% $944 | -5% $890 | +0% $837 | +5% $783 | +10% $501 |
|---|---|---|---|---|---|
| Rent | -10% $642 | -5% $739 | +0% $837 | +5% $934 | +10% $1,031 |
| Rate | -1.0pp $932 | -0.5pp $885 | base $837 | +0.5pp $787 | +1.0pp $737 |
UW: 25.0% down · 7.5% · 30yr · 1.5% tax · 5.0% vac · 8.0% maint · 8.0% mgmt
Financing live
Cash to close
- Down payment
- $47,475
- Closing costs
- $5,697
- Reserves months
- —
- Total cash needed
- —
Loan-product check · same deal, 3 products live
Conventional
25% down · 7.5% · 30yr
- Down + closing
- —
- Monthly P&I
- —
- Monthly cashflow
- —
- DSCR
- —
- Eligible?
- —
Personal DTI + credit; lowest rate.
DSCR
20% down · 8.5% · 30yr
- Down + closing
- —
- Monthly P&I
- —
- Monthly cashflow
- —
- DSCR
- —
- Eligible?
- —
No personal income docs; deal must DSCR.
Hard money
10% down · 12.0% · 12mo
- Down + closing
- —
- Monthly P&I
- —
- Monthly cashflow
- —
- DSCR
- —
- Eligible?
- —
Short-term bridge; refi at stabilization.
Rent comps 1 comps
| Address | Beds | Baths | Sqft | Rent | $/sqft | DOM | Units | Dist |
|---|---|---|---|---|---|---|---|---|
| 342 Meadow Pathway Dr Fletcher, NC | 3.0 | 2.0 | 1618 | $2,400 | $1.48 | 24d | 1 | 0.91mi |
Listing history 3 events
-
2026-06-21days on market $189,900 Active 4 DOM
-
2026-06-17remarks 542-char remark
-
2026-06-17$189,900 Active 1 DOM
ⓘ Source: listings_history table (triggers on properties + properties_extension) + one-shot
backfill from property_details.listing_events for pre-trigger history.
Tax reassessment forecast NC · Resets to sale price
- Current annual tax
- $399 · $33/mo
- Projected year-2 tax
- $1,557 · $130/mo
- Expected delta
- +$1,158/yr (+$96/mo · 289.9%)
ⓘ Screening estimate from a state-policy table — verify with the county assessor before closing.
Climate risk First Street
- Flood 1/10 Low FEMA zone X (unshaded) · 0% chance over 30 yrs
- Wildfire 4/10 Moderate
- Heat 3/10 Moderate 7 d/yr ≥95°F today · 19 d/yr by 30 yrs out
- Wind 2/10 Low
- Air quality 3/10 Moderate 2 unhealthy d/yr today · 3 by 30 yrs out
Nearby sold comps map
Loading sold comps map…
Walkable amenities ~0.75 mi
Loading nearby amenities…
Taxation est. · year 1
- Rental income
- $29,543
- − Mortgage interest
- −$10,637
- − Property taxes
- −$399
- − Insurance
- −$950
- − Repairs & maintenance
- −$2,363
- − Management
- −$2,363
- − Depreciation
- −$5,524
- Taxable income
- $7,306
- Est. tax owed @ 24.0%
- −$1,753
- After-tax cash flow
- $8,286/yr
For passive investors: Depreciation is non-cash, so a rental often shows a tax loss while cash-flowing — sheltering income. Rental losses are passive: they offset passive income freely, and up to $25,000/yr can offset ordinary (W-2) income if you actively participate and your MAGI is under $100k (phasing out to $0 by $150k); unused losses carry forward. On sale, claimed depreciation is recaptured at up to 25%, and gains may owe capital-gains tax (a 1031 exchange can defer both). Figures are a year-1 estimate at your 24.0% rate — not tax advice; consult a CPA.
Schools (NCES district)
- District
- Henderson County Schools
- NCES district ID
- 3702100
- Math proficiency
- 48% ▼ -2.00%
- Reading proficiency
- 52% ▼ -2.00%
- Median HH income
- $47,101
- Composite
- 42.5/100
- National rank
- #3206
- State rank
- #64 of 178 in NC
Livability — Fletcher
- Score
- 70/100
- State rank
- #129
- US rank
- #7485
Category grades
Schools grade is shown separately in the Schools card above.
Census & demographics
- County
- Henderson County · 78,587 people
- City population
- 19,279
- Metro
- Asheville, NC
- Population (ZIP)
- 19,279
- Household income
- $81,852
- Rent vs Own
- Severe rent burden
- 154.0
Population outlook (Henderson County) Hauer SSP2
- Today (2025)
- 124,075 people
- By 2030
- 129,690 · +4.5%
- By 2040
- 139,898 · +12.8%
- By 2050
- 148,298 · +19.5%
- By 2075
- 163,980 · +32.2%
- By 2100
- 166,962 · +34.6%
Race, ethnicity, and origin ACS 2023
- Neighborhood character
- Predominantly White (82%)
- Race & ethnicity
- White 82% Hispanic / Latino 9% Two or more races 5% Black 3% Asian 2%
- Hispanic origin (detail)
- Mexican 4%
- Common ancestry
- Slovak 6% Serbian 4% Lithuanian 3%
- Foreign-born
- 7% · Canada, Vietnam
- Languages at home
- 91% English-only · Spanish 6% Other Indo-European 1% Russian/Polish/Slavic 1%
Political lean MEDSL · Henderson
- 2024 margin
- R (+14.6) · D 42.1% · R 56.7% · Other 1.1%
- 2008→2024 swing
- +6.5pp toward D · 2008: -21.0pp · 2024: -14.6pp
- All cycles
- 2024: R+14.6 2020: R+18.8 2016: R+27.9 2012: R+27.6 2008: R+21.0
Not yet ingested
- Civics
- —
Market trends
- HPI YoY
- ▼ -106.57%
- Current HPI
- 290.4589
- Rent YoY
- —
- Metro
- Asheville, NC
- State GDP YoY
- ▲ 3.28%
- F500 in state
- 26
Industry mix (Fortune 500 HQ in NC)
| Industry | F500 HQs | Revenue |
|---|---|---|
| Financial Services | 2 | $213B |
|
||
| Retail | 2 | $95B |
|
||
| Industrial Conglomerate | 1 | $38B |
|
||
| Metals / Steel | 1 | $35B |
|
||
| Utilities | 1 | $30B |
|
||
| Industrial Machinery | 1 | $19B |
|
||
Price history
+272.4% since first listed2 events — show timeline
- 2026-06-17 Listed $189,900 CANOPYMLS as Distributed by MLS Grid
- 1990-10-10 Sold (Public Records) $51,000 Public Records
Property tax history
+0.4%/yrLatest (2025): $399 · -42.1% YoY. Source: county tax records.
Cash-flow waterfall
monthlySold comps — $/sqft
last 12 mo · ≤1 miLoading sold comps…