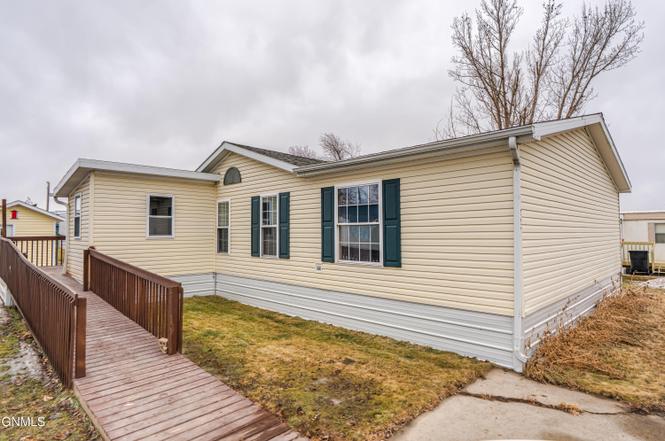
227 Connecticut St · Bismarck, ND
Flood risk 1/10 · Minimal
- FEMA flood zone
- X (shaded)
- Chance of flooding over 30 yrs
- 0.0%
- Est. flood insurance / yr
- $473 – $860
Fire risk 4/10 · Minor
- Est. fire insurance / yr
- $1,289 – $2,393
Heat risk 2/10 · Minimal
- Hot days now (above 97°F)
- 7 days/yr
- Hot days in 30 yrs
- 12 days/yr
Wind risk 2/10 · Minimal
- Chance of severe wind over 30 yrs
- —
Air-quality risk 4/10 · Minor
- Unhealthy air days now
- 5 days/yr
- Unhealthy air days in 30 yrs
- 5 days/yr
Risk factors via First Street. Map © Google.
Why this score? — see what drove the D grade
The composite is a weighted blend of 9 inputs, each scored 0–100. Each bar is that input's sub-score; the figure is the points it added to the 100-point composite (weight × sub-score).
- 1% rule +10.0/10.0
- Cash flow +8.5/30.0
- ARV discount +8.5/15.0
- Livability +4.0/5.0
- Schools +3.7/10.0
- Rent growth +3.2/5.0
- Condition / age +2.5/5.0
- DSCR +2.3/10.0
- Appreciation +0.0/10.0
$57,000
🖨 Deal sheet (PDF) 📄 Offer letter ✓ Due diligence
Listing remarks MLS
This inviting Double Wide is your next home, with a wooden deck and attached entrance. There is an upgraded refrigerator, vinyl plank floors in living room, kitchen, and bathroom. The primary bedroom includes a bathroom, with a shower and handicap accessible shower and dual sinks. Two more bedrooms and a laundry room with washer and dryer. There is a ramp to the home, front entry and a storage shed. Sold ''as is where is''. Must be park approved. Agent/buyer to verify home details, taxes, etc.
Key facts
- New flooring
- New roof
- New toilet
Tags
Neighborhood map
What this means for you Summary
Snapshot
- This is a 3-bed/2.0-bath manufactured listed at $57k.
Deal economics
- At list price, monthly cash flow is $-50 ($-603/yr) — negative.
- To cash-flow at today's rent, offer at most $48k (15.6% below list).
- Meets the 1% rule at list price ($1k rent vs $57k).
- Recommended offer: $48k (15.6% below list) — sets the bar for cash-flow.
- Cap rate 5.2% vs local median 3.1% in Bismarck — top-decile yield for the area; either an underpriced asset or a hidden risk that comps aren't pricing in. Stress-test before assuming the spread holds.
Location & tenants
- Location reads 79/100 on livability (#5 in ND, #2,213 nationally) — a middle-class / working-renter tenant base. Strengths: housing A+, health & safety A+, cost of living A; Watch: crime C-, amenities D+, commute F.
- Bismarck 1 (urban): math 41% / reading 42% proficiency, ranked #25 of 53 in ND (top 47%) — families likely to look elsewhere, expect single-tenant / working-renter base with shorter leases; only 19% free/reduced lunch — higher-income household profile.
- Zoned schools: Becep Center (332 students, 0% FRL); Wachter Middle School (math 34% / reading 34%, grade F, #26 of 35 statewide, top 79%, 1,000 students, 30% FRL); Bismarck High School (math 22% / reading 38%, grade F, #90 of 144 statewide, top 66%, 1,333 students, 27% FRL) — zoned schools at 19% FRL track the district average.
- Market conditions: Rents rising (+2.8%/yr); 261 active listings in the ZIP; 14 comparable units currently listed for rent nearby; rentals at typical pace (median 23d on market — plan ~3-4 weeks tenant-placement turnaround); solid renter incomes; 259 units permitted in Burleigh County in 2024 (0 in 5+ unit buildings).
Forward outlook
- Local home prices are declining (-3.0%/yr); year-one equity from $394 of loan paydown is wiped out by about $2k of value loss. Plan a longer hold.
- Burleigh County population projected at +61% by 2050 — long-run rental-demand tailwind backs the buy-and-hold thesis.
Negotiation context
- It's been on market 59 days — a 3% lower offer ($55k) is reasonable based on typical stale-listing flexibility.
- 2 sale attempts since 4y ago; this cycle's ask has dropped $3k (5%) from the opening price — seller is motivated, your offer sets the floor, not the list.
Risks & watch-outs
- Watch-outs: HOA is 58% of rent.
Questions for the listing agent
- What do current leases actually rent for vs. the listed asking? Can we see a recent rent roll and the last 12 months of T-12 income?
- It's been on market 59 days. Have you received any prior offers? Is the seller open to a 16% concession, seller financing, or rate buy-down credit?
- What does the HOA fee cover, when was the last increase, and are there any pending special assessments or reserve-fund shortfalls?
- Is there a deadline driving the sale (1031 exchange, divorce, estate, relocation)? That informs how much negotiation room exists.
- Schools are B-rated — typically a magnet for longer-tenancy family renters. What's the average tenant stay here, and is there a school-zone premium baked into asking?
- The area grade is low — what's the realistic commute time and amenity access for the typical tenant pool here? Any planned neighborhood developments (good or bad) we should know about?
- What's the average days-on-market for RENTAL listings here right now (not sales)? A rising rental-DOM trend means longer vacancies and softer asking-rent achievability than the comps imply.
- What's the recent tenant-quality profile in this submarket — average credit score on applications, eviction rate, late-payment / NSF rate, and stable-employment percentage? A property-management company in the area should have these aggregated.
- How much new for-sale + rental construction is in the pipeline within 1–3 miles? Heavy new supply typically softens prices + rents 12–24 months out; constrained supply supports both.
Investment metrics
- 1% rule
- 2.62% ✓
- Cap rate
- 5.24%
- Cash-on-cash
- -3.78%
- DSCR
- 0.83
- GRM
- 3.2
CMA / ARV
- ARV (on-the-fly)
- $58,240
- Comps found
- 5
Show comp detail 5 sales within ~0.75 mi
| Address | Dist | Beds/Ba | Sqft | Sold | Price | $/sf | Match |
|---|---|---|---|---|---|---|---|
| 227 Connecticut St | 0.00mi | 3/2.0 | 1,456 (0%) | 0mo | $57,000 | $39 | 100 |
| 1119 University Dr #1705 | 0.41mi | 4/2.0 (+1) | 1,440 (-1%) | 0mo | $57,600 | $40 | 74 |
| 1119 University Dr #1101 | 0.41mi | 3/2.0 | 1,344 (-8%) | 0mo | $95,000 | $71 | 68 |
| 246 Boeing Ave | 0.45mi | 3/2.0 | 1,424 (-2%) | 10mo | $39,000 | $27 | 67 |
| 725 S 12th St #204 | 0.34mi | 4/2.0 (+1) | 1,440 (-1%) | 19mo | $75,000 | $52 | 61 |
Match score weights: distance 35% · size 25% · config 20% · recency 20%. Top-matched comps best support the ARV.
Projected returns pro-forma
-3.0% appreciation · 2.81% rent growth · sell at horizon
- IRR
- -22.0%
- Equity multiple
- 0.24×
- Total profit
- $-12,184
- Equity at exit
- $8,499
- IRR
- -14.7%
- Equity multiple
- 0.14×
- Total profit
- $-13,712
- Equity at exit
- $4,928
Cash invested: $15,960 (down + closing). Projections, not guarantees.
Landlord ↔ Tenant lean methodology
- Overall (STATE)
- 82 Strongly Landlord-Friendly
- State North Dakota
- 82 Strongly Landlord-Friendly · R+20
- County
- — inherits STATE
- City
- — inherits STATE
ZIP-level market 58504
- Rents YoY
- 2.8%
- Active inventory
- 261
- Price-to-rent
- 3.2×
Monthly cashflow live
- Estimated rent
- $1,496 high interval (Pro) →
- Mortgage (P&I)
- −$299
- Tax from tax record
- −$47 /mo · $559/yr
- Insurance
- −$24
- HOA
- −$863
- Vacancy / Maint / Mgmt
- −$314
- Net cashflow
- $-50
Break-even live
Sensitivity live
| Price | -10% $-18 | -5% $-34 | +0% $-50 | +5% $-66 | +10% $-83 |
|---|---|---|---|---|---|
| Rent | -10% $-168 | -5% $-109 | +0% $-50 | +5% $9 | +10% $68 |
| Rate | -1.0pp $-22 | -0.5pp $-36 | base $-50 | +0.5pp $-65 | +1.0pp $-80 |
UW: 25.0% down · 7.5% · 30yr · 1.5% tax · 5.0% vac · 8.0% maint · 8.0% mgmt
Financing live
Cash to close
- Down payment
- $14,250
- Closing costs
- $1,710
- Reserves months
- —
- Total cash needed
- —
Loan-product check · same deal, 3 products live
Conventional
25% down · 7.5% · 30yr
- Down + closing
- —
- Monthly P&I
- —
- Monthly cashflow
- —
- DSCR
- —
- Eligible?
- —
Personal DTI + credit; lowest rate.
DSCR
20% down · 8.5% · 30yr
- Down + closing
- —
- Monthly P&I
- —
- Monthly cashflow
- —
- DSCR
- —
- Eligible?
- —
No personal income docs; deal must DSCR.
Hard money
10% down · 12.0% · 12mo
- Down + closing
- —
- Monthly P&I
- —
- Monthly cashflow
- —
- DSCR
- —
- Eligible?
- —
Short-term bridge; refi at stabilization.
Rent comps 14 comps
| Address | Beds | Baths | Sqft | Rent | $/sqft | DOM | Units | Dist |
|---|---|---|---|---|---|---|---|---|
| 505 1/2 S 10th St Bismarck, ND | 3.0 | 1.0 | 1500 | $1,600 | $1.07 | 23d | 1 | 0.73mi |
| 2020 S 12th St Bismarck, ND | 3.0 | 1.0–2.0 | 1185 | $1,955 | $1.65 | 23d | 19 | 0.77mi |
| 2130 S 12th St Bismarck, ND | 1.0–3.0 | 1.0–2.0 | 1152 | $1,980 | $1.72 | 23d | 12 | 0.89mi |
| 215 E Arbor Ave Unit 205-305G Bismarck, ND | 2.0 | 2.0 | 1031 | $995 | $0.97 | 23d | 1 | 1.04mi |
| 215 E Arbor Ave Unit 201-302E Bismarck, ND | 2.0 | 1.0 | 1100 | $995 | $0.90 | 23d | 1 | 1.04mi |
| 172 Boise Ave Bismarck, ND | 2.0 | 1.0 | 1200 | $1,050 | $0.88 | 23d | 1 | 1.04mi |
| 205 E Arbor Ave Bismarck, ND | 2.0 | 2.0 | 1031 | $995 | $0.97 | 23d | 1 | 1.09mi |
| 201 E Arbor Ave Bismarck, ND | 2.0 | 1.0 | 1100 | $995 | $0.90 | 23d | 1 | 1.11mi |
| 2316 E Broadway Ave Bismarck, ND | 3.0 | 1.0 | 1113 | $1,250 | $1.12 | 23d | 1 | 1.15mi |
| 407 N 12th St Unit 3/4 Bismarck, ND | 2.0 | 1.0 | 1100 | $1,200 | $1.09 | 23d | 1 | 1.19mi |
| 1543 S Washington St Bismarck, ND | 3.0 | 2.0 | 1500 | $2,050 | $1.37 | 23d | 1 | 1.28mi |
| 2220 East Avenue A Unit 1/2 Bismarck, ND | 3.0 | 1.0 | 1227 | $1,150 | $0.94 | 23d | 1 | 1.30mi |
| 700 N 22nd St Bismarck, ND | 2.0 | 1.0 | 1000 | $1,500 | $1.50 | 23d | 1 | 1.43mi |
| 127 Stuttgart Dr Unit 1 Bismarck, ND | 2.0 | 2.0 | 1600 | $1,400 | $0.88 | 23d | 1 | 1.45mi |
HOA detail
- Monthly dues
- $863 · $10,356/yr
Listing history 5 events
-
2026-04-10status Pending
-
2026-03-25price $57,000
-
2026-02-10$60,000 Active
-
2022-09-30soldstatus 498-char remark
Show marketing remark (498 chars)
This inviting Double Wide is your next home, with a wooden deck and attached entrance. There is an upgraded refrigerator, vinyl plank floors in living room, kitchen, and bathroom. The primary bedroom includes a bathroom, with a shower and handicap accessible shower and dual sinks. Two more bedrooms and a laundry room with washer and dryer. There is a ramp to the home, front entry and a storage shed. Sold ''as is where is''. Must be park approved. Agent/buyer to verify home details, taxes, etc.
-
2022-08-03$51,900 498-char remark
Show marketing remark (498 chars)
This inviting Double Wide is your next home, with a wooden deck and attached entrance. There is an upgraded refrigerator, vinyl plank floors in living room, kitchen, and bathroom. The primary bedroom includes a bathroom, with a shower and handicap accessible shower and dual sinks. Two more bedrooms and a laundry room with washer and dryer. There is a ramp to the home, front entry and a storage shed. Sold ''as is where is''. Must be park approved. Agent/buyer to verify home details, taxes, etc.
ⓘ Source: listings_history table (triggers on properties + properties_extension) + one-shot
backfill from property_details.listing_events for pre-trigger history.
Tax reassessment forecast ND · Resets to sale price
- Current annual tax
- $559 · $47/mo
- Projected year-2 tax
- $559 · $47/mo
- Expected delta
- $0/yr ($0/mo · 0.0%)
ⓘ Screening estimate from a state-policy table — verify with the county assessor before closing.
Climate risk First Street
- Flood 1/10 Low FEMA zone X (shaded) · 0% chance over 30 yrs
- Wildfire 4/10 Moderate
- Heat 2/10 Low 7 d/yr ≥97°F today · 12 d/yr by 30 yrs out
- Wind 2/10 Low
- Air quality 4/10 Moderate 5 unhealthy d/yr today · 5 by 30 yrs out
Nearby sold comps map
Loading sold comps map…
Walkable amenities ~0.75 mi
Loading nearby amenities…
Taxation est. · year 1
- Rental income
- $17,955
- − Mortgage interest
- −$3,193
- − Property taxes
- −$559
- − Insurance
- −$285
- − Repairs & maintenance
- −$1,436
- − Management
- −$1,436
- − HOA
- −$10,356
- − Depreciation
- −$1,658
- Taxable loss
- −$969
- Est. tax savings @ 24.0%
- +$233
- After-tax cash flow
- $-370/yr
For passive investors: Depreciation is non-cash, so a rental often shows a tax loss while cash-flowing — sheltering income. Rental losses are passive: they offset passive income freely, and up to $25,000/yr can offset ordinary (W-2) income if you actively participate and your MAGI is under $100k (phasing out to $0 by $150k); unused losses carry forward. On sale, claimed depreciation is recaptured at up to 25%, and gains may owe capital-gains tax (a 1031 exchange can defer both). Figures are a year-1 estimate at your 24.0% rate — not tax advice; consult a CPA.
Schools (NCES district)
- District
- Bismarck 1
- NCES district ID
- 3800014
- Math proficiency
- 41% ▼ -5.00%
- Reading proficiency
- 42% ▼ -6.00%
- Median HH income
- $60,649
- Composite
- 36.76/100
- National rank
- #4577
- State rank
- #25 of 53 in ND
Livability — Bismarck
- Score
- 79/100
- State rank
- #5
- US rank
- #2213
Category grades
Schools grade is shown separately in the Schools card above.
Census & demographics
- Census place
- Bismarck, ND
- County
- Burleigh County · 97,300 people
- City population
- 97,300
- Metro
- Bismarck, ND
- Population (ZIP)
- 30,212
- Household income
- $85,637
- Rent vs Own
- Severe rent burden
- 400.0
Population outlook (Burleigh County) Hauer SSP2
- Today (2025)
- 119,359 people
- By 2030
- 133,047 · +11.5%
- By 2040
- 161,545 · +35.3%
- By 2050
- 191,960 · +60.8%
- By 2075
- 274,569 · +130.0%
- By 2100
- 350,910 · +194.0%
Race, ethnicity, and origin ACS 2023
- Neighborhood character
- Predominantly White (84%)
- Race & ethnicity
- White 84% Native American 8% Two or more races 5% Hispanic / Latino 4%
- Common ancestry
- Portuguese 13% Scotch-Irish 5% Romanian 2%
- Foreign-born
- 2% · Canada
- Languages at home
- 97% English-only · Spanish 2%
Political lean MEDSL · Burleigh
- 2024 margin
- Solid R (+43.2) · D 27.5% · R 70.7% · Other 1.8%
- 2008→2024 swing
- -19.7pp toward R · 2008: -23.6pp · 2024: -43.2pp
- All cycles
- 2024: R+43.2 2020: R+40.2 2016: R+46.1 2012: R+32.1 2008: R+23.6
Not yet ingested
- Civics
- —
Market trends
- HPI YoY
- ▼ -158.70%
- Current HPI
- 210.0651
- Rent YoY
- ▲ 2.81%
- Metro
- Bismarck, ND
- State GDP YoY
- ▲ 2.09%
- F500 in state
- 2
Industry mix (Fortune 500 HQ in ND)
| Industry | F500 HQs | Revenue |
|---|---|---|
| Utilities / Construction | 1 | $6B |
|
||
Price history
+9.8% since first listed5 events — show timeline
- 2026-04-10 Pending — GNMLS
- 2026-03-25 Price Changed $57,000 GNMLS
- 2026-02-10 Listed $60,000 GNMLS
- 2022-09-30 Sold (MLS) — GNMLS
- 2022-08-03 Listed $51,900 GNMLS
Cash-flow waterfall
monthlySold comps — $/sqft
last 12 mo · ≤1 miLoading sold comps…