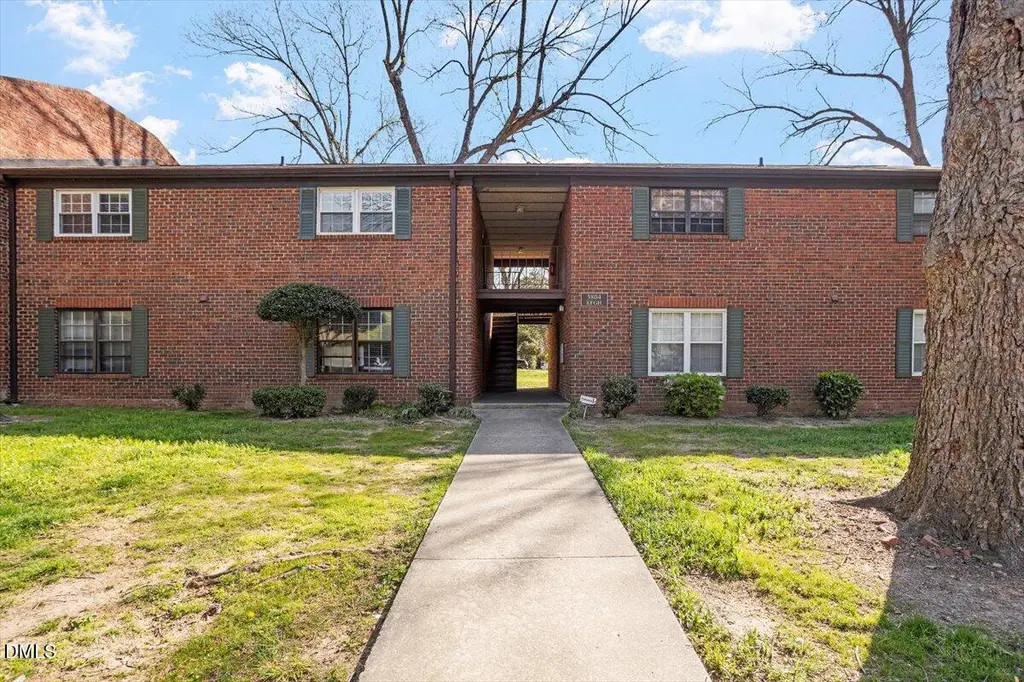
5804 Falls Of Neuse Rd Unit G · Raleigh, NC
Flood risk 1/10 · Minimal
- FEMA flood zone
- X (unshaded)
- Chance of flooding over 30 yrs
- 0.0%
- Est. flood insurance / yr
- $507 – $1,088
Fire risk 1/10 · Minimal
- Est. fire insurance / yr
- $906 – $1,684
Heat risk 6/10 · Moderate
- Hot days now (above 105°F)
- 7 days/yr
- Hot days in 30 yrs
- 17 days/yr
Wind risk 6/10 · Moderate
- Chance of severe wind over 30 yrs
- 58.0%
Air-quality risk 3/10 · Minor
- Unhealthy air days now
- 2 days/yr
- Unhealthy air days in 30 yrs
- 2 days/yr
Risk factors via First Street. Map © Google.
Why this score? — see what drove the D grade
The composite is a weighted blend of 9 inputs, each scored 0–100. Each bar is that input's sub-score; the figure is the points it added to the 100-point composite (weight × sub-score).
- Cash flow +11.7/30.0
- ARV discount +7.5/15.0
- 1% rule +4.9/10.0
- Schools +4.9/10.0
- Livability +4.2/5.0
- DSCR +3.4/10.0
- Condition / age +2.5/5.0
- Rent growth +2.1/5.0
- Appreciation +0.0/10.0
$157,799
🖨 Deal sheet (PDF) 📄 Offer letter ✓ Due diligence
Listing remarks MLS
Updated kitchen with granite counters and stainless steel appliances - Renovated bathrooms with updated cabinets - Custom shower in primary bath - Laminate floors - Private balcony - Freshly painted - One assigned parking space and ample amounts of shared parking spaces - Neighborhood pool - Refrigerator, washer and dryer provided - Walk to restaurants & shopping
Key facts
- $250 HOA
- Parking
- Community pool
Neighborhood map
What this means for you Summary
Snapshot
- This is a 2-bed/2.0-bath condo listed at $158k.
Deal economics
- At list price, monthly cash flow is $-46 ($-557/yr) — negative.
- To cash-flow at today's rent, offer at most $150k (5.2% below list).
- To meet the 1% rule (rent ≥ 1% of price), the offer needs to be $157k (0.8% below list).
- Recommended offer: $150k (5.2% below list) — sets the bar for cash-flow.
- Cap rate 5.9% vs local median 2.7% in Raleigh — top-decile yield for the area; either an underpriced asset or a hidden risk that comps aren't pricing in. Stress-test before assuming the spread holds.
Location & tenants
- Location reads 83/100 on livability (#10 in NC, #1,028 nationally) — a professional / high-income tenant draw. Strengths: amenities A+, commute A+, housing A+; Watch: crime F.
- Wake County Schools (suburban): math 52% / reading 60% proficiency, ranked #35 of 178 in NC (top 20%) — acceptable for families but not a draw, mixed tenant base, ~2y average lease.
- Zoned schools: Millbrook Elementary (math 32% / reading 32%, grade F, #908 of 1,410 statewide, top 67%, 529 students, 80% FRL); East Millbrook Middle (math 17% / reading 27%, grade F, #416 of 475 statewide, top 89%, 769 students, 73% FRL); Millbrook High (math 56% / reading 68%, grade B-, #184 of 535 statewide, top 37%, 2,421 students, 36% FRL) — zoned schools average 63% FRL vs 30% district-wide (33 pts higher); higher-poverty schools than district average — tighter screening recommended.
- Zoned-school proficiency averages 39% at this address vs 56% district-wide (-17 pts) — the specific schools serving this property underperform the Wake County Schools average; the district grade overstates school quality for this exact location.
- Market conditions: Rents soft (-1.6%/yr); 258 active listings in the ZIP; 37 comparable units currently listed for rent nearby; rentals leasing fast (median 6d on market — plan ~1-2 weeks tenant-placement turnaround); solid renter incomes; 15,249 units permitted in Wake County in 2024 (5,568 in 5+ unit buildings).
Forward outlook
- Local home prices are declining (-3.0%/yr); year-one equity from $1k of loan paydown is wiped out by about $5k of value loss. Plan a longer hold.
- Wake County population projected at +51% by 2050 — long-run rental-demand tailwind backs the buy-and-hold thesis.
Negotiation context
- Only 1 days on market — expect competitive offers; lowballing is unlikely to land.
- 2 sale attempts since 2y ago with the ask held roughly flat each time — persistent listings suggest the price (not the market) is what's stuck; bring a comps-based counter.
Risks & watch-outs
- Climate carrying-cost: major wind risk, 58% chance of damaging wind over 30y; extreme-heat days projected 7→17/yr by 2055 (HVAC capex compounding) — expect insurance premiums to compound above CPI over the hold.
Questions for the listing agent
- What do current leases actually rent for vs. the listed asking? Can we see a recent rent roll and the last 12 months of T-12 income?
- What does the HOA fee cover, when was the last increase, and are there any pending special assessments or reserve-fund shortfalls?
- Any open or pending special assessments — roof, HVAC, plumbing, elevator, façade? What's the per-unit balance and payoff schedule, and is the seller paying it off at close or rolling it to the buyer?
- Is there a deadline driving the sale (1031 exchange, divorce, estate, relocation)? That informs how much negotiation room exists.
- Schools are B-rated — typically a magnet for longer-tenancy family renters. What's the average tenant stay here, and is there a school-zone premium baked into asking?
- Crime grade is F in this area — have there been break-ins, vandalism, or insurance claims at this property in the last 3 years? What carrier currently insures it and at what premium?
- The area grade is low — what's the realistic commute time and amenity access for the typical tenant pool here? Any planned neighborhood developments (good or bad) we should know about?
- What's the average days-on-market for RENTAL listings here right now (not sales)? A rising rental-DOM trend means longer vacancies and softer asking-rent achievability than the comps imply.
- What's the recent tenant-quality profile in this submarket — average credit score on applications, eviction rate, late-payment / NSF rate, and stable-employment percentage? A property-management company in the area should have these aggregated.
- How much new apartment / multifamily construction is in the pipeline within 1–3 miles? Heavy new supply (>2% of stock underway) typically softens rents 12–24 months out; light construction supports rent growth.
Investment metrics
- 1% rule
- 0.99% ✗
- Cap rate
- 5.94%
- Cash-on-cash
- -1.26%
- DSCR
- 0.94
- GRM
- 8.4
CMA / ARV
No comps found within radius.
Projected returns pro-forma
-3.0% appreciation · 0.0% rent growth · sell at horizon
- IRR
- -22.3%
- Equity multiple
- 0.25×
- Total profit
- $-32,973
- Equity at exit
- $23,528
- IRR
- -29.1%
- Equity multiple
- -0.12×
- Total profit
- $-49,670
- Equity at exit
- $13,644
Cash invested: $44,184 (down + closing). Projections, not guarantees.
Landlord ↔ Tenant lean methodology
- Overall (STATE)
- 85 Strongly Landlord-Friendly
- State North Carolina
- 85 Strongly Landlord-Friendly · R+3
- County
- — inherits STATE
- City
- — inherits STATE
ZIP-level market 27609
- Rents YoY
- -1.6%
- Active inventory
- 258
- Price-to-rent
- 8.4×
Monthly cashflow live
- Estimated rent
- $1,565 high interval (Pro) →
- Mortgage (P&I)
- −$828
- Tax from tax record
- −$140 /mo · $1,675/yr
- Insurance
- −$66
- HOA
- −$250
- Vacancy / Maint / Mgmt
- −$329
- Net cashflow
- $-46
Break-even live
Sensitivity live
| Price | -10% $43 | -5% $-2 | +0% $-46 | +5% $-91 | +10% $-136 |
|---|---|---|---|---|---|
| Rent | -10% $-170 | -5% $-108 | +0% $-46 | +5% $15 | +10% $77 |
| Rate | -1.0pp $33 | -0.5pp $-6 | base $-46 | +0.5pp $-87 | +1.0pp $-129 |
UW: 25.0% down · 7.5% · 30yr · 1.5% tax · 5.0% vac · 8.0% maint · 8.0% mgmt
Financing live
Cash to close
- Down payment
- $39,450
- Closing costs
- $4,734
- Reserves months
- —
- Total cash needed
- —
Loan-product check · same deal, 3 products live
Conventional
25% down · 7.5% · 30yr
- Down + closing
- —
- Monthly P&I
- —
- Monthly cashflow
- —
- DSCR
- —
- Eligible?
- —
Personal DTI + credit; lowest rate.
DSCR
20% down · 8.5% · 30yr
- Down + closing
- —
- Monthly P&I
- —
- Monthly cashflow
- —
- DSCR
- —
- Eligible?
- —
No personal income docs; deal must DSCR.
Hard money
10% down · 12.0% · 12mo
- Down + closing
- —
- Monthly P&I
- —
- Monthly cashflow
- —
- DSCR
- —
- Eligible?
- —
Short-term bridge; refi at stabilization.
Rent comps 37 comps
| Address | Beds | Baths | Sqft | Rent | $/sqft | DOM | Units | Dist |
|---|---|---|---|---|---|---|---|---|
| 5805 Nottoway Ct Raleigh, NC | 2.0 | 2.5 | 1368 | $1,595 | $1.17 | 14d | 1 | 0.04mi |
| 1209 Manassas Ct Unit C Raleigh, NC | 2.0 | 2.5 | 1262 | $1,400 | $1.11 | 4d | 1 | 0.13mi |
| 1208 Manassas Ct Unit A Raleigh, NC | 2.0 | 2.0 | 1010 | $1,450 | $1.44 | 25d | 1 | 0.19mi |
| 5712 Finsbury Ct Raleigh, NC | 3.0 | 2.5 | 1224 | $1,800 | $1.47 | 25d | 1 | 0.29mi |
| 800 Green Ridge Dr Raleigh, NC | 3.0 | 2.0 | 1438 | $1,695 | $1.18 | 25d | 1 | 0.44mi |
| 6416 Meadow View Dr Raleigh, NC | 2.0 | 2.5 | 1432 | $1,695 | $1.18 | 16d | 1 | 0.50mi |
| 700 Spring Falls Dr Raleigh, NC | 2.0 | 2.0 | 1088 | $1,731 | $1.59 | 25d | 1 | 0.54mi |
| 700 Spring Falls Dr Raleigh, NC | 1.0 | 1.0 | 868 | $1,484 | $1.71 | 3d | 18 | 0.54mi |
| 5315 Covey Ct Raleigh, NC | 2.0 | 1.0 | 1299 | $2,025 | $1.56 | 23d | 1 | 0.60mi |
| 6435 New Market Way Raleigh, NC | 3.0 | 2.5 | 1389 | $2,000 | $1.44 | 25d | 1 | 0.63mi |
| 7040 Sandy Forks Rd Raleigh, NC | 2.0 | 2.0 | 1184 | $1,600 | $1.35 | 25d | 1 | 0.67mi |
| 7010 Sandy Forks Rd Raleigh, NC | 2.0 | 2.0 | 1122 | $1,500 | $1.34 | 25d | 1 | 0.70mi |
| 6625 Lake Hill Dr Raleigh, NC | 2.0 | 1.0–2.0 | 767 | $1,409 | $1.84 | 3d | 41 | 0.73mi |
| 5825 Pointer Dr Raleigh, NC | 1.0–2.0 | 1.0–2.0 | 885 | $1,649 | $1.86 | 4d | 17 | 0.81mi |
| 1401 E Millbrook Rd Raleigh, NC | 1.0–3.0 | 1.0–2.0 | 870 | $1,298 | $1.49 | 19d | 13 | 0.81mi |
| 6301 Lakecrest Dr Raleigh, NC | 1.0–3.0 | 1.0–2.0 | 1155 | $2,024 | $1.75 | 3d | 41 | 0.84mi |
| 6317 Shanda Dr Raleigh, NC | 1.0–3.0 | 1.0–2.0 | 917 | $1,346 | $1.47 | 3d | 49 | 0.84mi |
| 5837 Shady Grove Cir Raleigh, NC | 2.0 | 1.5 | 1056 | $1,500 | $1.42 | 5d | 1 | 0.87mi |
| 5606 Split Oak Way Raleigh, NC | 2.0 | 2.5 | 1290 | $1,600 | $1.24 | 14d | 1 | 0.88mi |
| 1019 Fox Hunt Ln Raleigh, NC | 1.0–2.0 | 1.0–1.5 | 945 | $1,359 | $1.44 | 5d | 6 | 1.10mi |
| 1729 Grace Brook Rd Raleigh, NC | 2.0 | 3.0 | 1200 | $1,650 | $1.38 | 14d | 1 | 1.16mi |
| 5540 Atlantic Crossing Dr Brentwood, NC | 1.0–2.0 | 1.0–2.0 | 930 | $1,951 | $2.10 | 4d | 30 | 1.17mi |
| 1500 Sunbow Falls Ln Raleigh, NC | 1.0–3.0 | 1.0–2.0 | 934 | $1,463 | $1.57 | 3d | 24 | 1.19mi |
| 6320 Dowd Forest Dr Raleigh, NC | 1.0–3.0 | 1.0–2.0 | 1034 | $1,450 | $1.40 | 4d | 23 | 1.22mi |
| 4717 Radcliff Rd Raleigh, NC | 3.0 | 2.0 | 1121 | $1,850 | $1.65 | 14d | 1 | 1.24mi |
| 5581 Burnlee Pl Raleigh, NC | 2.0 | 1.5 | 1079 | $1,489 | $1.38 | 5d | 3 | 1.25mi |
| 5341 Arrival Dr Raleigh, NC | 3.0 | 1.0–2.0 | 804 | $1,627 | $2.02 | 3d | 124 | 1.25mi |
| 5499 Tralee Pl Raleigh, NC | 2.0 | 1.5 | 1100 | $1,299 | $1.18 | 4d | 3 | 1.27mi |
| 6350 Terra Verde Dr Raleigh, NC | 1.0–3.0 | 1.0–2.0 | 1117 | $1,593 | $1.43 | 3d | 28 | 1.29mi |
| 120 Ridgewood Dr Raleigh, NC | 1.0–2.0 | 1.0 | 673 | $1,275 | $1.89 | 3d | 10 | 1.35mi |
| 317 Lynn Rd Raleigh, NC | 3.0 | 2.0 | 1128 | $1,704 | $1.51 | 25d | 1 | 1.35mi |
| 317 Lynn Rd Raleigh, NC | 2.0 | 2.0 | 908 | $1,304 | $1.44 | 4d | 1 | 1.35mi |
| 2525 Pavilion Pl Raleigh, NC | 1.0–3.0 | 1.0–2.0 | 1012 | $1,535 | $1.52 | 4d | 24 | 1.37mi |
| 2611 Torquay Xing Raleigh, NC | 1.0–3.0 | 1.0–2.0 | 949 | $1,262 | $1.33 | 3d | 7 | 1.43mi |
| 214 Loft Ln Raleigh, NC | 1.0–3.0 | 1.0–2.0 | 1067 | $1,530 | $1.43 | 4d | 19 | 1.45mi |
| 3102 Berkeley Springs Pl Raleigh, NC | 2.0 | 2.5 | 1384 | $1,600 | $1.16 | 25d | 1 | 1.49mi |
| 6820 Woodbend Dr Raleigh, NC | 1.0–2.0 | 1.0 | 725 | $1,260 | $1.74 | 3d | 18 | 1.49mi |
HOA detail condo
- Monthly dues
- $250 · $3,000/yr
- Likely covers
- poolparking
- Assessments
- None detected in remarks — confirm with the listing agent.
Listing history 8 events
-
2026-04-03status Pending
-
2026-04-02$157,799 Active
-
2024-10-24soldstatus $190,000 Sold 372-char remark
Show marketing remark (372 chars)
Updated kitchen with granite counters and stainless steel appliances - Renovated bathrooms with updated cabinets - Custom shower in primary bath - Laminate floors - Private balcony - Freshly painted - One assigned parking space and ample amounts of shared parking spaces - Neighborhood pool - Refrigerator, washer and dryer provided - Walk to restaurants & shopping
-
2024-10-24soldstatus $190,000
Show marketing remark (372 chars)
Updated kitchen with granite counters and stainless steel appliances - Renovated bathrooms with updated cabinets - Custom shower in primary bath - Laminate floors - Private balcony - Freshly painted - One assigned parking space and ample amounts of shared parking spaces - Neighborhood pool - Refrigerator, washer and dryer provided - Walk to restaurants & shopping
-
2024-10-14status Pending 372-char remark
Show marketing remark (372 chars)
Updated kitchen with granite counters and stainless steel appliances - Renovated bathrooms with updated cabinets - Custom shower in primary bath - Laminate floors - Private balcony - Freshly painted - One assigned parking space and ample amounts of shared parking spaces - Neighborhood pool - Refrigerator, washer and dryer provided - Walk to restaurants & shopping
-
2024-09-25$199,900 Active 372-char remark
Show marketing remark (372 chars)
Updated kitchen with granite counters and stainless steel appliances - Renovated bathrooms with updated cabinets - Custom shower in primary bath - Laminate floors - Private balcony - Freshly painted - One assigned parking space and ample amounts of shared parking spaces - Neighborhood pool - Refrigerator, washer and dryer provided - Walk to restaurants & shopping
-
1996-12-31soldstatus $56,000
-
1981-11-01soldstatus $36,000
ⓘ Source: listings_history table (triggers on properties + properties_extension) + one-shot
backfill from property_details.listing_events for pre-trigger history.
Tax reassessment forecast NC · Resets to sale price
- Current annual tax
- $1,675 · $140/mo
- Projected year-2 tax
- $1,675 · $140/mo
- Expected delta
- $0/yr ($0/mo · 0.0%)
ⓘ Screening estimate from a state-policy table — verify with the county assessor before closing.
Climate risk First Street
- Flood 1/10 Low FEMA zone X (unshaded) · 0% chance over 30 yrs
- Wildfire 1/10 Low
- Heat 6/10 Major 7 d/yr ≥105°F today · 17 d/yr by 30 yrs out
- Wind 6/10 Major 58% chance of damaging wind over 30 yrs
- Air quality 3/10 Moderate 2 unhealthy d/yr today · 2 by 30 yrs out
Nearby sold comps map
Loading sold comps map…
Walkable amenities ~0.75 mi
Loading nearby amenities…
Taxation est. · year 1
- Rental income
- $18,780
- − Mortgage interest
- −$8,839
- − Property taxes
- −$1,675
- − Insurance
- −$789
- − Repairs & maintenance
- −$1,502
- − Management
- −$1,502
- − HOA
- −$3,000
- − Depreciation
- −$4,591
- Taxable loss
- −$3,118
- Est. tax savings @ 24.0%
- +$748
- After-tax cash flow
- $191/yr
For passive investors: Depreciation is non-cash, so a rental often shows a tax loss while cash-flowing — sheltering income. Rental losses are passive: they offset passive income freely, and up to $25,000/yr can offset ordinary (W-2) income if you actively participate and your MAGI is under $100k (phasing out to $0 by $150k); unused losses carry forward. On sale, claimed depreciation is recaptured at up to 25%, and gains may owe capital-gains tax (a 1031 exchange can defer both). Figures are a year-1 estimate at your 24.0% rate — not tax advice; consult a CPA.
Schools (NCES district)
- District
- Wake County Schools
- NCES district ID
- 3704720
- Math proficiency
- 52% ▲ 2.00%
- Reading proficiency
- 60% ▲ 4.00%
- Median HH income
- $67,509
- Composite
- 49.41/100
- National rank
- #2010
- State rank
- #35 of 178 in NC
Livability — Raleigh
- Score
- 83/100
- State rank
- #10
- US rank
- #1028
Category grades
Schools grade is shown separately in the Schools card above.
Census & demographics
- Census place
- Raleigh, NC
- County
- Wake County · 1,216,256 people
- City population
- 569,344
- Metro
- Raleigh-Cary, NC
- Population (ZIP)
- 35,573
- Household income
- $83,065
- Rent vs Own
- Severe rent burden
- 1774.0
Population outlook (Wake County) Hauer SSP2
- Today (2025)
- 1,293,152 people
- By 2030
- 1,428,223 · +10.4%
- By 2040
- 1,698,188 · +31.3%
- By 2050
- 1,955,807 · +51.2%
- By 2075
- 2,520,273 · +94.9%
- By 2100
- 2,893,335 · +123.7%
Race, ethnicity, and origin ACS 2023
- Neighborhood character
- Predominantly White (67%)
- Race & ethnicity
- White 67% Black 13% Hispanic / Latino 13% Two or more races 8% Asian 2%
- Hispanic origin (detail)
- Mexican 8%
- Common ancestry
- Slovak 3% Serbian 3% Iranian 2%
- Foreign-born
- 12% · Canada
- Languages at home
- 82% English-only · Spanish 12% French/Haitian/Cajun 1% Other Indo-European 1%
Political lean MEDSL · Wake
- 2024 margin
- Strong D (+25.5) · D 61.9% · R 36.4% · Other 1.7%
- 2008→2024 swing
- +11.1pp toward D · 2008: 14.4pp · 2024: 25.5pp
- All cycles
- 2024: D+25.5 2020: D+26.4 2016: D+20.5 2012: D+10.2 2008: D+14.4
Not yet ingested
- Civics
- —
Market trends
- HPI YoY
- ▼ -503.19%
- Current HPI
- 317.0251
- Rent YoY
- ▼ -1.57%
- Metro
- Raleigh-Cary, NC
- State GDP YoY
- ▲ 3.28%
- F500 in state
- 26
Industry mix (Fortune 500 HQ in NC)
| Industry | F500 HQs | Revenue |
|---|---|---|
| Financial Services | 2 | $213B |
|
||
| Retail | 2 | $95B |
|
||
| Industrial Conglomerate | 1 | $38B |
|
||
| Metals / Steel | 1 | $35B |
|
||
| Utilities | 1 | $30B |
|
||
| Industrial Machinery | 1 | $19B |
|
||
Price history
+338.3% since first listed8 events — show timeline
- 2026-04-03 Pending — TMLS
- 2026-04-02 Listed $157,799 TMLS
- 2024-10-24 Sold (Public Records) $190,000 Public Records
- 2024-10-24 Sold (MLS) $190,000 TMLS
- 2024-10-14 Pending — TMLS
- 2024-09-25 Listed $199,900 TMLS
- 1996-12-31 Sold (Public Records) $56,000 Public Records
- 1981-11-01 Sold (Public Records) $36,000 Public Records
Property tax history
+6.5%/yrLatest (2025): $1,675 · +0.4% YoY. Source: county tax records.
Cash-flow waterfall
monthlySold comps — $/sqft
last 12 mo · ≤1 miLoading sold comps…