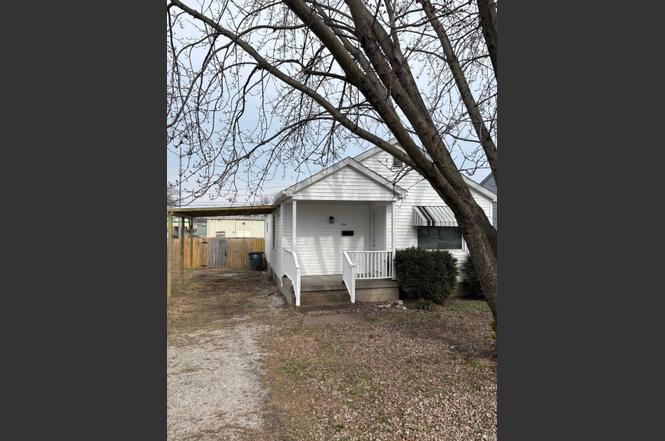
2164 E Eichel Ave · Evansville, IN
Flood risk 3/10 · Minor
- FEMA flood zone
- X (unshaded)
- Chance of flooding over 30 yrs
- 0.2%
- Est. flood insurance / yr
- $507 – $1,088
Fire risk 1/10 · Minimal
- Est. fire insurance / yr
- $717 – $1,331
Heat risk 5/10 · Moderate
- Hot days now (above 106°F)
- 7 days/yr
- Hot days in 30 yrs
- 19 days/yr
Wind risk 2/10 · Minimal
- Chance of severe wind over 30 yrs
- 3.0%
Air-quality risk 3/10 · Minor
- Unhealthy air days now
- 3 days/yr
- Unhealthy air days in 30 yrs
- 4 days/yr
Risk factors via First Street. Map © Google.
Why this score? — see what drove the D+ grade
The composite is a weighted blend of 9 inputs, each scored 0–100. Each bar is that input's sub-score; the figure is the points it added to the 100-point composite (weight × sub-score).
- Cash flow +15.8/30.0
- ARV discount +13.1/15.0
- DSCR +4.9/10.0
- Schools +3.3/10.0
- 1% rule +3.2/10.0
- Livability +3.2/5.0
- Rent growth +2.5/5.0
- Condition / age +2.5/5.0
- Appreciation +0.0/10.0
$125,000
🖨 Deal sheet (PDF) 📄 Offer letter ✓ Due diligence
Listing remarks MLS
Unlock the potential of this one-story home, in Evansville. Featuring 2 bedrooms and 1 bathroom, this fixer-upper is ripe for renovation and offers a fantastic canvas for value addition. The property includes a privacy-fenced rear yard. Ideal for savvy investors looking to capitalize on a renovation opportunity. With some creative vision and TLC, this property can be transformed into a lucrative asset. Seize the chance to enhance your investment portfolio with this gem!
Key facts
- New siding
- Shed
- New gutters
Tags
Property features AI
Exterior
- Parking: Gravel parking
- Utilities: Public water; Public sewer; Electric water heater
- Home design: Single-family residence; Site-built home; 1 story
- Construction: Vinyl siding; Shingle roof; Crawl space foundation; Built as a site-built home
- Exterior features: Privacy wood fencing; Shed(s); Level lot; Lot dimensions approximately 80 x 126
Interior
- Kitchen: Dishwasher; Disposal; Microwave; Refrigerator; Gas cooktop; Gas oven; Laminate counters
- Bedrooms: Total rooms: 5
- Flooring: Vinyl
- Bathrooms: 1 full bathroom (main level)
- Heating & cooling: Natural gas heating; Floor furnace; Central air; Ceiling fans
- Interior features: Laminate counters; Blinds; Disposal; Dishwasher; Microwave; Refrigerator; Gas cooktop; Gas oven; Electric water heater; Water heater; Vinyl flooring
- Laundry & utility: Washer; Dryer; Main-level laundry
Neighborhood map
What this means for you Summary
Snapshot
- This is a 2-bed/1.0-bath single-family listed at $125k.
Deal economics
- At list price, monthly cash flow is $57 ($684/yr) — positive.
- The deal already cash-flows at list — no discount required.
- To meet the 1% rule (rent ≥ 1% of price), the offer needs to be $102k (18.0% below list).
- Recommended offer: $102k (18.0% below list) — sets the bar for 1% rule.
- Cap rate 6.8% vs local median 4.6% in Evansville — top-decile yield for the area; either an underpriced asset or a hidden risk that comps aren't pricing in. Stress-test before assuming the spread holds.
Location & tenants
- Location reads 63/100 on livability (#416 in IN) — a middle-class / working-renter tenant base. Strengths: cost of living A+, housing A+, health & safety A+; Watch: crime F, commute F, employment D-.
- Evansville Vanderburgh School Corporation (urban): math 36% / reading 43% proficiency, ranked #153 of 301 in IN (top 51%) — families likely to look elsewhere, expect single-tenant / working-renter base with shorter leases.
- Zoned schools: Vogel Elementary School (math 38% / reading 33%, grade F, #584 of 994 statewide, top 59%, 523 students, 64% FRL); North Junior High School (math 44% / reading 57%, grade C, #43 of 330 statewide, top 14%, 929 students, 42% FRL); North High School (math 57% / reading 74%, grade B, #29 of 369 statewide, top 8%, 1,674 students, 35% FRL) — zoned schools at 47% FRL track the district average.
- Market conditions: 264 active listings in the ZIP; 12 comparable units currently listed for rent nearby; rentals at typical pace (median 15d on market — plan ~3-4 weeks tenant-placement turnaround); solid renter incomes; 508 units permitted in Vanderburgh County in 2024 (32 in 5+ unit buildings).
- This rent is only 13% of the median local income ($95k/yr) — well below the 30% rent-burden line; pricing power to push rent on renewal without tenant pushback.
Forward outlook
- Local home prices are declining (-3.0%/yr); year-one equity from $864 of loan paydown is wiped out by about $4k of value loss. Plan a longer hold.
Negotiation context
- It's been on market 160 days — a 12% lower offer ($110k) is reasonable based on typical stale-listing flexibility.
- 2 sale attempts since 2y ago; this cycle's ask has dropped $39k (24%) from the opening price — seller is motivated, your offer sets the floor, not the list.
- Current owner paid $50k; list at $125k implies a 150% gain — meaningful room to come down on a strong offer.
Risks & watch-outs
- Watch-outs: built in 1940 — expect roof / HVAC / electrical / plumbing capex.
- Climate carrying-cost: extreme-heat days projected 7→19/yr by 2055 (HVAC capex compounding) — expect insurance premiums to compound above CPI over the hold.
Questions for the listing agent
- It's been on market 160 days. Have you received any prior offers? Is the seller open to a 18% concession, seller financing, or rate buy-down credit?
- Built in 1940 — when were the roof, HVAC, electrical panel, plumbing, and water heater last replaced?
- Why hasn't it sold? Are there any deal-killer items the seller is aware of (foundation, flood, title, zoning, code violations)?
- Is there a deadline driving the sale (1031 exchange, divorce, estate, relocation)? That informs how much negotiation room exists.
- Schools are D-rated, which usually means shorter tenancies and higher turnover. Who's the typical renter profile here, and what's been the actual vacancy rate?
- Crime grade is F in this area — have there been break-ins, vandalism, or insurance claims at this property in the last 3 years? What carrier currently insures it and at what premium?
- The area grade is low — what's the realistic commute time and amenity access for the typical tenant pool here? Any planned neighborhood developments (good or bad) we should know about?
- What's the average days-on-market for RENTAL listings here right now (not sales)? A rising rental-DOM trend means longer vacancies and softer asking-rent achievability than the comps imply.
- What's the recent tenant-quality profile in this submarket — average credit score on applications, eviction rate, late-payment / NSF rate, and stable-employment percentage? A property-management company in the area should have these aggregated.
- How much new for-sale + rental construction is in the pipeline within 1–3 miles? Heavy new supply typically softens prices + rents 12–24 months out; constrained supply supports both.
Investment metrics
- 1% rule
- 0.82% ✗
- Cap rate
- 6.84%
- Cash-on-cash
- 1.95%
- DSCR
- 1.09
- GRM
- 10.2
CMA / ARV
- ARV (on-the-fly)
- $142,800
- Comps found
- 12
Show comp detail 12 sales within ~0.75 mi
| Address | Dist | Beds/Ba | Sqft | Sold | Price | $/sf | Match |
|---|---|---|---|---|---|---|---|
| 1814 E Morgan Ave | 0.31mi | 2/1.0 | 814 (-3%) | 7mo | $118,000 | $145 | 74 |
| 1917 Keck Ave | 0.39mi | 2/1.0 | 816 (-3%) | 7mo | $150,000 | $184 | 71 |
| 904 N Lincoln Park Dr | 0.41mi | 3/1.0 (+1) | 864 (+3%) | 1mo | $186,500 | $216 | 70 |
| 1801 Hercules Ave | 0.34mi | 2/1.0 | 914 (+9%) | 0mo | $150,000 | $164 | 69 |
| 2037 E Virginia St | 0.64mi | 2/1.0 | 822 (-2%) | 1mo | $139,900 | $170 | 66 |
| 2108 Hercules Ave | 0.51mi | 2/1.0 | 764 (-9%) | 5mo | $110,000 | $144 | 57 |
| 1699 Harding Ave | 0.67mi | 2/1.0 | 896 (+7%) | 4mo | $119,900 | $134 | 54 |
| 1909 Haven Dr | 0.64mi | 3/1.0 (+1) | 868 (+3%) | 6mo | $134,900 | $155 | 54 |
| 3040 E Morgan Ave | 0.74mi | 2/1.0 | 900 (+7%) | 1mo | $42,000 | $47 | 53 |
| 803 Hercules Ave | 0.51mi | 2/1.5 | 758 (-10%) | 6mo | $128,500 | $170 | 52 |
| 1821 Harding Ave | 0.70mi | 2/1.0 | 720 (-14%) | 3mo | $130,000 | $181 | 41 |
| 2318 E Franklin St | 0.74mi | 3/1.0 (+1) | 952 (+13%) | 4mo | $178,150 | $187 | 34 |
Match score weights: distance 35% · size 25% · config 20% · recency 20%. Top-matched comps best support the ARV.
Projected returns pro-forma
-3.0% appreciation · 3.0% rent growth · sell at horizon
- IRR
- -13.2%
- Equity multiple
- 0.52×
- Total profit
- $-16,679
- Equity at exit
- $18,638
- IRR
- -4.4%
- Equity multiple
- 0.71×
- Total profit
- $-10,065
- Equity at exit
- $10,808
Cash invested: $35,000 (down + closing). Projections, not guarantees.
Landlord ↔ Tenant lean methodology
- Overall (STATE)
- 90 Strongly Landlord-Friendly
- State Indiana
- 90 Strongly Landlord-Friendly · R+11
- County
- — inherits STATE
- City
- — inherits STATE
ZIP-level market 47111
- Active inventory
- 264
- Price-to-rent
- 10.2×
Monthly cashflow live
- Estimated rent
- $1,025 high interval (Pro) →
- Mortgage (P&I)
- −$656
- Tax from tax record
- −$45 /mo · $538/yr
- Insurance
- −$52
- HOA
- −$0
- Vacancy / Maint / Mgmt
- −$215
- Net cashflow
- $57
Break-even live
Sensitivity live
| Price | -10% $128 | -5% $92 | +0% $57 | +5% $22 | +10% $-14 |
|---|---|---|---|---|---|
| Rent | -10% $-24 | -5% $17 | +0% $57 | +5% $97 | +10% $138 |
| Rate | -1.0pp $120 | -0.5pp $89 | base $57 | +0.5pp $25 | +1.0pp $-8 |
UW: 25.0% down · 7.5% · 30yr · 1.5% tax · 5.0% vac · 8.0% maint · 8.0% mgmt
Financing live
Cash to close
- Down payment
- $31,250
- Closing costs
- $3,750
- Reserves months
- —
- Total cash needed
- —
Loan-product check · same deal, 3 products live
Conventional
25% down · 7.5% · 30yr
- Down + closing
- —
- Monthly P&I
- —
- Monthly cashflow
- —
- DSCR
- —
- Eligible?
- —
Personal DTI + credit; lowest rate.
DSCR
20% down · 8.5% · 30yr
- Down + closing
- —
- Monthly P&I
- —
- Monthly cashflow
- —
- DSCR
- —
- Eligible?
- —
No personal income docs; deal must DSCR.
Hard money
10% down · 12.0% · 12mo
- Down + closing
- —
- Monthly P&I
- —
- Monthly cashflow
- —
- DSCR
- —
- Eligible?
- —
Short-term bridge; refi at stabilization.
Rent comps 12 comps
| Address | Beds | Baths | Sqft | Rent | $/sqft | DOM | Units | Dist |
|---|---|---|---|---|---|---|---|---|
| 2151 E Columbia St #2193 Evansville, IN | 1.0 | 1.0 | 600 | $695 | $1.16 | 15d | 1 | 0.49mi |
| 1680 E Franklin St #1682 Evansville, IN | 2.0 | 1.0 | 675 | $855 | $1.27 | 23d | 7 | 0.87mi |
| 103 Princeton Ct Evansville, IN | 1.0 | 1.0 | 576 | $802 | $1.39 | 15d | 4 | 0.97mi |
| 210 S Weinbach Ave Evansville, IN | 3.0 | 1.0 | 1080 | $1,450 | $1.34 | 23d | 1 | 1.13mi |
| 1415 E Indiana St Evansville, IN | 2.0 | 1.0 | 814 | $795 | $0.98 | 15d | 1 | 1.14mi |
| 1219 Joan Ave Unit 1219 Evansville, IN | 2.0 | 1.0 | 725 | $845 | $1.17 | 15d | 1 | 1.15mi |
| 1440 E Division St Evansville, IN | 2.0 | 1.0 | 689 | $1,250 | $1.81 | 15d | 1 | 1.16mi |
| 1321 E Indiana St Evansville, IN | 2.0 | 1.0 | 964 | $1,050 | $1.09 | 15d | 1 | 1.21mi |
| 1303 E Indiana St Evansville, IN | 2.0 | 1.0 | 975 | $1,195 | $1.23 | 15d | 1 | 1.23mi |
| 1111 Stanley Ave Evansville, IN | 2.0 | 1.0 | 670 | $1,000 | $1.49 | 23d | 1 | 1.31mi |
| 2511 N Kentucky Ave Unit 23 Evansville, IN | 1.0 | 1.0 | 584 | $650 | $1.11 | 23d | 1 | 1.39mi |
| 941 Stanley Ave Unit A Evansville, IN | 1.0 | 1.0 | 850 | $800 | $0.94 | 23d | 1 | 1.46mi |
Listing history 25 events
-
2026-06-17status $125,000 Pending 160 DOM
-
2026-06-17days on market $125,000 Active 160 DOM
-
2026-06-16days on market $125,000 Active 159 DOM
-
2026-06-15days on market $125,000 Active 158 DOM
-
2026-06-14days on market $125,000 Active 156 DOM
-
2026-06-13days on market $125,000 Active 155 DOM
-
2026-06-10days on market $125,000 Active 153 DOM
-
2026-06-09days on market $125,000 Active 152 DOM
-
2026-06-08days on market $125,000 Active 151 DOM
-
2026-06-07pricedays on market $125,000 Active 150 DOM
-
2026-06-02days on market $130,000 Active 145 DOM
-
2026-06-01days on market $130,000 Active 144 DOM
-
2026-05-31days on market $130,000 Active 143 DOM
-
2026-05-30days on market $130,000 Active 142 DOM
-
2026-04-20price $130,000
-
2026-03-21price $134,000
-
2026-03-07price $139,000
-
2026-03-02price $144,000
-
2026-02-16price $149,000
-
2026-01-24price $154,000
-
2026-01-07$164,000 Active
-
2024-11-04soldstatus $50,000 Closed 474-char remark
Show marketing remark (474 chars)
Unlock the potential of this one-story home, in Evansville. Featuring 2 bedrooms and 1 bathroom, this fixer-upper is ripe for renovation and offers a fantastic canvas for value addition. The property includes a privacy-fenced rear yard. Ideal for savvy investors looking to capitalize on a renovation opportunity. With some creative vision and TLC, this property can be transformed into a lucrative asset. Seize the chance to enhance your investment portfolio with this gem!
-
2024-10-04status Pending 474-char remark
Show marketing remark (474 chars)
Unlock the potential of this one-story home, in Evansville. Featuring 2 bedrooms and 1 bathroom, this fixer-upper is ripe for renovation and offers a fantastic canvas for value addition. The property includes a privacy-fenced rear yard. Ideal for savvy investors looking to capitalize on a renovation opportunity. With some creative vision and TLC, this property can be transformed into a lucrative asset. Seize the chance to enhance your investment portfolio with this gem!
-
2024-09-13price $55,000 474-char remark
Show marketing remark (474 chars)
Unlock the potential of this one-story home, in Evansville. Featuring 2 bedrooms and 1 bathroom, this fixer-upper is ripe for renovation and offers a fantastic canvas for value addition. The property includes a privacy-fenced rear yard. Ideal for savvy investors looking to capitalize on a renovation opportunity. With some creative vision and TLC, this property can be transformed into a lucrative asset. Seize the chance to enhance your investment portfolio with this gem!
-
2024-07-31$59,900 Active 474-char remark
Show marketing remark (474 chars)
Unlock the potential of this one-story home, in Evansville. Featuring 2 bedrooms and 1 bathroom, this fixer-upper is ripe for renovation and offers a fantastic canvas for value addition. The property includes a privacy-fenced rear yard. Ideal for savvy investors looking to capitalize on a renovation opportunity. With some creative vision and TLC, this property can be transformed into a lucrative asset. Seize the chance to enhance your investment portfolio with this gem!
ⓘ Source: listings_history table (triggers on properties + properties_extension) + one-shot
backfill from property_details.listing_events for pre-trigger history.
Tax reassessment forecast IN · Partial reset (capped growth)
- Current annual tax
- $538 · $45/mo
- Projected year-2 tax
- $800 · $67/mo
- Expected delta
- +$262/yr (+$22/mo · 48.8%)
ⓘ Screening estimate from a state-policy table — verify with the county assessor before closing.
Climate risk First Street
- Flood 3/10 Moderate FEMA zone X (unshaded) · 20% chance over 30 yrs
- Wildfire 1/10 Low
- Heat 5/10 Major 7 d/yr ≥106°F today · 19 d/yr by 30 yrs out
- Wind 2/10 Low 3% chance of damaging wind over 30 yrs
- Air quality 3/10 Moderate 3 unhealthy d/yr today · 4 by 30 yrs out
Nearby sold comps map
Loading sold comps map…
Walkable amenities ~0.75 mi
Loading nearby amenities…
Taxation est. · year 1
- Rental income
- $12,295
- − Mortgage interest
- −$7,002
- − Property taxes
- −$538
- − Insurance
- −$625
- − Repairs & maintenance
- −$984
- − Management
- −$984
- − Depreciation
- −$3,636
- Taxable loss
- −$1,474
- Est. tax savings @ 24.0%
- +$354
- After-tax cash flow
- $1,038/yr
For passive investors: Depreciation is non-cash, so a rental often shows a tax loss while cash-flowing — sheltering income. Rental losses are passive: they offset passive income freely, and up to $25,000/yr can offset ordinary (W-2) income if you actively participate and your MAGI is under $100k (phasing out to $0 by $150k); unused losses carry forward. On sale, claimed depreciation is recaptured at up to 25%, and gains may owe capital-gains tax (a 1031 exchange can defer both). Figures are a year-1 estimate at your 24.0% rate — not tax advice; consult a CPA.
Schools (NCES district)
- District
- Evansville Vanderburgh School Corporation
- NCES district ID
- 1803450
- Math proficiency
- 36% ▼ -7.00%
- Reading proficiency
- 43% ▼ -3.00%
- Median HH income
- $43,270
- Composite
- 33.41/100
- National rank
- #5471
- State rank
- #153 of 301 in IN
Livability — Evansville
- Score
- 63/100
- State rank
- #416
- US rank
- #15047
Category grades
Schools grade is shown separately in the Schools card above.
Census & demographics
- Census place
- Evansville, IN
- County
- Clark County · 108,879 people
- City population
- 146,793
- Metro
- Louisville/Jefferson County, KY-IN
- Population (ZIP)
- 17,738
- Household income
- $95,376
- Rent vs Own
- Severe rent burden
- 151.0
Population outlook (Vanderburgh County) Hauer SSP2
- Today (2025)
- 187,038 people
- By 2030
- 188,907 · +1.0%
- By 2040
- 190,272 · +1.7%
- By 2050
- 188,871 · +1.0%
- By 2075
- 180,751 · -3.4%
- By 2100
- 163,015 · -12.8%
Race, ethnicity, and origin ACS 2023
- Neighborhood character
- Predominantly White (87%)
- Race & ethnicity
- White 87% Two or more races 5% Hispanic / Latino 4% Black 3%
- Common ancestry
- Italian 2% Lithuanian 2% Romanian 2%
- Foreign-born
- 3% · Canada, China
- Languages at home
- 95% English-only · Spanish 3% Chinese 1%
Political lean MEDSL · Vanderburgh
- 2024 margin
- R (+12.7) · D 43.0% · R 55.6% · Other 1.4%
- 2008→2024 swing
- -15.1pp toward R · 2008: 2.5pp · 2024: -12.7pp
- All cycles
- 2024: R+12.7 2020: R+9.6 2016: R+16.9 2012: R+10.8 2008: D+2.5
Not yet ingested
- Civics
- —
Market trends
- HPI YoY
- ▼ -126.16%
- Current HPI
- 198.7046
- Rent YoY
- —
- Metro
- Louisville/Jefferson County, KY-IN
- State GDP YoY
- ▲ 2.90%
- F500 in state
- 18
Industry mix (Fortune 500 HQ in IN)
| Industry | F500 HQs | Revenue |
|---|---|---|
| Industrial Machinery | 2 | $37B |
|
||
| Healthcare | 1 | $177B |
|
||
| Pharmaceuticals | 1 | $45B |
|
||
| Metals / Steel | 1 | $18B |
|
||
| Agriculture | 1 | $17B |
|
||
| Packaging | 1 | $12B |
|
||
Price history
+117.0% since first listed11 events — show timeline
- 2026-04-20 Price Changed $130,000 IRMLS
- 2026-03-21 Price Changed $134,000 IRMLS
- 2026-03-07 Price Changed $139,000 IRMLS
- 2026-03-02 Price Changed $144,000 IRMLS
- 2026-02-16 Price Changed $149,000 IRMLS
- 2026-01-24 Price Changed $154,000 IRMLS
- 2026-01-07 Listed $164,000 IRMLS
- 2024-11-04 Sold (MLS) $50,000 IRMLS
- 2024-10-04 Pending — IRMLS
- 2024-09-13 Price Changed $55,000 IRMLS
- 2024-07-31 Listed $59,900 IRMLS
Property tax history
+2.2%/yrLatest (2024): $538 · +3.6% YoY. Source: county tax records.
Cash-flow waterfall
monthlySold comps — $/sqft
last 12 mo · ≤1 miLoading sold comps…