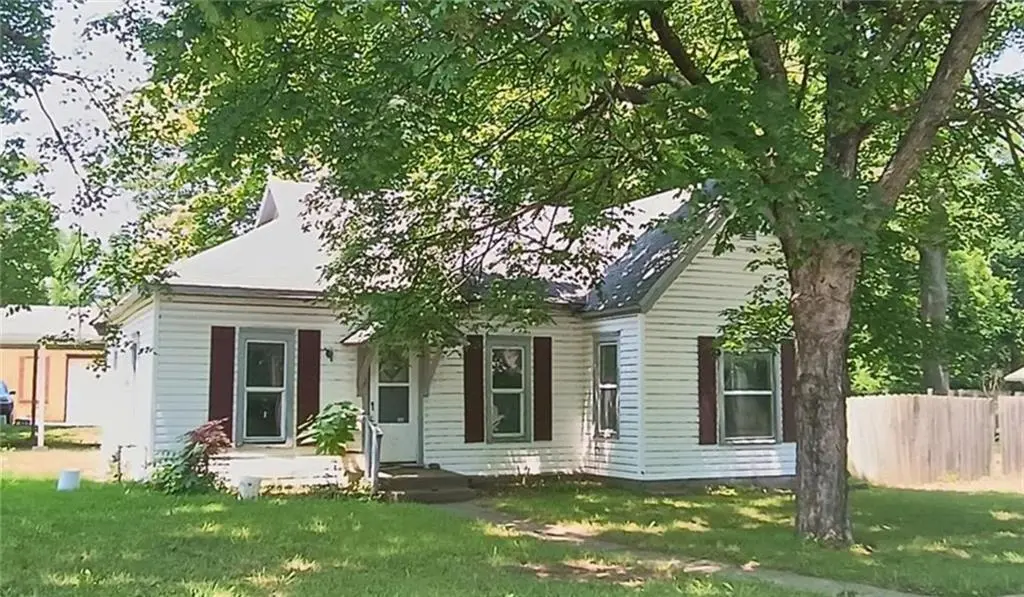
1301 N Washington St · Nevada, MO
Flood risk 1/10 · Minimal
- FEMA flood zone
- X (unshaded)
- Chance of flooding over 30 yrs
- 0.0%
- Est. flood insurance / yr
- $507 – $1,088
Fire risk 3/10 · Minor
- Est. fire insurance / yr
- $1,054 – $1,958
Heat risk 5/10 · Moderate
- Hot days now (above 108°F)
- 7 days/yr
- Hot days in 30 yrs
- 19 days/yr
Wind risk 2/10 · Minimal
- Chance of severe wind over 30 yrs
- 2.0%
Air-quality risk 2/10 · Minimal
- Unhealthy air days now
- 0 days/yr
- Unhealthy air days in 30 yrs
- 1 days/yr
Risk factors via First Street. Map © Google.
Why this score? — see what drove the D grade
The composite is a weighted blend of 9 inputs, each scored 0–100. Each bar is that input's sub-score; the figure is the points it added to the 100-point composite (weight × sub-score).
- Cash flow +15.0/30.0
- ARV discount +7.5/15.0
- 1% rule +5.0/10.0
- DSCR +5.0/10.0
- Schools +3.2/10.0
- Livability +3.0/5.0
- Rent growth +2.5/5.0
- Condition / age +2.5/5.0
- Appreciation +0.0/10.0
$1
🖨 Deal sheet 📄 Offer letter ✓ Due diligence
Key facts
- Detached building
- Corner lot
- 0.27 acre lot
Tags
Property features AI
Finance
- Other: Property is in a flood plain
- HOA & community: No association fees
Exterior
- Parking: Carport; Garage(s) on property
- Utilities: Public water; Public sewer
- Home design: Single-family residence; Residential property; One-story bungalow (age 101+ years)
- Construction: Frame construction; Composition roof; Built over 101 years ago
- Exterior features: Fixer-up condition; Paved road access; Public road maintenance
Interior
- Bedrooms: 2 bedrooms
- Bathrooms: 1 full bathroom
- Heating & cooling: No heating; No cooling
- Interior features: Crawl space basement; Bungalow floor plan
Neighborhood map
What this means for you Summary
Snapshot
- This is a 2-bed/1.0-bath single-family listed at $1.
Deal economics
- At list price, monthly cash flow is $686 ($8k/yr) — positive.
- The deal already cash-flows at list — no discount required.
- Meets the 1% rule at list price ($869 rent vs $1).
- Cap rate 823345.5% vs local median 4.9% in Nevada — top-decile yield for the area; either an underpriced asset or a hidden risk that comps aren't pricing in. Stress-test before assuming the spread holds.
Location & tenants
- Location reads 59/100 on livability (#519 in MO) — a working-class tenant base; expect higher turnover. Strengths: cost of living A+, housing A; Watch: schools C-, crime F, amenities F.
- Nevada R-V (town): math 33% / reading 44% proficiency, ranked #180 of 324 in MO (top 56%) — families likely to look elsewhere, expect single-tenant / working-renter base with shorter leases.
- Market conditions: 104 active listings in the ZIP; 2 comparable units currently listed for rent nearby; 57 units permitted in Vernon County in 2024 (38 in 5+ unit buildings).
Forward outlook
- Local home prices are declining (-3.0%/yr); year-one equity from $0 of loan paydown is wiped out by about $0 of value loss. Plan a longer hold.
- Vernon County population projected at -13% by 2050 — secular population decline; favor cash flow + early exit over multi-decade hold.
- At projected returns (-3.0% appreciation + 3.0% rent growth), your $0 cash investment doubles in ~1 year — after that, you're playing with house money.
Negotiation context
- Only 13 days on market — expect competitive offers; lowballing is unlikely to land.
- 2 sale attempts with the ask held roughly flat each time — persistent listings suggest the price (not the market) is what's stuck; bring a comps-based counter.
Risks & watch-outs
- Watch-outs: built in 1880 — expect roof / HVAC / electrical / plumbing capex.
- Climate carrying-cost: extreme-heat days projected 7→19/yr by 2055 (HVAC capex compounding) — expect insurance premiums to compound above CPI over the hold.
Questions for the listing agent
- Built in 1880 — when were the roof, HVAC, electrical panel, plumbing, and water heater last replaced?
- Is there a deadline driving the sale (1031 exchange, divorce, estate, relocation)? That informs how much negotiation room exists.
- Crime grade is F in this area — have there been break-ins, vandalism, or insurance claims at this property in the last 3 years? What carrier currently insures it and at what premium?
- The area grade is low — what's the realistic commute time and amenity access for the typical tenant pool here? Any planned neighborhood developments (good or bad) we should know about?
- What's the average days-on-market for RENTAL listings here right now (not sales)? A rising rental-DOM trend means longer vacancies and softer asking-rent achievability than the comps imply.
- What's the recent tenant-quality profile in this submarket — average credit score on applications, eviction rate, late-payment / NSF rate, and stable-employment percentage? A property-management company in the area should have these aggregated.
- How much new for-sale + rental construction is in the pipeline within 1–3 miles? Heavy new supply typically softens prices + rents 12–24 months out; constrained supply supports both.
Investment metrics
- 1% rule
- 86851.00% ✓
- Cap rate
- 823345.48%
- Cash-on-cash
- 2940497.10%
- DSCR
- 130836.57
- GRM
- 0.0
CMA / ARV
- ARV (on-the-fly)
- $126,492
- Comps found
- 12
Show comp detail 12 sales within ~0.75 mi
| Address | Dist | Beds/Ba | Sqft | Sold | Price | $/sf | Match |
|---|---|---|---|---|---|---|---|
| 1239 N Main St | 0.17mi | 2/1.0 | 996 (0%) | 5mo | $107,900 | $108 | 88 |
| 1128 N Clay St | 0.34mi | 2/1.0 | 1,020 (+2%) | 5mo | $129,900 | $127 | 76 |
| 1109 N Adams St | 0.33mi | 3/1.0 (+1) | 1,038 (+4%) | 7mo | $65,000 | $63 | 67 |
| 717 N Adams St | 0.50mi | 2/1.0 | 936 (-6%) | 3mo | $119,000 | $127 | 64 |
| 718 N Main St | 0.43mi | 2/1.0 | 1,098 (+10%) | 1mo | $105,000 | $96 | 62 |
| 922 N Main St | 0.31mi | 3/2.0 (+1) | 1,056 (+6%) | 6mo | $169,900 | $161 | 61 |
| 835 N Clay St | 0.46mi | 2/2.0 | 908 (-9%) | 4mo | $125,000 | $138 | 57 |
| 1833 N Cedar St | 0.46mi | 2/1.0 | 872 (-12%) | 4mo | $135,000 | $155 | 55 |
| 719 N Main St | 0.42mi | 3/1.0 (+1) | 1,090 (+9%) | 6mo | $100,000 | $92 | 54 |
| 511 & 515 N Ash St | 0.58mi | 2/0.5 | 1,066 (+7%) | 7mo | $135,000 | $127 | 53 |
| 611 N Clay St | 0.61mi | 2/1.0 | 1,090 (+9%) | 7mo | $72,900 | $67 | 50 |
| 312 E Lee St | 0.54mi | 3/2.0 (+1) | 1,096 (+10%) | 6mo | $155,000 | $141 | 44 |
Match score weights: distance 35% · size 25% · config 20% · recency 20%. Top-matched comps best support the ARV.
Projected returns pro-forma
-3.0% appreciation · 3.0% rent growth · sell at horizon
- IRR
- —
- Equity multiple
- 156115.41×
- Total profit
- $43,712
- Equity at exit
- $0
- IRR
- —
- Equity multiple
- 337095.54×
- Total profit
- $94,386
- Equity at exit
- $0
Cash invested: $0 (down + closing). Projections, not guarantees.
Landlord ↔ Tenant lean methodology
- Overall (STATE)
- 81 Strongly Landlord-Friendly
- State Missouri
- 81 Strongly Landlord-Friendly · R+10
- County
- — inherits STATE
- City
- — inherits STATE
ZIP-level market 64772
- Active inventory
- 104
Monthly cashflow live
- Estimated rent
- $869 medium interval (Pro) →
- Mortgage (P&I)
- −$0
- Tax est. 1.5%
- −$0 /mo · $0/yr
- Insurance
- −$0
- HOA
- −$0
- Vacancy / Maint / Mgmt
- −$182
- Net cashflow
- $686
Break-even live
UW: 25.0% down · 7.5% · 30yr · 1.5% tax · 5.0% vac · 8.0% maint · 8.0% mgmt
Financing live
Cash to close
- Down payment
- $0
- Closing costs
- $0
- Reserves months
- —
- Total cash needed
- —
Loan-product check · same deal, 3 products live
Conventional
25% down · 7.5% · 30yr
- Down + closing
- —
- Monthly P&I
- —
- Monthly cashflow
- —
- DSCR
- —
- Eligible?
- —
Personal DTI + credit; lowest rate.
DSCR
20% down · 8.5% · 30yr
- Down + closing
- —
- Monthly P&I
- —
- Monthly cashflow
- —
- DSCR
- —
- Eligible?
- —
No personal income docs; deal must DSCR.
Hard money
10% down · 12.0% · 12mo
- Down + closing
- —
- Monthly P&I
- —
- Monthly cashflow
- —
- DSCR
- —
- Eligible?
- —
Short-term bridge; refi at stabilization.
Rent comps 2 comps
| Address | Beds | Baths | Sqft | Rent | $/sqft | DOM | Units | Dist |
|---|---|---|---|---|---|---|---|---|
| 404 E Ashland St Nevada, MO | 2.0 | 1.0 | 1041 | $875 | $0.84 | 43d | 1 | 0.48mi |
| 926 W Sycamore St Nevada, MO | 3.0 | 1.0 | 1100 | $850 | $0.77 | 43d | 1 | 1.30mi |
Listing history 10 events
-
2026-06-18days on market $1 Active 13 DOM
-
2026-06-17days on market $1 Active 12 DOM
-
2026-06-16days on market $1 Active 11 DOM
-
2026-06-15days on market $1 Active 10 DOM
-
2026-06-13days on market $1 Active 8 DOM
-
2026-06-12days on market $1 Active 7 DOM
-
2026-06-09days on market $1 Active 4 DOM
-
2026-06-08days on market $1 Active 3 DOM
-
2026-06-07days on market $1 Active 2 DOM
-
2026-06-07$1 Active 1 DOM
ⓘ Source: listings_history table (triggers on properties + properties_extension) + one-shot
backfill from property_details.listing_events for pre-trigger history.
Climate risk First Street
- Flood 1/10 Low FEMA zone X (unshaded) · 0% chance over 30 yrs
- Wildfire 3/10 Moderate
- Heat 5/10 Major 7 d/yr ≥108°F today · 19 d/yr by 30 yrs out
- Wind 2/10 Low 2% chance of damaging wind over 30 yrs
- Air quality 2/10 Low 0 unhealthy d/yr today · 1 by 30 yrs out
Nearby sold comps map
Loading sold comps map…
Walkable amenities ~0.75 mi
Loading nearby amenities…
Taxation est. · year 1
- Rental income
- $10,422
- − Mortgage interest
- −$0
- − Property taxes
- −$0
- − Insurance
- −$0
- − Repairs & maintenance
- −$834
- − Management
- −$834
- − Depreciation
- −$0
- Taxable income
- $8,754
- Est. tax owed @ 24.0%
- −$2,101
- After-tax cash flow
- $6,132/yr
For passive investors: Depreciation is non-cash, so a rental often shows a tax loss while cash-flowing — sheltering income. Rental losses are passive: they offset passive income freely, and up to $25,000/yr can offset ordinary (W-2) income if you actively participate and your MAGI is under $100k (phasing out to $0 by $150k); unused losses carry forward. On sale, claimed depreciation is recaptured at up to 25%, and gains may owe capital-gains tax (a 1031 exchange can defer both). Figures are a year-1 estimate at your 24.0% rate — not tax advice; consult a CPA.
Schools (NCES district)
- District
- Nevada R-V
- NCES district ID
- 2921840
- Math proficiency
- 33% ▼ -1.00%
- Reading proficiency
- 44% ▼ -1.00%
- Median HH income
- $38,804
- Composite
- 32.14/100
- National rank
- #5792
- State rank
- #180 of 324 in MO
Livability — Nevada
- Score
- 59/100
- State rank
- #519
- US rank
- #19644
Category grades
Schools grade is shown separately in the Schools card above.
Census & demographics
- Census place
- Nevada, MO
- Population (ZIP)
- 12,930
Population outlook (Vernon County) Hauer SSP2
- Today (2025)
- 20,169 people
- By 2030
- 19,639 · -2.6%
- By 2040
- 18,551 · -8.0%
- By 2050
- 17,549 · -13.0%
- By 2075
- 15,314 · -24.1%
- By 2100
- 13,132 · -34.9%
Race, ethnicity, and origin ACS 2023
- Neighborhood character
- Predominantly White (92%)
- Race & ethnicity
- White 92% Two or more races 4% Hispanic / Latino 3% Black 1% Asian 1%
- Common ancestry
- Italian 3% Portuguese 2% Romanian 2%
- Foreign-born
- 1%
- Languages at home
- 98% English-only · German/W. Germanic 1%
Political lean MEDSL · Vernon
- 2024 margin
- Solid R (+59.5) · D 19.8% · R 79.3%
- 2008→2024 swing
- -37.5pp toward R · 2008: -22.0pp · 2024: -59.5pp
- All cycles
- 2024: R+59.5 2020: R+57.2 2016: R+56.2 2012: R+37.3 2008: R+22.0
Not yet ingested
- Civics
- —
Market trends
- HPI YoY
- ▼ -84.21%
- Current HPI
- 150.7283
- Rent YoY
- —
- Metro
- —
- State GDP YoY
- ▲ 1.84%
- F500 in state
- 20
Industry mix (Fortune 500 HQ in MO)
| Industry | F500 HQs | Revenue |
|---|---|---|
| Healthcare | 1 | $163B |
|
||
| Insurance | 1 | $21B |
|
||
| Industrial Technology | 1 | $17B |
|
||
| Retail | 1 | $16B |
|
||
| Industrial Distribution | 1 | $10B |
|
||
| Utilities | 1 | $9B |
|
||
Price history
5 events — show timeline
- 2026-06-05 Listed $1 Heartland MLS as Distributed by MLS Grid
- 2025-06-30 Listing Removed — Heartland MLS as Distributed by MLS Grid
- 2025-06-09 Listed $1 Heartland MLS as Distributed by MLS Grid
- 2023-09-26 Sold (Public Records) $4,000 Public Records
- 2005-04-08 Sold (Public Records) — Public Records
Property tax history
+1.5%/yrLatest (2025): $402 · +12.0% YoY. Source: county tax records.
Cash-flow waterfall
monthlySold comps — $/sqft
last 12 mo · ≤1 miLoading sold comps…