 🌊 Lakefront
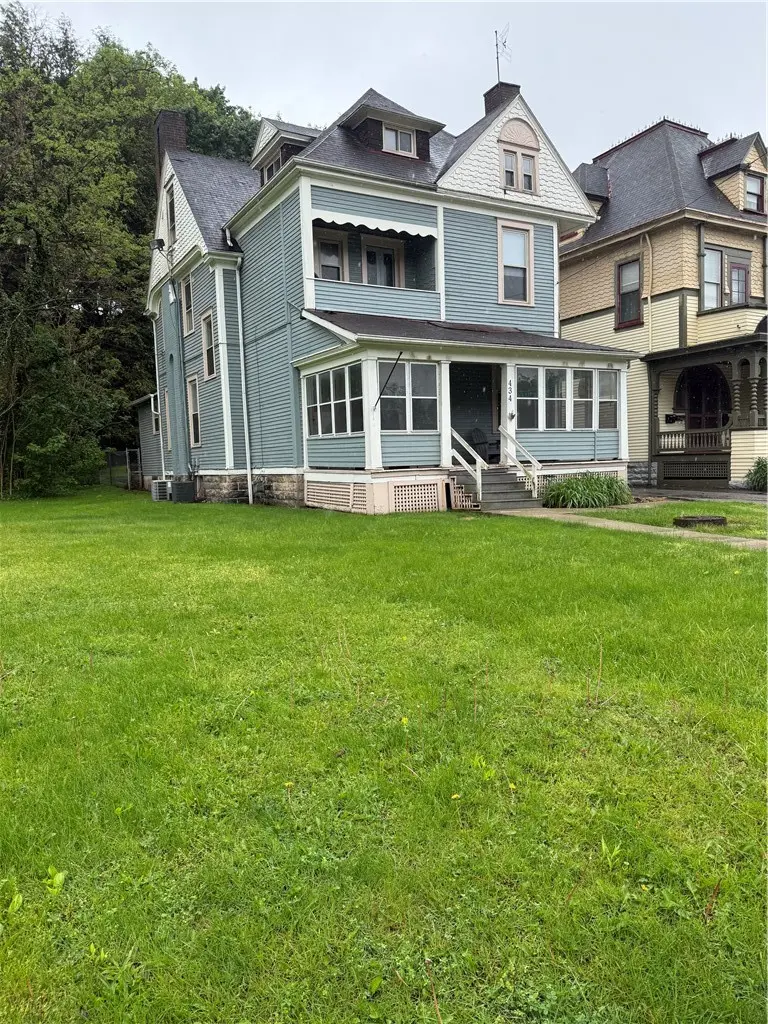
434 N Croton Ave · New Castle, PA
Flood risk 6/10 · Moderate
- FEMA flood zone
- AE
- Chance of flooding over 30 yrs
- 0.75%
- Est. flood insurance / yr
- $1,737 – $8,500
Fire risk 1/10 · Minimal
- Est. fire insurance / yr
- $511 – $949
Heat risk 3/10 · Minor
- Hot days now (above 96°F)
- 7 days/yr
- Hot days in 30 yrs
- 17 days/yr
Wind risk 1/10 · Minimal
- Chance of severe wind over 30 yrs
- —
Air-quality risk 2/10 · Minimal
- Unhealthy air days now
- 1 days/yr
- Unhealthy air days in 30 yrs
- 3 days/yr
Risk factors via First Street. Map © Google.
Why this score? — see what drove the B- grade
The composite is a weighted blend of 9 inputs, each scored 0–100. Each bar is that input's sub-score; the figure is the points it added to the 100-point composite (weight × sub-score).
- Cash flow +30.0/30.0
- 1% rule +10.0/10.0
- DSCR +10.0/10.0
- ARV discount +7.5/15.0
- Rent growth +5.0/5.0
- Livability +4.1/5.0
- Condition / age +2.2/5.0
- Schools +1.1/10.0
- Appreciation +0.0/10.0
$100,000
🖨 Deal sheet 📄 Offer letter ✓ Due diligence
Listing remarks
Large family home with 6 total bedrooms and two and a half bathrooms. New boiler, thermopane windows.
Key facts
- 6,098 sq ft lot
- Garage
- Built 1925
Property features AI
Exterior
- Parking: Detached garage; 2 parking spaces (total)
- Utilities: Public water; Public sewer
- Home design: 3-story frame home; Resale property
- Construction: Frame construction; Asphalt roof
- Exterior features: Public transportation nearby; Lot dimensions approximately 39.5 x 150
Interior
- Kitchen: Dishwasher; Microwave; Refrigerator
- Flooring: Carpet; Vinyl
- Bathrooms: 2 full bathrooms; 1 half bathroom
- Heating & cooling: Gas hot water heating; Central air conditioning
- Interior features: Unfinished walk-up basement
Neighborhood map
What this means for you Summary
Snapshot
- This is a 6-bed/2.5-bath single-family listed at $100k. Condition is rated fair.
Deal economics
- At list price, monthly cash flow is $177 ($2k/yr) — positive.
- The deal already cash-flows at list — no discount required.
- Meets the 1% rule at list price ($2k rent vs $100k).
- Recommended offer: $98k (1.5% below list) — sets the bar for market timing.
- Cap rate 13.5% vs local median 8.7% in New Castle — top-decile yield for the area; either an underpriced asset or a hidden risk that comps aren't pricing in. Stress-test before assuming the spread holds.
Location & tenants
- Location reads 82/100 on livability (#137 in PA, #1,120 nationally) — a professional / high-income tenant draw. Strengths: crime A+, commute A+, cost of living A+; Watch: amenities F, employment F.
- New Castle Area SD (town): math 9% / reading 19% proficiency, ranked #519 of 539 in PA (top 96%) — low school quality limits family demand, transient renter base, plan for 1-2y turnover; 66% free/reduced lunch — lower-income household profile, screen leases tightly.
- Market conditions: Rents rising fast (+20.1%/yr); 118 active listings in the ZIP; 51 units permitted in Lawrence County in 2024 (0 in 5+ unit buildings).
- This rent runs 38% of the median local income ($51k/yr) — at the standard rent-burdened threshold; future hikes will face affordability resistance.
Forward outlook
- Local home prices are declining (-3.0%/yr); year-one equity from $691 of loan paydown is wiped out by about $3k of value loss. Plan a longer hold.
- Lawrence County population projected at -25% by 2050 — secular population decline; favor cash flow + early exit over multi-decade hold.
- At projected returns (-3.0% appreciation + 8.0% rent growth), your $28k cash investment doubles in ~8 years — after that, you're playing with house money.
Negotiation context
- It's been on market 25 days — a 2% lower offer ($98k) is reasonable based on typical stale-listing flexibility.
Risks & watch-outs
- Watch-outs: flood insurance adds $427/mo; built in 1925 — expect roof / HVAC / electrical / plumbing capex.
- Climate carrying-cost: in FEMA flood zone AE (mandatory federal flood insurance) — expect insurance premiums to compound above CPI over the hold.
Questions for the listing agent
- Have any recent inspections been done? Can we get a copy of the seller's disclosures and any deferred-maintenance estimates?
- Built in 1925 — when were the roof, HVAC, electrical panel, plumbing, and water heater last replaced?
- What's the actual annual flood-insurance premium (NFIP or private), and is the property in a SFHA with mandatory coverage?
- Is there a deadline driving the sale (1031 exchange, divorce, estate, relocation)? That informs how much negotiation room exists.
- This sits on a lake — are riparian / water-frontage rights deeded with the parcel? Any dock permits, shoreline easements, or HOA water-use restrictions?
- What's the documented flood / surge / shoreline-erosion history here (FEMA AND non-FEMA — e.g., storm surge, creek backup, septic-field saturation)?
- Any water-quality or seasonal algae-bloom issues that affect tenant satisfaction or short-term-rental demand?
- What's the average days-on-market for RENTAL listings here right now (not sales)? A rising rental-DOM trend means longer vacancies and softer asking-rent achievability than the comps imply.
- What's the recent tenant-quality profile in this submarket — average credit score on applications, eviction rate, late-payment / NSF rate, and stable-employment percentage? A property-management company in the area should have these aggregated.
- How much new for-sale + rental construction is in the pipeline within 1–3 miles? Heavy new supply typically softens prices + rents 12–24 months out; constrained supply supports both.
Investment metrics
- 1% rule
- 1.64% ✓
- Cap rate
- 13.54%
- Cash-on-cash
- 25.88%
- DSCR
- 2.15
- GRM
- 5.1
CMA / ARV
- ARV (on-the-fly)
- $224,067
- Comps found
- 1
Show comp detail 1 sale within ~0.75 mi
| Address | Dist | Beds/Ba | Sqft | Sold | Price | $/sf | Match |
|---|---|---|---|---|---|---|---|
| 332 E Lincoln Ave | 0.34mi | 6/4.5 | 3,854 (-2%) | 2mo | $219,900 | $57 | 71 |
Match score weights: distance 35% · size 25% · config 20% · recency 20%. Top-matched comps best support the ARV.
Projected returns pro-forma
-3.0% appreciation · 8.0% rent growth · sell at horizon
- IRR
- 3.5%
- Equity multiple
- 1.14×
- Total profit
- $4,037
- Equity at exit
- $14,910
- IRR
- 18.8%
- Equity multiple
- 3.09×
- Total profit
- $58,648
- Equity at exit
- $8,646
Cash invested: $28,000 (down + closing). Projections, not guarantees.
Landlord ↔ Tenant lean methodology
- Overall (STATE)
- 62 Landlord-Friendly
- State Pennsylvania
- 62 Landlord-Friendly · EVEN
- County
- — inherits STATE
- City
- — inherits STATE
ZIP-level market 16101
- Home prices YoY
- -26.3%
- Rents YoY
- 20.1%
- Active inventory
- 118
- Price-to-rent
- 5.1×
Monthly cashflow live
- Estimated rent
- $1,639 medium interval (Pro) →
- Mortgage (P&I)
- −$524
- Tax est. 1.5%
- −$125 /mo · $1,500/yr
- Insurance
- −$42
- Flood insurance flood zone
- −$427 /mo · $5,118/yr
- HOA
- −$0
- Vacancy / Maint / Mgmt
- −$344
- Net cashflow
- $177
Break-even live
UW: 25.0% down · 7.5% · 30yr · 1.5% tax · 5.0% vac · 8.0% maint · 8.0% mgmt
Financing live
Cash to close
- Down payment
- $25,000
- Closing costs
- $3,000
- Reserves months
- —
- Total cash needed
- —
Loan-product check · same deal, 3 products live
Conventional
25% down · 7.5% · 30yr
- Down + closing
- —
- Monthly P&I
- —
- Monthly cashflow
- —
- DSCR
- —
- Eligible?
- —
Personal DTI + credit; lowest rate.
DSCR
20% down · 8.5% · 30yr
- Down + closing
- —
- Monthly P&I
- —
- Monthly cashflow
- —
- DSCR
- —
- Eligible?
- —
No personal income docs; deal must DSCR.
Hard money
10% down · 12.0% · 12mo
- Down + closing
- —
- Monthly P&I
- —
- Monthly cashflow
- —
- DSCR
- —
- Eligible?
- —
Short-term bridge; refi at stabilization.
Listing history 15 events
-
2026-06-19days on market $100,000 Active 25 DOM
-
2026-06-18days on market $100,000 Active 24 DOM
-
2026-06-17days on market $100,000 Active 23 DOM
-
2026-06-16days on market $100,000 Active 22 DOM
-
2026-06-15days on market $100,000 Active 21 DOM
-
2026-06-14days on market $100,000 Active 19 DOM
-
2026-06-12days on market $100,000 Active 18 DOM
-
2026-06-09days on market $100,000 Active 15 DOM
-
2026-06-09days on market $100,000 Active 14 DOM
-
2026-06-03days on market $100,000 Active 12 DOM
-
2026-06-02days on market $100,000 Active 11 DOM
-
2026-06-01days on market $100,000 Active 10 DOM
-
2026-05-31days on market $100,000 Active 9 DOM
-
2026-05-30days on market $100,000 Active 8 DOM
-
2026-05-22$100,000 Active
ⓘ Source: listings_history table (triggers on properties + properties_extension) + one-shot
backfill from property_details.listing_events for pre-trigger history.
Climate risk First Street
- Flood 6/10 Major FEMA zone AE · 75% chance over 30 yrs
- Wildfire 1/10 Low
- Heat 3/10 Moderate 7 d/yr ≥96°F today · 17 d/yr by 30 yrs out
- Wind 1/10 Low
- Air quality 2/10 Low 1 unhealthy d/yr today · 3 by 30 yrs out
Nearby sold comps map
Loading sold comps map…
Walkable amenities ~0.75 mi
Loading nearby amenities…
Taxation est. · year 1
- Rental income
- $19,670
- − Mortgage interest
- −$5,602
- − Property taxes
- −$1,500
- − Insurance
- −$5,618
- − Repairs & maintenance
- −$1,574
- − Management
- −$1,574
- − Depreciation
- −$2,909
- Taxable income
- $893
- Est. tax owed @ 24.0%
- −$214
- After-tax cash flow
- $1,913/yr
For passive investors: Depreciation is non-cash, so a rental often shows a tax loss while cash-flowing — sheltering income. Rental losses are passive: they offset passive income freely, and up to $25,000/yr can offset ordinary (W-2) income if you actively participate and your MAGI is under $100k (phasing out to $0 by $150k); unused losses carry forward. On sale, claimed depreciation is recaptured at up to 25%, and gains may owe capital-gains tax (a 1031 exchange can defer both). Figures are a year-1 estimate at your 24.0% rate — not tax advice; consult a CPA.
Condition & rehab AI · 2 photos
A moderate rehab project is needed to address roof and exterior issues, with updates to paint and landscaping to boost value.
Repairs flagged
- Major roof — Moss growth suggests potential water damage
- Minor exterior siding — Some minor wear visible
Value-add opportunities
- Both paint exterior — Fresh paint enhances curb appeal and value
- Both repair roof — Fixing leaks improves home's condition and value
- Both landscaping — Well-maintained landscaping increases curb appeal and value
Renovation cost estimate screening
| Repair item | Severity | Est. cost |
|---|---|---|
| roof · Moss growth suggests potential water damage | Major | $15,000–50,000 |
| exterior siding · Some minor wear visible | Minor | $500–3,000 |
| Total estimated repair cost · 2 items | $15,500–53,000 |
Value-add ROI direction
- Both paint exterior — Fresh paint enhances curb appeal and value ↑
- Both repair roof — Fixing leaks improves home's condition and value ↑
- Both landscaping — Well-maintained landscaping increases curb appeal and value ↑
ⓘ Cost ranges are severity-bucket heuristics (US national rule-of-thumb). Get contractor quotes + a written scope before underwriting a rehab budget.
Schools (NCES district)
- District
- New Castle Area SD
- NCES district ID
- 4216620
- Math proficiency
- 9% ▼ -13.00%
- Reading proficiency
- 19% ▼ -23.00%
- Median HH income
- $30,967
- Composite
- 11.08/100
- National rank
- #9736
- State rank
- #519 of 539 in PA
Livability — New Castle
- Score
- 82/100
- State rank
- #137
- US rank
- #1120
Category grades
Schools grade is shown separately in the Schools card above.
Census & demographics
- Census place
- New Castle, PA
- County
- Lawrence County · 30,767 people
- City population
- 30,767
- Metro
- New Castle, PA
- Population (ZIP)
- 30,767
- Household income
- $51,128
- Rent vs Own
- Severe rent burden
- 1047.0
Population outlook (Lawrence County) Hauer SSP2
- Today (2025)
- 81,781 people
- By 2030
- 77,978 · -4.7%
- By 2040
- 69,522 · -15.0%
- By 2050
- 61,344 · -25.0%
- By 2075
- 45,027 · -44.9%
- By 2100
- 31,305 · -61.7%
Race, ethnicity, and origin ACS 2023
- Neighborhood character
- Predominantly White (82%)
- Race & ethnicity
- White 82% Two or more races 8% Black 7% Hispanic / Latino 3%
- Common ancestry
- Romanian 7% Serbian 3% Iranian 1%
- Foreign-born
- 2% · Canada
- Languages at home
- 96% English-only · Spanish 2% Other Indo-European 1%
Political lean MEDSL · Lawrence
- 2024 margin
- Solid R (+33.8) · D 32.8% · R 66.5%
- 2008→2024 swing
- -28.7pp toward R · 2008: -5.1pp · 2024: -33.8pp
- All cycles
- 2024: R+33.8 2020: R+29.6 2016: R+28.1 2012: R+9.0 2008: R+5.1
Not yet ingested
- Civics
- —
Market trends
- HPI YoY
- ▼ -56.77%
- Current HPI
- 159.3091
- Rent YoY
- ▲ 20.05%
- Metro
- New Castle, PA
- State GDP YoY
- ▲ 1.68%
- F500 in state
- 34
Industry mix (Fortune 500 HQ in PA)
| Industry | F500 HQs | Revenue |
|---|---|---|
| Healthcare | 2 | $309B |
|
||
| Insurance | 2 | $27B |
|
||
| Telecommunications / Media | 1 | $124B |
|
||
| Industrial Distribution | 1 | $22B |
|
||
| Financial Services | 1 | $20B |
|
||
| Chemicals / Materials | 1 | $18B |
|
||
Price history
1 event — show timeline
- 2026-05-22 Listed $100,000 West Penn MLS
Cash-flow waterfall
monthlySold comps — $/sqft
last 12 mo · ≤1 miLoading sold comps…