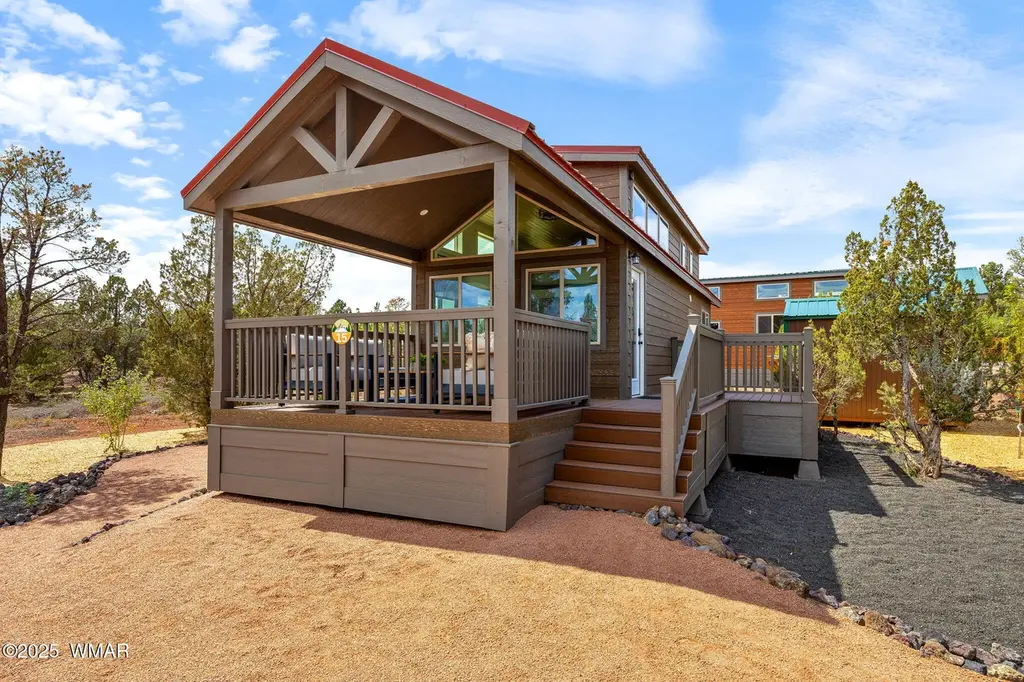
2746 Columbia Ln #5 · Heber-Overgaard, AZ
Flood risk 1/10 · Minimal
- FEMA flood zone
- X (unshaded)
- Chance of flooding over 30 yrs
- 0.0%
- Est. flood insurance / yr
- $507 – $1,088
Fire risk 7/10 · Major
- Est. fire insurance / yr
- $610 – $1,132
Heat risk 2/10 · Minimal
- Hot days now (above 87°F)
- 7 days/yr
- Hot days in 30 yrs
- 18 days/yr
Wind risk 1/10 · Minimal
- Chance of severe wind over 30 yrs
- —
Air-quality risk 1/10 · Minimal
- Unhealthy air days now
- 0 days/yr
- Unhealthy air days in 30 yrs
- 0 days/yr
Risk factors via First Street. Map © Google.
Why this score? — see what drove the D grade
The composite is a weighted blend of 9 inputs, each scored 0–100. Each bar is that input's sub-score; the figure is the points it added to the 100-point composite (weight × sub-score).
- Cash flow +16.4/30.0
- DSCR +5.1/10.0
- Condition / age +4.8/5.0
- 1% rule +4.5/10.0
- Schools +4.0/10.0
- ARV discount +2.9/15.0
- Rent growth +2.5/5.0
- Livability +2.5/5.0
- Appreciation +0.0/10.0
$140,000
🖨 Deal sheet (PDF) 📄 Offer letter ✓ Due diligence
Listing remarks MLS
Charming park model offering an affordable and low-maintenance way to enjoy your own place in the beautiful White Mountains! This cozy retreat is perfect as a weekend getaway, summer escape, seasonal residence, or STR with a comfortable layout and inviting cabin-style feel. Enjoy the simplicity of owning your own space without the cost and upkeep of traditional homeownership. Ideal for those looking for a lock-and-leave property. Please note: This is a park model home situated on a leased lot (no land ownership). Per park and zoning guidelines, the home is intended for seasonal/recreational use and not full-time residence. Park rules and lot rent apply. Pictures are of the model home.
Key facts
- Covered porch
- Ramadas
- Community splash pad
Tags
Neighborhood map
What this means for you Summary
Snapshot
- This is a 1-bed/1.0-bath single-family listed at $140k. Condition is rated excellent.
Deal economics
- At list price, monthly cash flow is $79 ($950/yr) — positive.
- The deal already cash-flows at list — no discount required.
- To meet the 1% rule (rent ≥ 1% of price), the offer needs to be $132k (5.4% below list).
- Recommended offer: $132k (6.0% below list) — sets the bar for market timing.
- Cap rate 7.0% vs local median 3.2% in Heber-Overgaard — top-decile yield for the area; either an underpriced asset or a hidden risk that comps aren't pricing in. Stress-test before assuming the spread holds.
Location & tenants
- Location reads: area grade D — affects rentability + tenant quality, not the cash-flow math above.
- Heber-Overgaard Unified District (4392) (rural): math 52% / reading 45% proficiency, ranked #51 of 249 in AZ (top 20%) — families likely to look elsewhere, expect single-tenant / working-renter base with shorter leases.
- Zoned schools: Mountain Meadows Primary (math 70% / reading 50%, grade B-, #148 of 1,109 statewide, top 15%, 143 students, 43% FRL); Mogollon Jr High School (math 42% / reading 32%, grade F, #57 of 218 statewide, top 27%, 77 students, 0% FRL); Mogollon High School (math 30% / reading 30%, grade F, #116 of 381 statewide, top 31%, 167 students, 32% FRL) — zoned schools average 25% FRL vs 50% district-wide (25 pts lower); this property's tenant base skews higher-income than the district average.
- Market conditions: 258 active listings in the ZIP; 485 units permitted in Navajo County in 2024 (11 in 5+ unit buildings).
Forward outlook
- Local home prices are declining (-3.0%/yr); year-one equity from $968 of loan paydown is wiped out by about $4k of value loss. Plan a longer hold.
- Navajo County population projected at -16% by 2050 — secular population decline; favor cash flow + early exit over multi-decade hold.
Negotiation context
- It's been on market 84 days — a 6% lower offer ($132k) is reasonable based on typical stale-listing flexibility.
Risks & watch-outs
- Climate carrying-cost: major wildfire risk — expect insurance premiums to compound above CPI over the hold.
Questions for the listing agent
- It's been on market 84 days. Have you received any prior offers? Is the seller open to a 6% concession, seller financing, or rate buy-down credit?
- Why hasn't it sold? Are there any deal-killer items the seller is aware of (foundation, flood, title, zoning, code violations)?
- Is there a deadline driving the sale (1031 exchange, divorce, estate, relocation)? That informs how much negotiation room exists.
- The area grade is low — what's the realistic commute time and amenity access for the typical tenant pool here? Any planned neighborhood developments (good or bad) we should know about?
- What's the average days-on-market for RENTAL listings here right now (not sales)? A rising rental-DOM trend means longer vacancies and softer asking-rent achievability than the comps imply.
- What's the recent tenant-quality profile in this submarket — average credit score on applications, eviction rate, late-payment / NSF rate, and stable-employment percentage? A property-management company in the area should have these aggregated.
- How much new for-sale + rental construction is in the pipeline within 1–3 miles? Heavy new supply typically softens prices + rents 12–24 months out; constrained supply supports both.
Investment metrics
- 1% rule
- 0.95% ✗
- Cap rate
- 6.97%
- Cash-on-cash
- 2.42%
- DSCR
- 1.11
- GRM
- 8.8
CMA / ARV
- ARV (median comp)
- $126,970
- List price
- $140,000
- Delta
- 10.26%
- Verdict
- OVERPRICED
- Comps
- 8 within 2.0 mi
Show comp detail 1 sale within ~0.75 mi
| Address | Dist | Beds/Ba | Sqft | Sold | Price | $/sf | Match |
|---|---|---|---|---|---|---|---|
| 2746 Columbia Ln #13 | 0.00mi | 1/1.0 | 400 (0%) | 10mo | $135,000 | $338 | 92 |
Match score weights: distance 35% · size 25% · config 20% · recency 20%. Top-matched comps best support the ARV.
Projected returns pro-forma
-3.0% appreciation · 3.0% rent growth · sell at horizon
- IRR
- -12.4%
- Equity multiple
- 0.55×
- Total profit
- $-17,622
- Equity at exit
- $20,874
- IRR
- -3.3%
- Equity multiple
- 0.78×
- Total profit
- $-8,769
- Equity at exit
- $12,105
Cash invested: $39,200 (down + closing). Projections, not guarantees.
Landlord ↔ Tenant lean methodology
- Overall (STATE)
- 87 Strongly Landlord-Friendly
- State Arizona
- 87 Strongly Landlord-Friendly · R+3
- County
- — inherits STATE
- City
- — inherits STATE
ZIP-level market 85933
- Home prices YoY
- -18.9%
- Active inventory
- 258
- Price-to-rent
- 8.8×
Monthly cashflow live
- Estimated rent
- $1,325 medium interval (Pro) →
- Mortgage (P&I)
- −$734
- Tax est. 1.5%
- −$175 /mo · $2,100/yr
- Insurance
- −$58
- HOA
- −$0
- Vacancy / Maint / Mgmt
- −$278
- Net cashflow
- $79
Break-even live
Sensitivity live
| Price | -10% $176 | -5% $128 | +0% $79 | +5% $31 | +10% $-18 |
|---|---|---|---|---|---|
| Rent | -10% $-25 | -5% $27 | +0% $79 | +5% $132 | +10% $184 |
| Rate | -1.0pp $150 | -0.5pp $115 | base $79 | +0.5pp $43 | +1.0pp $6 |
UW: 25.0% down · 7.5% · 30yr · 1.5% tax · 5.0% vac · 8.0% maint · 8.0% mgmt
Financing live
Cash to close
- Down payment
- $35,000
- Closing costs
- $4,200
- Reserves months
- —
- Total cash needed
- —
Loan-product check · same deal, 3 products live
Conventional
25% down · 7.5% · 30yr
- Down + closing
- —
- Monthly P&I
- —
- Monthly cashflow
- —
- DSCR
- —
- Eligible?
- —
Personal DTI + credit; lowest rate.
DSCR
20% down · 8.5% · 30yr
- Down + closing
- —
- Monthly P&I
- —
- Monthly cashflow
- —
- DSCR
- —
- Eligible?
- —
No personal income docs; deal must DSCR.
Hard money
10% down · 12.0% · 12mo
- Down + closing
- —
- Monthly P&I
- —
- Monthly cashflow
- —
- DSCR
- —
- Eligible?
- —
Short-term bridge; refi at stabilization.
Listing history 19 events
-
2026-06-22days on market $140,000 Active 84 DOM
-
2026-06-21days on market $140,000 Active 83 DOM
-
2026-06-19days on market $140,000 Active 81 DOM
-
2026-06-18days on market $140,000 Active 80 DOM
-
2026-06-17days on market $140,000 Active 79 DOM
-
2026-06-16days on market $140,000 Active 78 DOM
-
2026-06-15days on market $140,000 Active 77 DOM
-
2026-06-14days on market $140,000 Active 75 DOM
-
2026-06-12days on market $140,000 Active 74 DOM
-
2026-06-09days on market $140,000 Active 71 DOM
-
2026-06-08days on market $140,000 Active 70 DOM
-
2026-06-07days on market $140,000 Active 69 DOM
-
2026-06-07days on market $140,000 Active 68 DOM
-
2026-06-04days on market $140,000 Active 65 DOM
-
2026-06-02days on market $140,000 Active 64 DOM
-
2026-06-01days on market $140,000 Active 63 DOM
-
2026-05-31days on market $140,000 Active 62 DOM
-
2026-05-31days on market $140,000 Active 61 DOM
-
2026-03-30$140,000 Active 693-char remark
Show marketing remark (693 chars)
Charming park model offering an affordable and low-maintenance way to enjoy your own place in the beautiful White Mountains! This cozy retreat is perfect as a weekend getaway, summer escape, seasonal residence, or STR with a comfortable layout and inviting cabin-style feel. Enjoy the simplicity of owning your own space without the cost and upkeep of traditional homeownership. Ideal for those looking for a lock-and-leave property. Please note: This is a park model home situated on a leased lot (no land ownership). Per park and zoning guidelines, the home is intended for seasonal/recreational use and not full-time residence. Park rules and lot rent apply. Pictures are of the model home.
ⓘ Source: listings_history table (triggers on properties + properties_extension) + one-shot
backfill from property_details.listing_events for pre-trigger history.
Climate risk First Street
- Flood 1/10 Low FEMA zone X (unshaded) · 0% chance over 30 yrs
- Wildfire 7/10 Severe
- Heat 2/10 Low 7 d/yr ≥87°F today · 18 d/yr by 30 yrs out
- Wind 1/10 Low
- Air quality 1/10 Low 0 unhealthy d/yr today · 0 by 30 yrs out
Nearby sold comps map
Loading sold comps map…
Walkable amenities ~0.75 mi
Loading nearby amenities…
Taxation est. · year 1
- Rental income
- $15,899
- − Mortgage interest
- −$7,842
- − Property taxes
- −$2,100
- − Insurance
- −$700
- − Repairs & maintenance
- −$1,272
- − Management
- −$1,272
- − Depreciation
- −$4,073
- Taxable loss
- −$1,360
- Est. tax savings @ 24.0%
- +$326
- After-tax cash flow
- $1,277/yr
For passive investors: Depreciation is non-cash, so a rental often shows a tax loss while cash-flowing — sheltering income. Rental losses are passive: they offset passive income freely, and up to $25,000/yr can offset ordinary (W-2) income if you actively participate and your MAGI is under $100k (phasing out to $0 by $150k); unused losses carry forward. On sale, claimed depreciation is recaptured at up to 25%, and gains may owe capital-gains tax (a 1031 exchange can defer both). Figures are a year-1 estimate at your 24.0% rate — not tax advice; consult a CPA.
Condition & rehab AI · 14 photos
This charming park model home is in excellent condition with no visible repairs needed. It offers a low-maintenance living experience and is ideal for seasonal or recreational use.
Value-add opportunities
- Both Landscaping — A well-maintained landscape can enhance both the resale and rental value of the property.
- Both Painting — Refreshing the exterior paint can improve the curb appeal and increase the property's value.
Renovation cost estimate screening
Value-add ROI direction
- Both Landscaping — A well-maintained landscape can enhance both the resale and rental value of the property. ↑
- Both Painting — Refreshing the exterior paint can improve the curb appeal and increase the property's value. ↑
ⓘ Cost ranges are severity-bucket heuristics (US national rule-of-thumb). Get contractor quotes + a written scope before underwriting a rehab budget.
Schools (NCES district)
- District
- Heber-Overgaard Unified District (4392)
- NCES district ID
- 0400026
- Math proficiency
- 52% ▼ -5.00%
- Reading proficiency
- 45% ▼ -1.00%
- Median HH income
- $37,916
- Composite
- 40.42/100
- National rank
- #3727
- State rank
- #51 of 249 in AZ
Livability — Heber-Overgaard
No livability data for this city. (Only ~50 U.S. cities are tracked.)
Census & demographics
- Population (ZIP)
- 3,989
Population outlook (Navajo County) Hauer SSP2
- Today (2025)
- 105,760 people
- By 2030
- 103,301 · -2.3%
- By 2040
- 97,070 · -8.2%
- By 2050
- 88,850 · -16.0%
- By 2075
- 65,180 · -38.4%
- By 2100
- 37,281 · -64.7%
Race, ethnicity, and origin ACS 2023
- Neighborhood character
- Predominantly White (89%)
- Race & ethnicity
- White 89% Hispanic / Latino 5% Two or more races 4% Native American 3% Asian 2%
- Common ancestry
- Lithuanian 10% Italian 7% Portuguese 3%
- Foreign-born
- 4% · Canada, China
- Languages at home
- 93% English-only · Spanish 2% Other Indo-European 1% Russian/Polish/Slavic 1%
Political lean MEDSL · Navajo
- 2024 margin
- R (+17.2) · D 40.9% · R 58.1%
- 2008→2024 swing
- -5.5pp toward R · 2008: -11.7pp · 2024: -17.2pp
- All cycles
- 2024: R+17.2 2020: R+8.2 2016: R+7.9 2012: R+8.4 2008: R+11.7
Not yet ingested
- Civics
- —
Market trends
- HPI YoY
- ▼ -83.51%
- Current HPI
- 358.021
- Rent YoY
- —
- Metro
- —
- State GDP YoY
- ▲ 4.54%
- F500 in state
- 20
Industry mix (Fortune 500 HQ in AZ)
| Industry | F500 HQs | Revenue |
|---|---|---|
| Technology | 2 | $13B |
|
||
| Mining / Metals | 1 | $23B |
|
||
| Environmental Services | 1 | $16B |
|
||
| Metals / Steel | 1 | $14B |
|
||
| Technology Distribution | 1 | $9B |
|
||
| Homebuilding | 1 | $8B |
|
||
Price history
1 event — show timeline
- 2026-03-30 Listed $140,000 WMMLS
Cash-flow waterfall
monthlySold comps — $/sqft
last 12 mo · ≤1 miLoading sold comps…