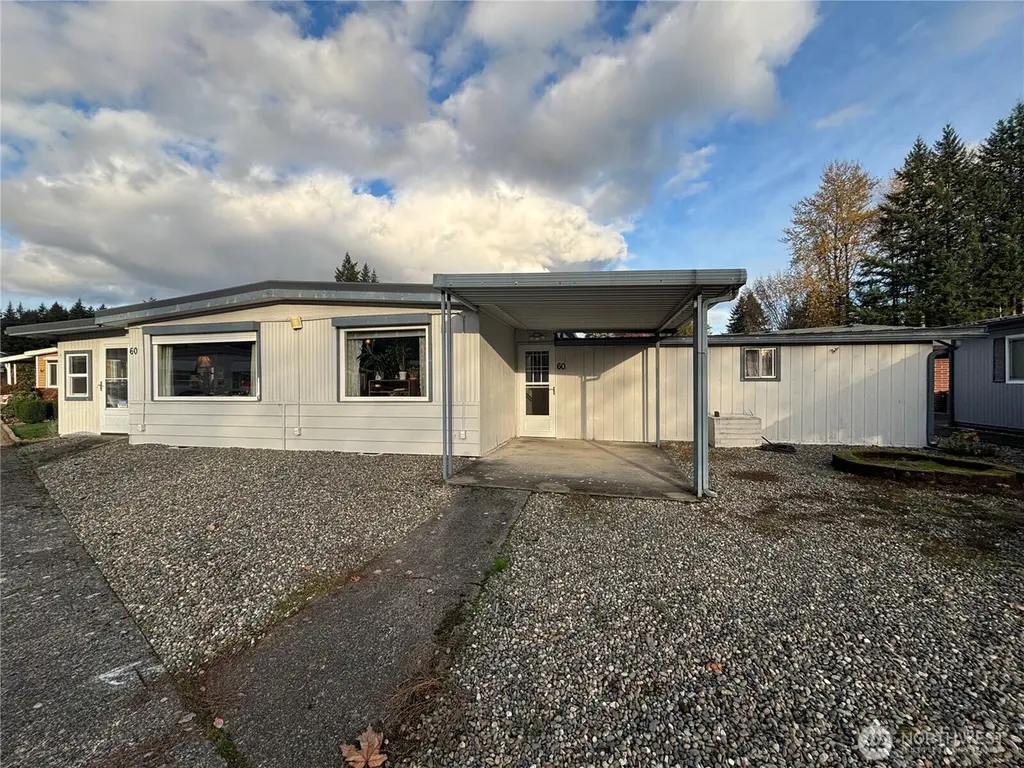
1841 Trosper Rd SW #60 · Tumwater, WA
Flood risk 1/10 · Minimal
- FEMA flood zone
- X (unshaded)
- Chance of flooding over 30 yrs
- 0.0%
- Est. flood insurance / yr
- $507 – $1,088
Fire risk 1/10 · Minimal
- Est. fire insurance / yr
- $604 – $1,122
Heat risk 3/10 · Minor
- Hot days now (above 88°F)
- 7 days/yr
- Hot days in 30 yrs
- 14 days/yr
Wind risk 1/10 · Minimal
- Chance of severe wind over 30 yrs
- —
Air-quality risk 6/10 · Moderate
- Unhealthy air days now
- 7 days/yr
- Unhealthy air days in 30 yrs
- 8 days/yr
Risk factors via First Street. Map © Google.
Why this score? — see what drove the B grade
The composite is a weighted blend of 9 inputs, each scored 0–100. Each bar is that input's sub-score; the figure is the points it added to the 100-point composite (weight × sub-score).
- Cash flow +30.0/30.0
- 1% rule +10.0/10.0
- DSCR +10.0/10.0
- ARV discount +7.5/15.0
- Schools +5.6/10.0
- Livability +4.2/5.0
- Rent growth +3.1/5.0
- Condition / age +2.5/5.0
- Appreciation +0.0/10.0
$55,000
🖨 Deal sheet 📄 Offer letter ✓ Due diligence
Listing remarks
Discover the perfect blend of comfort and convenience in this charming mobile home, nestled within a friendly park community. This two-bedroom, two-bath residence boasts a sloped entry, ensuring ease of access. The home features a carport with space for two cars, complemented by additional storage and a finished room next to the carport for extra space. Inside, a spacious kitchen and dining room await, alongside a pantry for ample storage. The cozy living room, adorned with metal shades, leads to an additional finished room with outdoor access. The master bedroom offers a walk-in closet and shower, while the second bedroom provides generous space.
Key facts
- Pantry
- Finished room
- Spacious kitchen
Tags
Neighborhood map
What this means for you Summary
Snapshot
- This is a 2-bed/2.0-bath manufactured listed at $55k.
Deal economics
- At list price, monthly cash flow is $1k ($15k/yr) — positive.
- The deal already cash-flows at list — no discount required.
- Meets the 1% rule at list price ($2k rent vs $55k).
- Recommended offer: $48k (12.0% below list) — sets the bar for market timing.
- Cap rate 34.4% vs local median 2.7% in Tumwater — top-decile yield for the area; either an underpriced asset or a hidden risk that comps aren't pricing in. Stress-test before assuming the spread holds.
Location & tenants
- Location reads 84/100 on livability (#39 in WA, #700 nationally) — a professional / high-income tenant draw. Strengths: commute A+, housing A+, health & safety A+; Watch: amenities D, cost of living D-.
- Tumwater School District (urban): math 57% / reading 69% proficiency, ranked #37 of 291 in WA (top 13%) — acceptable for families but not a draw, mixed tenant base, ~2y average lease.
- Market conditions: Rents rising (+2.3%/yr); 233 active listings in the ZIP; 20 comparable units currently listed for rent nearby; rentals at typical pace (median 21d on market — plan ~3-4 weeks tenant-placement turnaround); solid renter incomes; 1,222 units permitted in Thurston County in 2024 (508 in 5+ unit buildings).
Forward outlook
- Local home prices are declining (-3.0%/yr); year-one equity from $380 of loan paydown is wiped out by about $2k of value loss. Plan a longer hold.
- Thurston County population projected at +27% by 2050 — long-run rental-demand tailwind backs the buy-and-hold thesis.
- At projected returns (-3.0% appreciation + 2.3% rent growth), your $15k cash investment doubles in ~2 years — after that, you're playing with house money.
Negotiation context
- It's been on market 208 days — a 12% lower offer ($48k) is reasonable based on typical stale-listing flexibility.
- 2 sale attempts since 22y ago; this cycle's ask has dropped $60k (52%) from the opening price — seller is motivated, your offer sets the floor, not the list.
- Current owner paid $29k; list at $55k implies a 90% gain — meaningful room to come down on a strong offer.
Questions for the listing agent
- It's been on market 208 days. Have you received any prior offers? Is the seller open to a 12% concession, seller financing, or rate buy-down credit?
- Built in 1974 — when were the roof, HVAC, electrical panel, plumbing, and water heater last replaced?
- Why hasn't it sold? Are there any deal-killer items the seller is aware of (foundation, flood, title, zoning, code violations)?
- Is there a deadline driving the sale (1031 exchange, divorce, estate, relocation)? That informs how much negotiation room exists.
- Schools are A-rated — typically a magnet for longer-tenancy family renters. What's the average tenant stay here, and is there a school-zone premium baked into asking?
- What's the average days-on-market for RENTAL listings here right now (not sales)? A rising rental-DOM trend means longer vacancies and softer asking-rent achievability than the comps imply.
- What's the recent tenant-quality profile in this submarket — average credit score on applications, eviction rate, late-payment / NSF rate, and stable-employment percentage? A property-management company in the area should have these aggregated.
- How much new for-sale + rental construction is in the pipeline within 1–3 miles? Heavy new supply typically softens prices + rents 12–24 months out; constrained supply supports both.
Investment metrics
- 1% rule
- 3.74% ✓
- Cap rate
- 34.38%
- Cash-on-cash
- 100.30%
- DSCR
- 5.46
- GRM
- 2.2
CMA / ARV
- ARV (median comp)
- $121,493
- List price
- $55,000
- Delta
- -54.73%
- Verdict
- UNDERPRICED
- Comps
- 14 within 1.0 mi
Show comp detail 12 sales within ~0.75 mi
| Address | Dist | Beds/Ba | Sqft | Sold | Price | $/sf | Match |
|---|---|---|---|---|---|---|---|
| 1841 Trosper Rd SW #38 | 0.00mi | 2/2.0 | 1,152 (-2%) | 13mo | $37,000 | $32 | 86 |
| 1841 Trosper Rd SW #25 | 0.00mi | 2/2.0 | 1,152 (-2%) | 14mo | $75,000 | $65 | 86 |
| 930 Trosper Rd #135 | 0.28mi | 2/2.0 | 1,188 (+2%) | 12mo | $132,000 | $111 | 75 |
| 5705 Littlerock Rd SW #41 | 0.34mi | 3/2.0 (+1) | 1,136 (-3%) | 4mo | $85,000 | $75 | 71 |
| 5081 E Gray Sea Eagle Ln SW | 0.41mi | 2/2.0 | 1,176 (+0%) | 13mo | $100,000 | $85 | 69 |
| 930 Trosper Rd SW #78 | 0.37mi | 3/2.0 (+1) | 1,120 (-4%) | 3mo | $85,000 | $76 | 68 |
| 930 Trosper Rd SW #64 | 0.40mi | 3/2.0 (+1) | 1,248 (+7%) | 2mo | $61,000 | $49 | 64 |
| 5119 Golden Eagle Ln SW | 0.43mi | 3/2.0 (+1) | 1,232 (+5%) | 5mo | $196,000 | $159 | 62 |
| 930 Trosper Rd SW #37 | 0.47mi | 2/2.0 | 1,152 (-2%) | 20mo | $100,000 | $87 | 59 |
| 5281 E Eagle Ln SW | 0.30mi | 2/2.0 | 1,056 (-10%) | 15mo | $235,000 | $223 | 57 |
| 5354 Golden Eagle Ln SW | 0.30mi | 2/2.0 | 1,344 (+15%) | 9mo | $220,000 | $164 | 54 |
| 930 Trosper Rd SW #34 | 0.43mi | 2/2.0 | 1,040 (-11%) | 11mo | $45,400 | $44 | 52 |
Match score weights: distance 35% · size 25% · config 20% · recency 20%. Top-matched comps best support the ARV.
Projected returns pro-forma
-3.0% appreciation · 2.26% rent growth · sell at horizon
- IRR
- —
- Equity multiple
- 5.65×
- Total profit
- $71,557
- Equity at exit
- $8,201
- IRR
- —
- Equity multiple
- 11.50×
- Total profit
- $161,752
- Equity at exit
- $4,755
Cash invested: $15,400 (down + closing). Projections, not guarantees.
Landlord ↔ Tenant lean methodology
- Overall (STATE)
- 28 Tenant-Leaning
- State Washington
- 28 Tenant-Leaning · D+8
- County
- — inherits STATE
- City
- — inherits STATE
ZIP-level market 98512
- Rents YoY
- 2.3%
- Active inventory
- 233
- Price-to-rent
- 2.2×
Monthly cashflow live
- Estimated rent
- $2,058 high interval (Pro) →
- Mortgage (P&I)
- −$288
- Tax from tax record
- −$27 /mo · $327/yr
- Insurance
- −$23
- HOA
- −$0
- Vacancy / Maint / Mgmt
- −$432
- Net cashflow
- $1,287
Break-even live
UW: 25.0% down · 7.5% · 30yr · 1.5% tax · 5.0% vac · 8.0% maint · 8.0% mgmt
Financing live
Cash to close
- Down payment
- $13,750
- Closing costs
- $1,650
- Reserves months
- —
- Total cash needed
- —
Loan-product check · same deal, 3 products live
Conventional
25% down · 7.5% · 30yr
- Down + closing
- —
- Monthly P&I
- —
- Monthly cashflow
- —
- DSCR
- —
- Eligible?
- —
Personal DTI + credit; lowest rate.
DSCR
20% down · 8.5% · 30yr
- Down + closing
- —
- Monthly P&I
- —
- Monthly cashflow
- —
- DSCR
- —
- Eligible?
- —
No personal income docs; deal must DSCR.
Hard money
10% down · 12.0% · 12mo
- Down + closing
- —
- Monthly P&I
- —
- Monthly cashflow
- —
- DSCR
- —
- Eligible?
- —
Short-term bridge; refi at stabilization.
Rent comps 20 comps
| Address | Beds | Baths | Sqft | Rent | $/sqft | DOM | Units | Dist |
|---|---|---|---|---|---|---|---|---|
| 1619 Trosper Rd SW Tumwater, WA | 3.0 | 2.5 | 1295 | $2,495 | $1.93 | 21d | 1 | 0.21mi |
| 1978 Trosper Rd SW Tumwater, WA | 1.0–3.0 | 1.0–2.0 | 1050 | $2,428 | $2.31 | 44d | 3 | 0.25mi |
| 1978 Trosper Rd SW Tumwater, WA | 1.0–3.0 | 1.0–2.0 | 1106 | $2,246 | $2.03 | 14d | 4 | 0.25mi |
| 4822 Rural Rd SW Tumwater, WA | 2.0 | 2.0 | 1025 | $1,995 | $1.95 | 21d | 1 | 0.54mi |
| 1517 Bishop Rd SW Tumwater, WA | 2.0 | 1.0–2.0 | 669 | $1,930 | $2.88 | 13d | 1 | 0.54mi |
| 1500 Lake Park Dr SW #29 Tumwater, WA | 2.0 | 1.5 | 1428 | $1,850 | $1.30 | 21d | 1 | 0.56mi |
| 6705 Linderson Way SW Tumwater, WA | 1.0–3.0 | 1.0–2.0 | 900 | $2,038 | $2.26 | 13d | 6 | 0.68mi |
| 6805 Littlerock Rd SW Tumwater, WA | 2.0 | 1.0 | 1000 | $1,495 | $1.50 | 44d | 1 | 0.72mi |
| 301 T St SW Tumwater, WA | 2.0 | 1.0 | 589 | $1,635 | $2.78 | 14d | 5 | 0.75mi |
| 215 Pinehurst Dr SW Tumwater, WA | 2.0 | 1.0–2.5 | 759 | $1,950 | $2.57 | 13d | 4 | 0.78mi |
| 214 65th Way SW Tumwater, WA | 2.0 | 1.0 | 1000 | $1,850 | $1.85 | 21d | 1 | 0.89mi |
| 829 Israel Rd SW Apt A4 Tumwater, WA | 2.0 | 1.0 | 850 | $1,395 | $1.64 | 14d | 1 | 0.92mi |
| 829 Israel Rd SW Apt B6 Tumwater, WA | 2.0 | 1.0 | 850 | $1,395 | $1.64 | 44d | 1 | 0.92mi |
| 801 Israel Rd SW Tumwater, WA | 2.0 | 1.5 | 965 | $1,860 | $1.93 | 13d | 2 | 0.98mi |
| 6504 Capitol Blvd SE Tumwater, WA | 1.0 | 1.0 | 974 | $2,125 | $2.18 | 13d | 1 | 1.00mi |
| 220 Israel Rd SW Unit G8 Tumwater, WA | 2.0 | 1.5 | 968 | $1,975 | $2.04 | 44d | 1 | 1.01mi |
| 151 Cherry Ln SE Tumwater, WA | 3.0 | 1.0 | 874 | $2,195 | $2.51 | 21d | 1 | 1.08mi |
| 811 S 3rd Ave SW Unit B Tumwater, WA | 3.0 | 2.0 | 1336 | $2,300 | $1.72 | 44d | 1 | 1.17mi |
| 1704 Barnes Blvd SW Tumwater, WA | 1.0–3.0 | 1.0–2.5 | 920 | $2,004 | $2.18 | 14d | 35 | 1.41mi |
| 1992 Ridgeview Loop SW Unit 204 Tumwater, WA | 2.0 | 1.0 | 804 | $1,700 | $2.11 | 21d | 1 | 1.48mi |
Listing history 23 events
-
2026-06-18days on market $55,000 Active 208 DOM
-
2026-06-17days on market $55,000 Active 207 DOM
-
2026-06-16days on market $55,000 Active 206 DOM
-
2026-06-15days on market $55,000 Active 205 DOM
-
2026-06-14days on market $55,000 Active 203 DOM
-
2026-06-13days on market $55,000 Active 202 DOM
-
2026-06-10days on market $55,000 Active 200 DOM
-
2026-06-09days on market $55,000 Active 199 DOM
-
2026-06-08days on market $55,000 Active 198 DOM
-
2026-06-07days on market $55,000 Active 197 DOM
-
2026-06-05pricedays on market $55,000 Active 194 DOM
-
2026-06-02days on market $69,000 Active 192 DOM
-
2026-06-01days on market $69,000 Active 191 DOM
-
2026-05-31days on market $69,000 Active 190 DOM
-
2026-05-30days on market $69,000 Active 189 DOM
-
2026-03-11price $79,999
-
2026-01-23price $95,000
-
2026-01-09price $100,000
-
2025-12-27price $105,000
-
2025-12-13price $110,000
-
2025-11-22$115,000 Active
-
2004-09-21soldstatus $29,000
-
2004-08-06$29,900
ⓘ Source: listings_history table (triggers on properties + properties_extension) + one-shot
backfill from property_details.listing_events for pre-trigger history.
Tax reassessment forecast WA · Resets to sale price
- Current annual tax
- $327 · $27/mo
- Projected year-2 tax
- $539 · $45/mo
- Expected delta
- +$212/yr (+$18/mo · 64.8%)
ⓘ Screening estimate from a state-policy table — verify with the county assessor before closing.
Climate risk First Street
- Flood 1/10 Low FEMA zone X (unshaded) · 0% chance over 30 yrs
- Wildfire 1/10 Low
- Heat 3/10 Moderate 7 d/yr ≥88°F today · 14 d/yr by 30 yrs out
- Wind 1/10 Low
- Air quality 6/10 Major 7 unhealthy d/yr today · 8 by 30 yrs out
Nearby sold comps map
Loading sold comps map…
Walkable amenities ~0.75 mi
Loading nearby amenities…
Taxation est. · year 1
- Rental income
- $24,696
- − Mortgage interest
- −$3,081
- − Property taxes
- −$327
- − Insurance
- −$275
- − Repairs & maintenance
- −$1,976
- − Management
- −$1,976
- − Depreciation
- −$1,600
- Taxable income
- $15,462
- Est. tax owed @ 24.0%
- −$3,711
- After-tax cash flow
- $11,736/yr
For passive investors: Depreciation is non-cash, so a rental often shows a tax loss while cash-flowing — sheltering income. Rental losses are passive: they offset passive income freely, and up to $25,000/yr can offset ordinary (W-2) income if you actively participate and your MAGI is under $100k (phasing out to $0 by $150k); unused losses carry forward. On sale, claimed depreciation is recaptured at up to 25%, and gains may owe capital-gains tax (a 1031 exchange can defer both). Figures are a year-1 estimate at your 24.0% rate — not tax advice; consult a CPA.
Schools (NCES district)
- District
- Tumwater School District
- NCES district ID
- 5309100
- Math proficiency
- 57% ▬ 0.00%
- Reading proficiency
- 69% ▼ -1.00%
- Median HH income
- $64,209
- Composite
- 56.38/100
- National rank
- #2477
- State rank
- #37 of 291 in WA
Livability — Tumwater
- Score
- 84/100
- State rank
- #39
- US rank
- #700
Category grades
Schools grade is shown separately in the Schools card above.
Census & demographics
- Census place
- Tumwater, WA
- County
- Thurston County · 269,345 people
- City population
- 46,937
- Metro
- Olympia-Lacey-Tumwater, WA
- Population (ZIP)
- 31,864
- Household income
- $101,530
- Rent vs Own
- Severe rent burden
- 784.0
Population outlook (Thurston County) Hauer SSP2
- Today (2025)
- 308,239 people
- By 2030
- 326,483 · +5.9%
- By 2040
- 359,890 · +16.8%
- By 2050
- 391,800 · +27.1%
- By 2075
- 468,024 · +51.8%
- By 2100
- 519,890 · +68.7%
Race, ethnicity, and origin ACS 2023
- Neighborhood character
- Predominantly White (72%)
- Race & ethnicity
- White 72% Two or more races 13% Hispanic / Latino 9% Asian 4% Black 3% Native American 1%
- Hispanic origin (detail)
- Mexican 5%
- Common ancestry
- Portuguese 4% Italian 4% Slovak 4%
- Foreign-born
- 6% · Canada, Vietnam, China
- Languages at home
- 92% English-only · Spanish 3% Vietnamese 1% German/W. Germanic 1%
Political lean MEDSL · Thurston
- 2024 margin
- Strong D (+20.4) · D 58.5% · R 38.1% · Other 3.5%
- 2008→2024 swing
- -1.3pp toward R · 2008: 21.7pp · 2024: 20.4pp
- All cycles
- 2024: D+20.4 2020: D+18.6 2016: D+15.4 2012: D+19.0 2008: D+21.7
Not yet ingested
- Civics
- —
Market trends
- HPI YoY
- ▼ -348.18%
- Current HPI
- 347.121
- Rent YoY
- ▲ 2.26%
- Metro
- Olympia-Lacey-Tumwater, WA
- State GDP YoY
- ▲ 4.65%
- F500 in state
- 22
Industry mix (Fortune 500 HQ in WA)
| Industry | F500 HQs | Revenue |
|---|---|---|
| Retail | 2 | $269B |
|
||
| Technology / Retail | 1 | $638B |
|
||
| Technology | 1 | $245B |
|
||
| Telecommunications | 1 | $38B |
|
||
| Food / Beverage | 1 | $36B |
|
||
| Automotive / Trucks | 1 | $34B |
|
||
Price history
+167.6% since first listed8 events — show timeline
- 2026-03-11 Price Changed $79,999 NWMLS as Distributed by MLS Grid
- 2026-01-23 Price Changed $95,000 NWMLS as Distributed by MLS Grid
- 2026-01-09 Price Changed $100,000 NWMLS as Distributed by MLS Grid
- 2025-12-27 Price Changed $105,000 NWMLS as Distributed by MLS Grid
- 2025-12-13 Price Changed $110,000 NWMLS as Distributed by MLS Grid
- 2025-11-22 Listed $115,000 NWMLS as Distributed by MLS Grid
- 2004-09-21 Sold (MLS) $29,000 NWMLS as Distributed by MLS Grid
- 2004-08-06 Listed $29,900 NWMLS as Distributed by MLS Grid
Property tax history
+4.7%/yrLatest (2016): $327 · +9.7% YoY. Source: county tax records.
Cash-flow waterfall
monthlySold comps — $/sqft
last 12 mo · ≤1 miLoading sold comps…