125 Evening Glow Dr · Hutto, TX
Flood risk No data
- FEMA flood zone
- —
- Chance of flooding over 30 yrs
- —
- Est. flood insurance / yr
- —
Fire risk No data
- Est. fire insurance / yr
- —
Heat risk No data
- Hot days now (above threshold)
- —
- Hot days in 30 yrs
- —
Wind risk No data
- Chance of severe wind over 30 yrs
- —
Air-quality risk No data
- Unhealthy air days now
- —
- Unhealthy air days in 30 yrs
- —
Risk factors via First Street. Map © Google.
Why this score? — see what drove the D+ grade
The composite is a weighted blend of 9 inputs, each scored 0–100. Each bar is that input's sub-score; the figure is the points it added to the 100-point composite (weight × sub-score).
- ARV discount +14.1/15.0
- Cash flow +12.9/30.0
- Condition / age +4.8/5.0
- 1% rule +4.3/10.0
- DSCR +3.9/10.0
- Livability +3.9/5.0
- Schools +3.3/10.0
- Rent growth +1.9/5.0
- Appreciation +0.0/10.0
$237,499
🖨 Deal sheet 📄 Offer letter ✓ Due diligence
Listing remarks
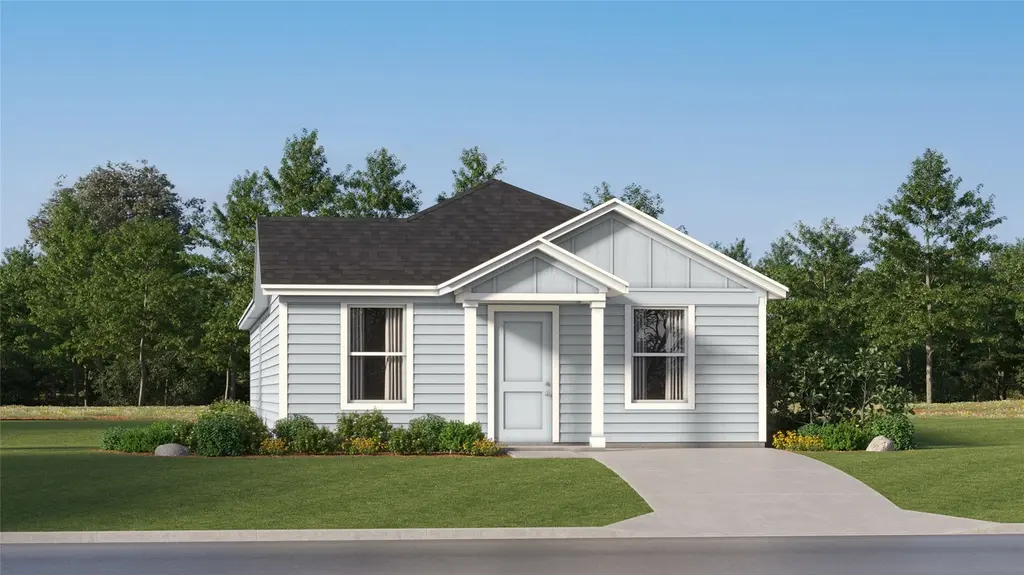
The Timms - This new single-level home features a modern and low-maintenance design. Three bedrooms can be found off the foyer, leading to an open-concept floorplan that combines the kitchen, living and dining areas. The luxe owner’s suite is tucked into a private rear corner, complete with an en-suite bathroom and walk-in closet. Photos are for illustrative purposes only. Estimated Completion July 2026. The completion date, prices and features may vary and are subject to change. Please verify with Lennar directly.
Key facts
- 4,356 sq ft lot
- Parking
- Built 2026
Property features AI
Finance
- HOA & community: Part of Firefly Pointe HOA; Monthly HOA fee of $120 covering common area maintenance and internet; Community mailbox
Exterior
- Parking: Driveway
- Utilities: Electricity available; Public water; Public sewer (connected)
- Home design: Single-story home; New construction by Lennar; Faces southwest; Slab foundation
- Construction: HardiPlank-type siding; Composition roof; Built by Lennar
- Exterior features: Private yard; Front porch; Back yard; Front yard; Interior lot; Privacy wood fencing
Interior
- Kitchen: Dishwasher; Range
- Bedrooms: 4 main-level bedrooms
- Flooring: Carpet; Vinyl
- Bathrooms: 2 full bathrooms
- Heating & cooling: Central heating; Central air conditioning
- Interior features: Entrance foyer; Open floorplan; Walk-in closet(s); Blinds on windows
- Laundry & utility: Dedicated laundry room
Neighborhood map
What this means for you Summary
Snapshot
- This is a 4-bed/2.0-bath single-family listed at $237k. Condition is rated excellent.
Deal economics
- At list price, monthly cash flow is $-16 ($-194/yr) — negative.
- To cash-flow at today's rent, offer at most $235k (1.0% below list).
- To meet the 1% rule (rent ≥ 1% of price), the offer needs to be $221k (7.0% below list).
- Recommended offer: $221k (7.0% below list) — sets the bar for 1% rule.
- Cap rate 6.2% vs local median 3.6% in Hutto — top-decile yield for the area; either an underpriced asset or a hidden risk that comps aren't pricing in. Stress-test before assuming the spread holds.
Location & tenants
- Location reads 77/100 on livability (#79 in TX, #2,794 nationally) — a middle-class / working-renter tenant base. Strengths: crime A+, housing A+, health & safety A+; Watch: schools C-, amenities C-, commute F.
- Hutto ISD (rural): math 30% / reading 42% proficiency, ranked #438 of 826 in TX (top 53%) — families likely to look elsewhere, expect single-tenant / working-renter base with shorter leases.
- Market conditions: Rents soft (-2.4%/yr); 1033 active listings in the ZIP; 31 comparable units currently listed for rent nearby; rentals at typical pace (median 18d on market — plan ~3-4 weeks tenant-placement turnaround); high-income renter base; 7,543 units permitted in Williamson County in 2024 (1,425 in 5+ unit buildings).
Forward outlook
- Local home prices are declining (-3.0%/yr); year-one equity from $2k of loan paydown is wiped out by about $7k of value loss. Plan a longer hold.
- Williamson County population projected at +69% by 2050 — long-run rental-demand tailwind backs the buy-and-hold thesis.
Negotiation context
- It's been on market 40 days — a 3% lower offer ($230k) is reasonable based on typical stale-listing flexibility.
Questions for the listing agent
- What do current leases actually rent for vs. the listed asking? Can we see a recent rent roll and the last 12 months of T-12 income?
- It's been on market 40 days. Have you received any prior offers? Is the seller open to a 7% concession, seller financing, or rate buy-down credit?
- What does the HOA fee cover, when was the last increase, and are there any pending special assessments or reserve-fund shortfalls?
- Is there a deadline driving the sale (1031 exchange, divorce, estate, relocation)? That informs how much negotiation room exists.
- The area grade is low — what's the realistic commute time and amenity access for the typical tenant pool here? Any planned neighborhood developments (good or bad) we should know about?
- What's the average days-on-market for RENTAL listings here right now (not sales)? A rising rental-DOM trend means longer vacancies and softer asking-rent achievability than the comps imply.
- What's the recent tenant-quality profile in this submarket — average credit score on applications, eviction rate, late-payment / NSF rate, and stable-employment percentage? A property-management company in the area should have these aggregated.
- How much new for-sale + rental construction is in the pipeline within 1–3 miles? Heavy new supply typically softens prices + rents 12–24 months out; constrained supply supports both.
Investment metrics
- 1% rule
- 0.93% ✗
- Cap rate
- 6.21%
- Cash-on-cash
- -0.29%
- DSCR
- 0.99
- GRM
- 9.0
CMA / ARV
- ARV (median comp)
- $277,990
- List price
- $237,499
- Delta
- -14.57%
- Verdict
- UNDERPRICED
- Comps
- 20 within 1.0 mi
Show comp detail 12 sales within ~0.75 mi
| Address | Dist | Beds/Ba | Sqft | Sold | Price | $/sf | Match |
|---|---|---|---|---|---|---|---|
| 109 Evening Glow Dr | 0.03mi | 4/2.0 | 1,500 (0%) | 0mo | $236,999 | $158 | 98 |
| 101 Evening Glow Dr | 0.04mi | 4/2.0 | 1,500 (0%) | 1mo | $252,990 | $169 | 97 |
| 220 Skyfire St | 0.07mi | 4/2.0 | 1,600 (+7%) | 3mo | $275,990 | $172 | 83 |
| 313 Dragonfly Park | 0.10mi | 3/2.0 (-1) | 1,402 (-6%) | 1mo | $265,990 | $190 | 79 |
| 502 Firedance Ct | 0.27mi | 4/2.0 | 1,575 (+5%) | 1mo | $287,990 | $183 | 78 |
| 517 Stratus Ln | 0.38mi | 3/2.0 (-1) | 1,474 (-2%) | 0mo | $275,990 | $187 | 74 |
| 316 Dragonfly Park | 0.06mi | 4/2.0 | 1,707 (+14%) | 1mo | $283,990 | $166 | 73 |
| 522 Firedance Ct | 0.38mi | 3/2.0 (-1) | 1,411 (-6%) | 1mo | $266,990 | $189 | 67 |
| 312 Dragonfly Park | 0.38mi | 4/2.0 | 1,667 (+11%) | 1mo | $285,999 | $172 | 63 |
| 513 Stratus Ln | 0.38mi | 4/2.0 | 1,667 (+11%) | 1mo | $289,990 | $174 | 63 |
| 98 Barton Creek Ln | 0.72mi | 4/2.0 | 1,612 (+8%) | 2mo | $305,000 | $189 | 53 |
| 203 Makinaw Rd | 0.70mi | 4/2.0 | 1,695 (+13%) | 0mo | $349,525 | $206 | 45 |
Match score weights: distance 35% · size 25% · config 20% · recency 20%. Top-matched comps best support the ARV.
Projected returns pro-forma
-3.0% appreciation · 0.0% rent growth · sell at horizon
- IRR
- -20.4%
- Equity multiple
- 0.31×
- Total profit
- $-45,883
- Equity at exit
- $35,412
- IRR
- -23.0%
- Equity multiple
- 0.01×
- Total profit
- $-65,866
- Equity at exit
- $20,535
Cash invested: $66,500 (down + closing). Projections, not guarantees.
Landlord ↔ Tenant lean methodology
- Overall (STATE)
- 87 Strongly Landlord-Friendly
- State Texas
- 87 Strongly Landlord-Friendly · R+5
- County
- — inherits STATE
- City
- — inherits STATE
ZIP-level market 78634
- Rents YoY
- -2.4%
- Active inventory
- 1033
- Price-to-rent
- 9.0×
Monthly cashflow live
- Estimated rent
- $2,209 high interval (Pro) →
- Mortgage (P&I)
- −$1,245
- Tax est. 1.5%
- −$297 /mo · $3,562/yr
- Insurance
- −$99
- HOA
- −$120
- Vacancy / Maint / Mgmt
- −$464
- Net cashflow
- $-16
Break-even live
UW: 25.0% down · 7.5% · 30yr · 1.5% tax · 5.0% vac · 8.0% maint · 8.0% mgmt
Financing live
Cash to close
- Down payment
- $59,375
- Closing costs
- $7,125
- Reserves months
- —
- Total cash needed
- —
Loan-product check · same deal, 3 products live
Conventional
25% down · 7.5% · 30yr
- Down + closing
- —
- Monthly P&I
- —
- Monthly cashflow
- —
- DSCR
- —
- Eligible?
- —
Personal DTI + credit; lowest rate.
DSCR
20% down · 8.5% · 30yr
- Down + closing
- —
- Monthly P&I
- —
- Monthly cashflow
- —
- DSCR
- —
- Eligible?
- —
No personal income docs; deal must DSCR.
Hard money
10% down · 12.0% · 12mo
- Down + closing
- —
- Monthly P&I
- —
- Monthly cashflow
- —
- DSCR
- —
- Eligible?
- —
Short-term bridge; refi at stabilization.
Rent comps 31 comps
| Address | Beds | Baths | Sqft | Rent | $/sqft | DOM | Units | Dist |
|---|---|---|---|---|---|---|---|---|
| 125 Painted Night Rd Hutto, TX | 4.0 | 2.5 | 2000 | $2,099 | $1.05 | 43d | 1 | 0.24mi |
| 313 Stratus LN Hutto, TX | 5.0 | 3.0 | 2171 | $2,125 | $0.98 | 3d | 1 | 0.39mi |
| 518 Firedance CT Hutto, TX | 4.0 | 2.0 | 1867 | $1,995 | $1.07 | 15d | 1 | 0.39mi |
| 207 Flowers Ave Hutto, TX | 3.0 | 2.5 | 1892 | $2,000 | $1.06 | 43d | 1 | 0.59mi |
| 202 Doodle Ln Hutto, TX | 3.0 | 2.5 | 2015 | $2,150 | $1.07 | 24d | 1 | 0.63mi |
| 208 Flowers Ave Hutto, TX | 3.0 | 2.0 | 1435 | $2,600 | $1.81 | 11d | 1 | 0.70mi |
| 125 Watkinville Rd Hutto, TX | 3.0 | 2.5 | 2015 | $2,200 | $1.09 | 24d | 1 | 0.72mi |
| 517 Emory Crossing Blvd Hutto, TX | 3.0 | 2.5 | 1497 | $1,975 | $1.32 | 17d | 1 | 0.76mi |
| 112 Watkinville Rd Hutto, TX | 3.0 | 2.5 | 1734 | $1,900 | $1.10 | 43d | 1 | 0.77mi |
| 217 Greens Bayou Trl Hutto, TX | 4.0 | 2.0 | 1837 | $2,100 | $1.14 | 4d | 1 | 0.83mi |
| 201 Betsy Rd Hutto, TX | 3.0 | 2.0 | 1305 | $1,995 | $1.53 | 17d | 1 | 0.84mi |
| 110 Fort Clark Springs Dr Hutto, TX | 4.0 | 2.0 | 1839 | $2,100 | $1.14 | 16d | 1 | 0.85mi |
| 306 Stinchcomb Rd Hutto, TX | 4.0 | 2.0 | 1943 | $2,550 | $1.31 | 43d | 1 | 0.92mi |
| 121 Sweetwater Creek Ln Hutto, TX | 3.0 | 2.0 | 1472 | $1,900 | $1.29 | 15d | 1 | 0.96mi |
| 125 Sweetwater Creek Ln Hutto, TX | 4.0 | 2.0 | 1821 | $2,000 | $1.10 | 16d | 1 | 0.97mi |
| 132 Sweetwater Creek Ln Hutto, TX | 4.0 | 2.0 | 1692 | $1,995 | $1.18 | 43d | 1 | 0.97mi |
| 128 Big Sandy Creek Dr Hutto, TX | 4.0 | 2.0 | 2035 | $2,300 | $1.13 | 43d | 1 | 1.03mi |
| 207 Sweetwater Creek Ln Hutto, TX | 4.0 | 2.0 | 1839 | $1,995 | $1.08 | 43d | 1 | 1.03mi |
| 112 Holmby Dr Hutto, TX | 4.0 | 3.0 | 2044 | $2,299 | $1.12 | 43d | 1 | 1.05mi |
| 122 Holmby Dr Hutto, TX | 4.0 | 3.0 | 2012 | $2,350 | $1.17 | 17d | 1 | 1.07mi |
| 231 Sweetwater Creek Ln Hutto, TX | 4.0 | 2.0 | 1839 | $2,290 | $1.25 | 17d | 1 | 1.11mi |
| 124 Carrington St Hutto, TX | 3.0 | 2.0 | 1742 | $1,965 | $1.13 | 4d | 1 | 1.13mi |
| 235 Sweetwater Creek Ln Hutto, TX | 3.0 | 2.0 | 1472 | $1,850 | $1.26 | 17d | 1 | 1.13mi |
| 211 Almquist St Hutto, TX | 3.0 | 2.0 | 1677 | $1,850 | $1.10 | 24d | 1 | 1.14mi |
| 3333 County Road 119 Hutto, TX | 4.0 | 2.5 | 1802 | $1,950 | $1.08 | 2d | 1 | 1.16mi |
| 207 Brown St Hutto, TX | 4.0 | 2.0 | 1701 | $1,950 | $1.15 | 4d | 1 | 1.20mi |
| 95 Emory Crossing Blvd Hutto, TX | 1.0–3.0 | 1.0–2.0 | 1120 | $2,514 | $2.24 | 1d | 52 | 1.29mi |
| 209 Phillips St Hutto, TX | 3.0 | 2.5 | 1920 | $1,900 | $0.99 | 24d | 1 | 1.30mi |
| 106 Phillips St Hutto, TX | 3.0 | 2.5 | 1930 | $1,895 | $0.98 | 12d | 1 | 1.36mi |
| 106 Phillips St Hutto, TX | 3.0 | 2.5 | 1930 | $1,895 | $0.98 | 24d | 1 | 1.36mi |
| 111 Lyrebird Ln Hutto, TX | 5.0 | 2.5 | 2211 | $3,800 | $1.72 | 43d | 1 | 1.43mi |
HOA detail
- Monthly dues
- $120 · $1,440/yr
Listing history 14 events
-
2026-06-16status $237,499 Pending 40 DOM
-
2026-06-15days on market $237,499 Active 40 DOM
-
2026-06-13days on market $237,499 Active 38 DOM
-
2026-06-09days on market $237,499 Active 34 DOM
-
2026-06-08days on market $237,499 Active 33 DOM
-
2026-06-07days on market $237,499 Active 32 DOM
-
2026-06-04days on market $237,499 Active 29 DOM
-
2026-06-03pricedays on market $237,499 Active 28 DOM
-
2026-06-02days on market $238,499 Active 27 DOM
-
2026-06-01days on market $238,499 Active 26 DOM
-
2026-05-31days on market $238,499 Active 25 DOM
-
2026-05-11price $255,999 526-char remark
-
2026-05-08price $258,999 526-char remark
-
2026-05-06$259,999 Active 526-char remark
ⓘ Source: listings_history table (triggers on properties + properties_extension) + one-shot
backfill from property_details.listing_events for pre-trigger history.
Nearby sold comps map
Loading sold comps map…
Walkable amenities ~0.75 mi
Loading nearby amenities…
Taxation est. · year 1
- Rental income
- $26,508
- − Mortgage interest
- −$13,304
- − Property taxes
- −$3,562
- − Insurance
- −$1,187
- − Repairs & maintenance
- −$2,121
- − Management
- −$2,121
- − HOA
- −$1,440
- − Depreciation
- −$6,909
- Taxable loss
- −$4,136
- Est. tax savings @ 24.0%
- +$993
- After-tax cash flow
- $798/yr
For passive investors: Depreciation is non-cash, so a rental often shows a tax loss while cash-flowing — sheltering income. Rental losses are passive: they offset passive income freely, and up to $25,000/yr can offset ordinary (W-2) income if you actively participate and your MAGI is under $100k (phasing out to $0 by $150k); unused losses carry forward. On sale, claimed depreciation is recaptured at up to 25%, and gains may owe capital-gains tax (a 1031 exchange can defer both). Figures are a year-1 estimate at your 24.0% rate — not tax advice; consult a CPA.
Condition & rehab AI · 27 photos
This modern single-level home is move-in ready with excellent condition and minimal maintenance required. It offers a spacious floor plan, modern finishes, and a well-maintained exterior, making it an attractive option for both resale and rental.
Value-add opportunities
- Both Painting exterior and interior walls — Fresh paint enhances curb appeal and interior aesthetics.
- Both Landscaping improvements — Enhances curb appeal and adds value to the property.
- Rental HVAC maintenance — Ensures comfort and energy efficiency for tenants.
- Resale Kitchen appliances maintenance — Keeps the kitchen in top condition for potential buyers.
Renovation cost estimate screening
Value-add ROI direction
- Both Painting exterior and interior walls — Fresh paint enhances curb appeal and interior aesthetics. ↑
- Both Landscaping improvements — Enhances curb appeal and adds value to the property. ↑
- Rental HVAC maintenance — Ensures comfort and energy efficiency for tenants. ↑
- Resale Kitchen appliances maintenance — Keeps the kitchen in top condition for potential buyers. ↑
ⓘ Cost ranges are severity-bucket heuristics (US national rule-of-thumb). Get contractor quotes + a written scope before underwriting a rehab budget.
Schools (NCES district)
- District
- Hutto ISD
- NCES district ID
- 4824100
- Math proficiency
- 30% ▼ -17.00%
- Reading proficiency
- 42% ▼ -5.00%
- Median HH income
- $72,961
- Composite
- 33.33/100
- National rank
- #5501
- State rank
- #438 of 826 in TX
Livability — Hutto
- Score
- 77/100
- State rank
- #79
- US rank
- #2794
Category grades
Schools grade is shown separately in the Schools card above.
Census & demographics
- County
- Williamson County · 680,029 people
- City population
- 46,413
- Metro
- Austin-Round Rock-Georgetown, TX
- Population (ZIP)
- 46,413
- Household income
- $114,426
- Rent vs Own
- Severe rent burden
- 410.0
Population outlook (Williamson County) Hauer SSP2
- Today (2025)
- 699,027 people
- By 2030
- 795,537 · +13.8%
- By 2040
- 990,683 · +41.7%
- By 2050
- 1,184,292 · +69.4%
- By 2075
- 1,623,825 · +132.3%
- By 2100
- 1,924,153 · +175.3%
Race, ethnicity, and origin ACS 2023
- Neighborhood character
- Diverse neighborhood (Simpson 0.62)
- Race & ethnicity
- White 50% Hispanic / Latino 35% Two or more races 18% Black 9% Asian 2%
- Hispanic origin (detail)
- Mexican 26% Puerto Rican 1%
- Common ancestry
- Slovak 2% Italian 2% Lithuanian 2%
- Foreign-born
- 13% · Canada
- Languages at home
- 71% English-only · Spanish 23% Other Indo-European 2% Arabic 1%
Political lean MEDSL · Williamson
- 2024 margin
- Toss-up / Even · D 48.0% · R 50.4% · Other 1.6%
- 2008→2024 swing
- +10.6pp toward D · 2008: -13.0pp · 2024: -2.5pp
- All cycles
- 2024: R+2.5 2020: D+1.4 2016: R+9.9 2012: R+21.5 2008: R+13.0
Not yet ingested
- Civics
- —
Market trends
- HPI YoY
- ▼ -106.56%
- Current HPI
- 194.2221
- Rent YoY
- ▼ -2.41%
- Metro
- Austin-Round Rock-Georgetown, TX
- State GDP YoY
- ▲ 3.95%
- F500 in state
- 110
Industry mix (Fortune 500 HQ in TX)
| Industry | F500 HQs | Revenue |
|---|---|---|
| Energy | 16 | $1,198B |
|
||
| Technology | 5 | $198B |
|
||
| Engineering / Construction | 4 | $72B |
|
||
| Energy Services | 3 | $60B |
|
||
| Utilities | 3 | $41B |
|
||
| Healthcare | 2 | $330B |
|
||
Price history
-8.7% since first listed8 events — show timeline
- 2026-06-15 Pending — Unlock MLS
- 2026-06-02 Price Changed $237,499 Unlock MLS
- 2026-05-29 Price Changed $238,499 Unlock MLS
- 2026-05-26 Price Changed $237,499 Unlock MLS
- 2026-05-20 Price Changed $256,999 Unlock MLS
- 2026-05-11 Price Changed $255,999 Unlock MLS
- 2026-05-08 Price Changed $258,999 Unlock MLS
- 2026-05-06 Listed $259,999 Unlock MLS
Cash-flow waterfall
monthlySold comps — $/sqft
last 12 mo · ≤1 miLoading sold comps…