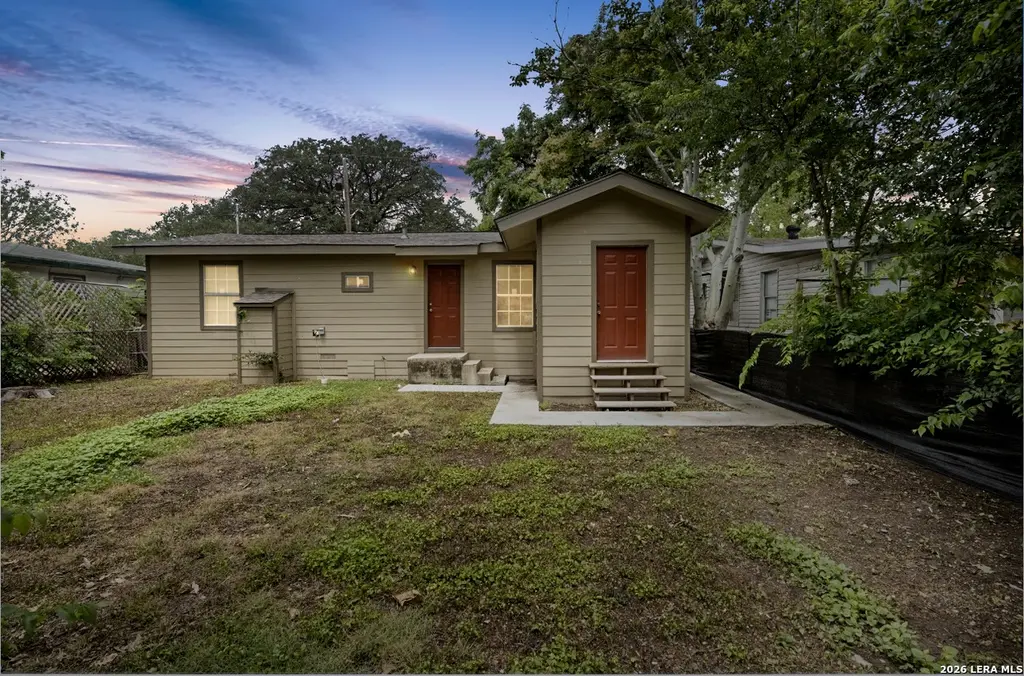
116 Ricardo St · San Antonio, TX
Flood risk 1/10 · Minimal
- FEMA flood zone
- X (unshaded)
- Chance of flooding over 30 yrs
- 0.0%
- Est. flood insurance / yr
- $507 – $1,088
Fire risk 1/10 · Minimal
- Est. fire insurance / yr
- $1,222 – $2,270
Heat risk 8/10 · Major
- Hot days now (above 109°F)
- 7 days/yr
- Hot days in 30 yrs
- 22 days/yr
Wind risk 8/10 · Major
- Chance of severe wind over 30 yrs
- 80.0%
Air-quality risk 2/10 · Minimal
- Unhealthy air days now
- 1 days/yr
- Unhealthy air days in 30 yrs
- 2 days/yr
Risk factors via First Street. Map © Google.
Why this score? — see what drove the B+ grade
The composite is a weighted blend of 9 inputs, each scored 0–100. Each bar is that input's sub-score; the figure is the points it added to the 100-point composite (weight × sub-score).
- Cash flow +25.1/30.0
- ARV discount +15.0/15.0
- Appreciation +10.0/10.0
- DSCR +8.2/10.0
- 1% rule +7.5/10.0
- Rent growth +4.0/5.0
- Livability +4.0/5.0
- Condition / age +2.5/5.0
- Schools +1.3/10.0
$103,000
🖨 Deal sheet 📄 Offer letter ✓ Due diligence
Listing remarks
Multiple offers received. Seller will review offers on June 3rd. Fresh updates and a functional layout make this inviting 2-bedroom, 1-bath home a standout opportunity. Whether you're looking to expand your investment portfolio or purchase a home with great potential, this property offers comfort, convenience, and value. Interior improvements include updated finishes, refreshed kitchen spaces, upgraded windows, and durable flooring throughout. Outside, the property features recent exterior paint and a newer roof, adding to its overall appeal. Ideally positioned with easy access to Hwy 90 and General McMullen Drive, commuting around the city is simple and convenient. Seller is ready to make
Key facts
- Updated finishes
- Durable flooring
- Upgraded windows
Tags
Property features AI
Finance
- HOA & community: Subdivision: EDGEWOOD; Subdivision legal name: GARDENDALE AREA 8 ED
Exterior
- Utilities: Electricity supplied by CPS; City water; City sewer; City garbage service; Water system
- Home design: Pre-owned home; Approximately 79 years old; Composition roof
- Construction: Wood exterior; Composition roof
- Exterior features: Wood exterior; Other building exterior (see remarks)
Interior
- Kitchen: Kitchen 11 x 11; Custom cabinets
- Bedrooms: Master bedroom 11 x 12 (on lower level); Second bedroom 11 x 11
- Flooring: Ceramic tile floor; Wood floor
- Bathrooms: 1 full bathroom
- Heating & cooling: Natural gas heating
- Interior features: Ceiling fans; Washer connection; Dryer connection; Gas water heater; Custom cabinets; City garbage service; All window coverings remain; 1 living area
- Laundry & utility: Washer connection; Dryer connection
Neighborhood map
What this means for you Summary
Snapshot
- This is a 2-bed/1.0-bath single-family listed at $103k.
Deal economics
- At list price, monthly cash flow is $227 ($3k/yr) — positive.
- The deal already cash-flows at list — no discount required.
- Meets the 1% rule at list price ($1k rent vs $103k).
- Cap rate 8.9% vs local median 3.8% in San Antonio — top-decile yield for the area; either an underpriced asset or a hidden risk that comps aren't pricing in. Stress-test before assuming the spread holds.
Location & tenants
- Location reads 80/100 on livability (#31 in TX, #1,616 nationally) — a professional / high-income tenant draw. Strengths: amenities A+, commute A+, cost of living A+; Watch: schools C-, crime F.
- Edgewood ISD (urban): math 12% / reading 21% proficiency, ranked #812 of 826 in TX (top 98%) — low school quality limits family demand, transient renter base, plan for 1-2y turnover.
- Market conditions: Rents rising fast (+6.1%/yr); 127 active listings in the ZIP; 11 comparable units currently listed for rent nearby; rentals at typical pace (median 15d on market — plan ~3-4 weeks tenant-placement turnaround); lower-income renter base — watch delinquency; 8,308 units permitted in Bexar County in 2024 (2,506 in 5+ unit buildings).
- This rent runs 36% of the median local income ($43k/yr) — at the standard rent-burdened threshold; future hikes will face affordability resistance.
Forward outlook
- In year one you build about $11k of equity ($712 loan paydown + $10k appreciation (10.0% local appreciation)).
- Bexar County population projected at +50% by 2050 — long-run rental-demand tailwind backs the buy-and-hold thesis.
- At projected returns (10.0% appreciation + 6.1% rent growth), your $29k cash investment doubles in ~2 years — after that, you're playing with house money.
- By year 4, paydown + projected appreciation supports a ~$39k cash-out refi (75% LTV) — recoverable capital for the next deal without selling this one.
Negotiation context
- Only 6 days on market — expect competitive offers; lowballing is unlikely to land.
- 2 sale attempts; this cycle's ask is 4% above the opening price — seller raised mid-cycle; expect resistance to lowballs.
Risks & watch-outs
- Watch-outs: built in 1947 — expect roof / HVAC / electrical / plumbing capex.
- Climate carrying-cost: severe wind risk, 80% chance of damaging wind over 30y; extreme-heat days projected 7→22/yr by 2055 (HVAC capex compounding) — expect insurance premiums to compound above CPI over the hold.
Questions for the listing agent
- Built in 1947 — when were the roof, HVAC, electrical panel, plumbing, and water heater last replaced?
- Is there a deadline driving the sale (1031 exchange, divorce, estate, relocation)? That informs how much negotiation room exists.
- Crime grade is F in this area — have there been break-ins, vandalism, or insurance claims at this property in the last 3 years? What carrier currently insures it and at what premium?
- What's the average days-on-market for RENTAL listings here right now (not sales)? A rising rental-DOM trend means longer vacancies and softer asking-rent achievability than the comps imply.
- What's the recent tenant-quality profile in this submarket — average credit score on applications, eviction rate, late-payment / NSF rate, and stable-employment percentage? A property-management company in the area should have these aggregated.
- How much new for-sale + rental construction is in the pipeline within 1–3 miles? Heavy new supply typically softens prices + rents 12–24 months out; constrained supply supports both.
Investment metrics
- 1% rule
- 1.25% ✓
- Cap rate
- 8.94%
- Cash-on-cash
- 9.47%
- DSCR
- 1.42
- GRM
- 6.7
CMA / ARV
- ARV (on-the-fly)
- $172,200
- Comps found
- 1
Show comp detail 1 sale within ~0.75 mi
| Address | Dist | Beds/Ba | Sqft | Sold | Price | $/sf | Match |
|---|---|---|---|---|---|---|---|
| 3001 Chihuahua | 0.63mi | 3/2.0 (+1) | 920 (+10%) | 23mo | $189,000 | $205 | 27 |
Match score weights: distance 35% · size 25% · config 20% · recency 20%. Top-matched comps best support the ARV.
Projected returns pro-forma
10.0% appreciation · 6.13% rent growth · sell at horizon
- IRR
- 32.7%
- Equity multiple
- 3.59×
- Total profit
- $74,825
- Equity at exit
- $92,791
- IRR
- 29.4%
- Equity multiple
- 8.58×
- Total profit
- $218,695
- Equity at exit
- $200,106
Cash invested: $28,840 (down + closing). Projections, not guarantees.
Landlord ↔ Tenant lean methodology
- Overall (STATE)
- 87 Strongly Landlord-Friendly
- State Texas
- 87 Strongly Landlord-Friendly · R+5
- County
- — inherits STATE
- City
- — inherits STATE
ZIP-level market 78237
- Home prices YoY
- 14.1%
- Rents YoY
- 6.1%
- Active inventory
- 127
- Price-to-rent
- 6.7×
Monthly cashflow live
- Estimated rent
- $1,285 high interval (Pro) →
- Mortgage (P&I)
- −$540
- Tax from tax record
- −$205 /mo · $2,457/yr
- Insurance
- −$43
- HOA
- −$0
- Vacancy / Maint / Mgmt
- −$270
- Net cashflow
- $227
Break-even live
UW: 25.0% down · 7.5% · 30yr · 1.5% tax · 5.0% vac · 8.0% maint · 8.0% mgmt
Financing live
Cash to close
- Down payment
- $25,750
- Closing costs
- $3,090
- Reserves months
- —
- Total cash needed
- —
Loan-product check · same deal, 3 products live
Conventional
25% down · 7.5% · 30yr
- Down + closing
- —
- Monthly P&I
- —
- Monthly cashflow
- —
- DSCR
- —
- Eligible?
- —
Personal DTI + credit; lowest rate.
DSCR
20% down · 8.5% · 30yr
- Down + closing
- —
- Monthly P&I
- —
- Monthly cashflow
- —
- DSCR
- —
- Eligible?
- —
No personal income docs; deal must DSCR.
Hard money
10% down · 12.0% · 12mo
- Down + closing
- —
- Monthly P&I
- —
- Monthly cashflow
- —
- DSCR
- —
- Eligible?
- —
Short-term bridge; refi at stabilization.
Rent comps 11 comps
| Address | Beds | Baths | Sqft | Rent | $/sqft | DOM | Units | Dist |
|---|---|---|---|---|---|---|---|---|
| 2311 Potosi St San Antonio, TX | 3.0 | 1.0 | 864 | $1,600 | $1.85 | 43d | 1 | 0.69mi |
| 1823 San Carlos St San Antonio, TX | 3.0 | 2.0 | 1090 | $1,099 | $1.01 | 2d | 1 | 0.78mi |
| 843 Brady Blvd San Antonio, TX | 3.0 | 2.0 | 864 | $1,650 | $1.91 | 23d | 1 | 0.85mi |
| 2812 Vera Cruz San Antonio, TX | 1.0 | 2.0 | 1060 | $1,200 | $1.13 | 4d | 1 | 0.91mi |
| 2721 Colima St San Antonio, TX | 2.0 | 1.0 | 700 | $1,250 | $1.79 | 14d | 1 | 1.00mi |
| 2003 S Zarzamora St San Antonio, TX | 1.0–4.0 | 1.0–2.0 | 1028 | $1,120 | $1.09 | 23d | 1 | 1.16mi |
| 1938 S Zarzamora St Unit 710 San Antonio, TX | 2.0 | 2.0 | 955 | $1,102 | $1.15 | 3d | 1 | 1.19mi |
| 1938 S Zarzamora St Unit 610 San Antonio, TX | 1.0 | 1.0 | 744 | $915 | $1.23 | 3d | 1 | 1.19mi |
| 3103 Neptune St San Antonio, TX | 3.0 | 2.0 | 1008 | $1,350 | $1.34 | 43d | 1 | 1.35mi |
| 214 Aztec St San Antonio, TX | 3.0 | 2.0 | 973 | $1,275 | $1.31 | 14d | 1 | 1.38mi |
| 319 Noria St San Antonio, TX | 3.0 | 1.0 | 1002 | $1,100 | $1.10 | 23d | 1 | 1.39mi |
Listing history 8 events
-
2026-06-07statusdays on market $103,000 Pending 6 DOM
-
2026-06-04remarks 699-char remark
-
2026-06-04pricestatus $103,000 Price Change 5 DOM
-
2026-06-03days on market $99,000 New 5 DOM
-
2026-06-02days on market $99,000 New 4 DOM
-
2026-06-01days on market $99,000 New 3 DOM
-
2026-05-31remarks 641-char remark
-
2026-05-31$99,000 New 2 DOM
ⓘ Source: listings_history table (triggers on properties + properties_extension) + one-shot
backfill from property_details.listing_events for pre-trigger history.
Tax reassessment forecast TX · Resets to sale price
- Current annual tax
- $2,457 · $205/mo
- Projected year-2 tax
- $2,457 · $205/mo
- Expected delta
- $0/yr ($0/mo · 0.0%)
ⓘ Screening estimate from a state-policy table — verify with the county assessor before closing.
Climate risk First Street
- Flood 1/10 Low FEMA zone X (unshaded) · 0% chance over 30 yrs
- Wildfire 1/10 Low
- Heat 8/10 Severe 7 d/yr ≥109°F today · 22 d/yr by 30 yrs out
- Wind 8/10 Severe 80% chance of damaging wind over 30 yrs
- Air quality 2/10 Low 1 unhealthy d/yr today · 2 by 30 yrs out
Nearby sold comps map
Loading sold comps map…
Walkable amenities ~0.75 mi
Loading nearby amenities…
Taxation est. · year 1
- Rental income
- $15,423
- − Mortgage interest
- −$5,770
- − Property taxes
- −$2,457
- − Insurance
- −$515
- − Repairs & maintenance
- −$1,234
- − Management
- −$1,234
- − Depreciation
- −$2,996
- Taxable income
- $1,217
- Est. tax owed @ 24.0%
- −$292
- After-tax cash flow
- $2,438/yr
For passive investors: Depreciation is non-cash, so a rental often shows a tax loss while cash-flowing — sheltering income. Rental losses are passive: they offset passive income freely, and up to $25,000/yr can offset ordinary (W-2) income if you actively participate and your MAGI is under $100k (phasing out to $0 by $150k); unused losses carry forward. On sale, claimed depreciation is recaptured at up to 25%, and gains may owe capital-gains tax (a 1031 exchange can defer both). Figures are a year-1 estimate at your 24.0% rate — not tax advice; consult a CPA.
Schools (NCES district)
- District
- Edgewood ISD
- NCES district ID
- 4818150
- Math proficiency
- 12% ▼ -18.00%
- Reading proficiency
- 21% ▼ -5.00%
- Median HH income
- $27,419
- Composite
- 12.82/100
- National rank
- #9597
- State rank
- #812 of 826 in TX
Livability — San Antonio
- Score
- 80/100
- State rank
- #31
- US rank
- #1616
Category grades
Schools grade is shown separately in the Schools card above.
Census & demographics
- Census place
- San Antonio, TX
- County
- Bexar County · 1,990,555 people
- City population
- 1,806,925
- Metro
- San Antonio-New Braunfels, TX
- Population (ZIP)
- 37,379
- Household income
- $42,772
- Rent vs Own
- Severe rent burden
- 1185.0
Population outlook (Bexar County) Hauer SSP2
- Today (2025)
- 2,336,851 people
- By 2030
- 2,560,728 · +9.6%
- By 2040
- 3,020,569 · +29.3%
- By 2050
- 3,493,522 · +49.5%
- By 2075
- 4,668,459 · +99.8%
- By 2100
- 5,533,242 · +136.8%
Race, ethnicity, and origin ACS 2023
- Neighborhood character
- Predominantly Hispanic (95%)
- Race & ethnicity
- Hispanic / Latino 95% Two or more races 50% White 3% Native American 2% Black 2%
- Hispanic origin (detail)
- Mexican 84%
- Foreign-born
- 18% · Canada
- Languages at home
- 34% English-only · Spanish 66%
Political lean MEDSL · Bexar
- 2024 margin
- Lean D (+9.8) · D 54.3% · R 44.6% · Other 1.1%
- 2008→2024 swing
- +4.2pp toward D · 2008: 5.6pp · 2024: 9.8pp
- All cycles
- 2024: D+9.8 2020: D+18.2 2016: D+13.5 2012: D+4.6 2008: D+5.6
Not yet ingested
- Civics
- —
Market trends
- HPI YoY
- ▲ 30.52%
- Current HPI
- 247.7257
- Rent YoY
- ▲ 6.13%
- Metro
- San Antonio-New Braunfels, TX
- State GDP YoY
- ▲ 3.95%
- F500 in state
- 110
Industry mix (Fortune 500 HQ in TX)
| Industry | F500 HQs | Revenue |
|---|---|---|
| Energy | 16 | $1,198B |
|
||
| Technology | 5 | $198B |
|
||
| Engineering / Construction | 4 | $72B |
|
||
| Energy Services | 3 | $60B |
|
||
| Utilities | 3 | $41B |
|
||
| Healthcare | 2 | $330B |
|
||
Price history
-40.0% since first listed7 events — show timeline
- 2026-05-29 Listed $99,000 LERA
- 2026-03-20 Listing Removed — LERA
- 2025-06-14 Price Changed $154,900 LERA
- 2025-03-23 Listed $164,900 LERA
- 2025-01-29 Sold (Public Records) — Public Records
- 1999-12-13 Sold (Public Records) — Public Records
- 1981-09-01 Sold (Public Records) — Public Records
Property tax history
+6.9%/yrLatest (2025): $2,457 · -7.3% YoY. Source: county tax records.
Cash-flow waterfall
monthlySold comps — $/sqft
last 12 mo · ≤1 miLoading sold comps…