 🏷️ Likely Rental
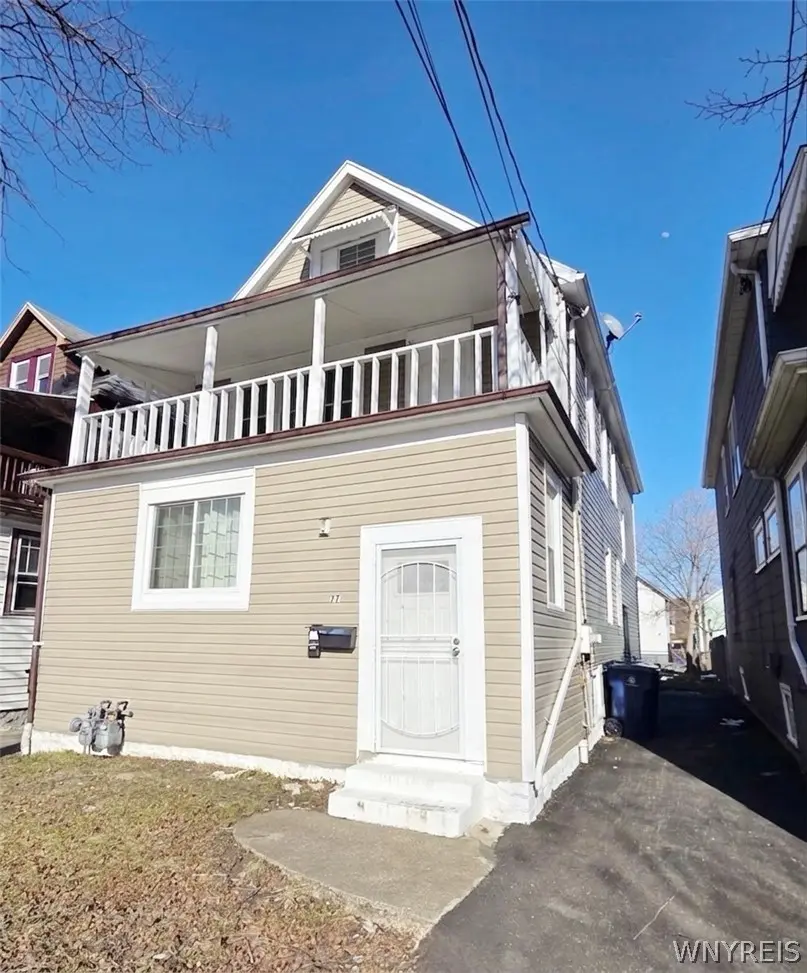
77 Clarence Ave · Buffalo, NY
Flood risk 1/10 · Minimal
- FEMA flood zone
- X (unshaded)
- Chance of flooding over 30 yrs
- 0.0%
- Est. flood insurance / yr
- $473 – $860
Fire risk 1/10 · Minimal
- Est. fire insurance / yr
- $691 – $1,283
Heat risk 3/10 · Minor
- Hot days now (above 93°F)
- 7 days/yr
- Hot days in 30 yrs
- 15 days/yr
Wind risk 1/10 · Minimal
- Chance of severe wind over 30 yrs
- —
Air-quality risk 3/10 · Minor
- Unhealthy air days now
- 2 days/yr
- Unhealthy air days in 30 yrs
- 3 days/yr
Risk factors via First Street. Map © Google.
Why this score? — see what drove the B+ grade
The composite is a weighted blend of 9 inputs, each scored 0–100. Each bar is that input's sub-score; the figure is the points it added to the 100-point composite (weight × sub-score).
- Cash flow +30.0/30.0
- ARV discount +15.0/15.0
- DSCR +10.0/10.0
- 1% rule +9.1/10.0
- Livability +3.9/5.0
- Schools +3.3/10.0
- Rent growth +2.7/5.0
- Condition / age +2.5/5.0
- Appreciation +0.0/10.0
$179,900
🖨 Deal sheet 📄 Offer letter ✓ Due diligence
Multi-family units
County records classify this as Multi-Family (2-4 Unit). Listing-text estimate: 2 units. confirmed
Listing remarks MLS
Nestled in a family-friendly neighborhood, this completely overhauled 2-family home offers both comfort and versatility. The property features a welcoming balcony perfect for outdoor enjoyment and a full basement for additional storage. The home has been recently revitalized with fresh paint, some new flooring, a new driveway built in 2025, and a newer roof, enhancing both its appeal and long-term value. Both units offer separate utilities, including two electric meters and two gas meters. The lower unit includes 2 bedrooms, a living room, dining room, kitchen, and 1 full bathroom. The upper unit features 2 bedrooms, a dining area with living room, kitchen, and a full bathroom. The upper unit is currently vacant, while the lower unit is tenant-occupied. The full attic is partially finished, with 2 additional bedrooms ideal for extended living accommodations. This property presents an excellent opportunity for investors seeking passive income as well as homeowners looking for comfort, convenience, and adaptability. Close to major amenities, shops, and transportation, this home is perfectly situated for everyday living. Don’t miss out on this exceptional opportunity in Buffalo.
Key facts
- 3,360 sq ft lot
- 2 garage spots
- Built 1921
Neighborhood map
What this means for you Summary
Snapshot
- This is a 2 × 2-bed/1.0-bath units multifamily listed at $180k.
Deal economics
- At list price, monthly cash flow is $754 ($9k/yr) — positive. Per door: $377/mo.
- The deal already cash-flows at list — no discount required.
- Meets the 1% rule at list price ($3k rent vs $180k).
- Recommended offer: $169k (6.0% below list) — sets the bar for market timing.
- Cap rate 11.3% vs local median 8.0% in Buffalo — top-decile yield for the area; either an underpriced asset or a hidden risk that comps aren't pricing in. Stress-test before assuming the spread holds.
Location & tenants
- Location reads 77/100 on livability (#195 in NY, #3,011 nationally) — a middle-class / working-renter tenant base. Strengths: commute A+, housing A+, health & safety A+; Watch: crime F, employment D-.
- Buffalo City School District (urban): math 41% / reading 40% proficiency, ranked #535 of 590 in NY (top 91%) — families likely to look elsewhere, expect single-tenant / working-renter base with shorter leases; 75% free/reduced lunch — lower-income household profile, screen leases tightly.
- Market conditions: Rents flat; 237 active listings in the ZIP; 17 comparable units currently listed for rent nearby; rentals at typical pace (median 14d on market — plan ~3-4 weeks tenant-placement turnaround); lower-income renter base — watch delinquency; 1,244 units permitted in Erie County in 2024 (563 in 5+ unit buildings).
- At $2,528/mo this rent would consume 67% of the median local household income ($45k/yr) (locally 2873% of renters already pay >50% of income on rent) — very limited rent-growth headroom before tenants either downsize or default.
Forward outlook
- Local home prices are declining (-3.0%/yr); year-one equity from $1k of loan paydown is wiped out by about $5k of value loss. Plan a longer hold.
- At projected returns (-3.0% appreciation + 0.7% rent growth), your $50k cash investment doubles in ~9 years — after that, you're playing with house money.
Negotiation context
- It's been on market 71 days — a 6% lower offer ($169k) is reasonable based on typical stale-listing flexibility.
- 2 sale attempts since 7y ago with the ask held roughly flat each time — persistent listings suggest the price (not the market) is what's stuck; bring a comps-based counter.
- Current owner paid $50k; list at $180k implies a 260% gain — meaningful room to come down on a strong offer.
Risks & watch-outs
- Watch-outs: built in 1921 — expect roof / HVAC / electrical / plumbing capex.
Questions for the listing agent
- It's been on market 71 days. Have you received any prior offers? Is the seller open to a 6% concession, seller financing, or rate buy-down credit?
- Can we see the unit-by-unit rent roll, current vacancy, and any below-market leases? What's the average tenancy length?
- What capital expenditures (roof, boiler, parking lot, exteriors) have been made in the last 5 years, and what's planned in the next 2?
- Built in 1921 — when were the roof, HVAC, electrical panel, plumbing, and water heater last replaced?
- Why hasn't it sold? Are there any deal-killer items the seller is aware of (foundation, flood, title, zoning, code violations)?
- Is there a deadline driving the sale (1031 exchange, divorce, estate, relocation)? That informs how much negotiation room exists.
- Crime grade is F in this area — have there been break-ins, vandalism, or insurance claims at this property in the last 3 years? What carrier currently insures it and at what premium?
- What's the average days-on-market for RENTAL listings here right now (not sales)? A rising rental-DOM trend means longer vacancies and softer asking-rent achievability than the comps imply.
- What's the recent tenant-quality profile in this submarket — average credit score on applications, eviction rate, late-payment / NSF rate, and stable-employment percentage? A property-management company in the area should have these aggregated.
- How much new apartment / multifamily construction is in the pipeline within 1–3 miles? Heavy new supply (>2% of stock underway) typically softens rents 12–24 months out; light construction supports rent growth.
Investment metrics
- 1% rule
- 1.41% ✓
- Cap rate
- 11.32%
- Cash-on-cash
- 17.96%
- DSCR
- 1.80
- GRM
- 5.9
CMA / ARV
- ARV (median comp)
- $251,402
- List price
- $179,900
- Delta
- -28.44%
- Verdict
- UNDERPRICED
- Comps
- 20 within 1.0 mi
Show comp detail 12 sales within ~0.75 mi
| Address | Dist | Beds/Ba | Sqft | Sold | Price | $/sf | Match |
|---|---|---|---|---|---|---|---|
| 132 Hewitt Ave | 0.45mi | 4/2.0 | 1,946 (+0%) | 5mo | $125,000 | $64 | 74 |
| 88 Marigold Ave | 0.37mi | 4/2.0 | 1,960 (+1%) | 8mo | $210,000 | $107 | 74 |
| 44 Freeman St | 0.36mi | 4/2.0 | 2,182 (+13%) | 9mo | $144,000 | $66 | 55 |
| 475 Norfolk Ave | 0.61mi | 4/2.0 | 2,068 (+7%) | 8mo | $105,000 | $51 | 53 |
| 329 Jewett Ave | 0.53mi | 4/4.0 | 2,053 (+6%) | 8mo | $165,000 | $80 | 51 |
| 19 Dunlop Ave | 0.45mi | 5/2.0 (+1) | 2,160 (+12%) | 6mo | $160,000 | $74 | 50 |
| 18 Phyllis Ave | 0.49mi | 5/2.0 (+1) | 2,134 (+10%) | 8mo | $138,000 | $65 | 49 |
| 35 Erskine Ave | 0.74mi | 4/2.0 | 2,135 (+10%) | 4mo | $170,000 | $80 | 45 |
| 80 Lasalle Ave | 0.74mi | 4/2.0 | 1,778 (-8%) | 9mo | $170,000 | $96 | 45 |
| 213 Jewett Ave | 0.73mi | 4/2.0 | 2,154 (+11%) | 3mo | $116,000 | $54 | 45 |
| 96 Sussex St | 0.65mi | 5/2.0 (+1) | 2,152 (+11%) | 4mo | $255,000 | $118 | 43 |
| 314 Lasalle Ave | 0.66mi | 4/2.0 | 1,675 (-14%) | 8mo | $170,000 | $101 | 40 |
Match score weights: distance 35% · size 25% · config 20% · recency 20%. Top-matched comps best support the ARV.
Projected returns pro-forma
-3.0% appreciation · 0.67% rent growth · sell at horizon
- IRR
- 6.9%
- Equity multiple
- 1.26×
- Total profit
- $13,109
- Equity at exit
- $26,824
- IRR
- 14.0%
- Equity multiple
- 2.01×
- Total profit
- $50,714
- Equity at exit
- $15,554
Cash invested: $50,372 (down + closing). Projections, not guarantees.
Landlord ↔ Tenant lean methodology
- Overall (STATE)
- 15 Strongly Tenant-Friendly
- State New York
- 15 Strongly Tenant-Friendly · D+10
- County
- — inherits STATE
- City
- — inherits STATE
ZIP-level market 14215
- Home prices YoY
- -30.0%
- Rents YoY
- 0.7%
- Active inventory
- 237
- Price-to-rent
- 11.9×
Monthly cashflow live
- Estimated rent
- $2,528 high interval (Pro) →
- Mortgage (P&I)
- −$943
- Tax est. 1.5%
- −$225 /mo · $2,698/yr
- Insurance
- −$75
- HOA
- −$0
- Vacancy / Maint / Mgmt
- −$531
- Net cashflow
- $754
Break-even live
2-unit breakdown (identical units grouped — click to expand)
| Units | Beds | Baths | Est. rent |
|---|---|---|---|
| 2× units | 2 | 1 | $2,528 |
| #1 | 2 | 1 | $1,264 |
| #2 | 2 | 1 | $1,264 |
| Total (2 units) | $2,528 | ||
UW: 25.0% down · 7.5% · 30yr · 1.5% tax · 5.0% vac · 8.0% maint · 8.0% mgmt
Financing live
Cash to close
- Down payment
- $44,975
- Closing costs
- $5,397
- Reserves months
- —
- Total cash needed
- —
Loan-product check · same deal, 3 products live
Conventional
25% down · 7.5% · 30yr
- Down + closing
- —
- Monthly P&I
- —
- Monthly cashflow
- —
- DSCR
- —
- Eligible?
- —
Personal DTI + credit; lowest rate.
DSCR
20% down · 8.5% · 30yr
- Down + closing
- —
- Monthly P&I
- —
- Monthly cashflow
- —
- DSCR
- —
- Eligible?
- —
No personal income docs; deal must DSCR.
Hard money
10% down · 12.0% · 12mo
- Down + closing
- —
- Monthly P&I
- —
- Monthly cashflow
- —
- DSCR
- —
- Eligible?
- —
Short-term bridge; refi at stabilization.
Rent comps 17 comps
| Address | Beds | Baths | Sqft | Rent | $/sqft | DOM | Units | Dist |
|---|---|---|---|---|---|---|---|---|
| 25 Parkridge Ave Buffalo, NY | 3.0 | 1.0 | 1914 | $1,350 | $0.71 | 14d | 1 | 0.04mi |
| 263 Minnesota Ave Unit Upper Buffalo, NY | 3.0 | 1.0 | 1242 | $1,500 | $1.21 | 14d | 1 | 0.71mi |
| 89 Lasalle Ave Buffalo, NY | 1.0–4.0 | 1.0–4.0 | 1024 | $2,997 | $2.93 | 1d | 10 | 0.72mi |
| 175 Lisbon Ave Buffalo, NY | 5.0 | 2.0 | 2000 | $2,500 | $1.25 | 14d | 1 | 0.79mi |
| 222 Lisbon Ave Unit Upper Buffalo, NY | 3.0 | 1.0 | 1400 | $1,400 | $1.00 | 43d | 1 | 0.82mi |
| 222 Lisbon Ave Buffalo, NY | 4.0 | 1.0 | 1300 | $1,400 | $1.08 | 23d | 1 | 0.82mi |
| 59 Lisbon Ave Buffalo, NY | 3.0 | 1.0 | 2521 | $1,250 | $0.50 | 23d | 1 | 0.86mi |
| 85 Highgate Ave Buffalo, NY | 5.0 | 2.0 | 2193 | $3,750 | $1.71 | 14d | 1 | 0.89mi |
| 65 Northrup Pl Buffalo, NY | 5.0 | 2.0 | 1467 | $2,500 | $1.70 | 14d | 1 | 0.95mi |
| 24 Custer St Buffalo, NY | 5.0 | 2.0 | 2500 | $3,000 | $1.20 | 14d | 1 | 1.01mi |
| 60 Englewood Ave Buffalo, NY | 4.0 | 1.0 | 1400 | $1,650 | $1.18 | 1d | 1 | 1.25mi |
| 102 Englewood Ave Buffalo, NY | 4.0 | 1.0 | 2426 | $2,750 | $1.13 | 1d | 1 | 1.30mi |
| 91 Englewood Ave Buffalo, NY | 4.0 | 1.0 | 2500 | $2,000 | $0.80 | 1d | 1 | 1.31mi |
| 202 Summit Ave Unit 1 Buffalo, NY | 3.0 | 1.0 | 2000 | $2,400 | $1.20 | 23d | 1 | 1.32mi |
| 163 Carmel Rd Buffalo, NY | 3.0 | 1.0 | 1400 | $1,800 | $1.29 | 2d | 1 | 1.36mi |
| 63 Montrose Ave Buffalo, NY | 4.0 | 1.0 | 2240 | $2,000 | $0.89 | 1d | 1 | 1.40mi |
| 196 Englewood Ave Buffalo, NY | 5.0 | 1.5 | 2560 | $2,000 | $0.78 | 1d | 1 | 1.43mi |
Listing history 20 events
-
2026-06-18days on market $179,900 Active 71 DOM
-
2026-06-17days on market $179,900 Active 70 DOM
-
2026-06-16days on market $179,900 Active 69 DOM
-
2026-06-15days on market $179,900 Active 68 DOM
-
2026-06-13days on market $179,900 Active 66 DOM
-
2026-06-13days on market $179,900 Active 65 DOM
-
2026-06-10days on market $179,900 Active 63 DOM
-
2026-06-09days on market $179,900 Active 62 DOM
-
2026-06-08days on market $179,900 Active 61 DOM
-
2026-06-07days on market $179,900 Active 60 DOM
-
2026-06-03days on market $179,900 Active 56 DOM
-
2026-06-02days on market $179,900 Active 55 DOM
-
2026-06-01days on market $179,900 Active 54 DOM
-
2026-05-31days on market $179,900 Active 53 DOM
-
2026-04-08$179,900 Active 1201-char remark
Show marketing remark (1201 chars)
Nestled in a family-friendly neighborhood, this completely overhauled 2-family home offers both comfort and versatility. The property features a welcoming balcony perfect for outdoor enjoyment and a full basement for additional storage. The home has been recently revitalized with fresh paint, some new flooring, a new driveway built in 2025, and a newer roof, enhancing both its appeal and long-term value. Both units offer separate utilities, including two electric meters and two gas meters. The lower unit includes 2 bedrooms, a living room, dining room, kitchen, and 1 full bathroom. The upper unit features 2 bedrooms, a dining area with living room, kitchen, and a full bathroom. The upper unit is currently vacant, while the lower unit is tenant-occupied. The full attic is partially finished, with 2 additional bedrooms ideal for extended living accommodations. This property presents an excellent opportunity for investors seeking passive income as well as homeowners looking for comfort, convenience, and adaptability. Close to major amenities, shops, and transportation, this home is perfectly situated for everyday living. Don’t miss out on this exceptional opportunity in Buffalo.
-
2019-11-12soldstatus $50,000
-
2019-09-30historical
-
2019-08-28price $104,900
-
2019-08-06$109,900 Active
-
1995-07-19soldstatus $41,692
ⓘ Source: listings_history table (triggers on properties + properties_extension) + one-shot
backfill from property_details.listing_events for pre-trigger history.
Climate risk First Street
- Flood 1/10 Low FEMA zone X (unshaded) · 0% chance over 30 yrs
- Wildfire 1/10 Low
- Heat 3/10 Moderate 7 d/yr ≥93°F today · 15 d/yr by 30 yrs out
- Wind 1/10 Low
- Air quality 3/10 Moderate 2 unhealthy d/yr today · 3 by 30 yrs out
Nearby sold comps map
Loading sold comps map…
Walkable amenities ~0.75 mi
Loading nearby amenities…
Taxation est. · year 1
- Rental income
- $30,336
- − Mortgage interest
- −$10,077
- − Property taxes
- −$2,698
- − Insurance
- −$900
- − Repairs & maintenance
- −$2,427
- − Management
- −$2,427
- − Depreciation
- −$5,233
- Taxable income
- $6,574
- Est. tax owed @ 24.0%
- −$1,578
- After-tax cash flow
- $7,469/yr
For passive investors: Depreciation is non-cash, so a rental often shows a tax loss while cash-flowing — sheltering income. Rental losses are passive: they offset passive income freely, and up to $25,000/yr can offset ordinary (W-2) income if you actively participate and your MAGI is under $100k (phasing out to $0 by $150k); unused losses carry forward. On sale, claimed depreciation is recaptured at up to 25%, and gains may owe capital-gains tax (a 1031 exchange can defer both). Figures are a year-1 estimate at your 24.0% rate — not tax advice; consult a CPA.
Schools (NCES district)
- District
- Buffalo City School District
- NCES district ID
- 3605850
- Math proficiency
- 41% ▲ 11.00%
- Reading proficiency
- 40% ▲ 7.00%
- Median HH income
- $31,665
- Composite
- 33.17/100
- National rank
- #5544
- State rank
- #535 of 590 in NY
Livability — Buffalo
- Score
- 77/100
- State rank
- #195
- US rank
- #3011
Category grades
Schools grade is shown separately in the Schools card above.
Census & demographics
- Census place
- Buffalo, NY
- County
- Erie County · 714,559 people
- City population
- 440,021
- Metro
- Buffalo-Cheektowaga, NY
- Population (ZIP)
- 42,524
- Household income
- $44,955
- Rent vs Own
- Severe rent burden
- 2873.0
Population outlook (Erie County) Hauer SSP2
- Today (2025)
- 933,037 people
- By 2030
- 935,181 · +0.2%
- By 2040
- 928,531 · -0.5%
- By 2050
- 905,725 · -2.9%
- By 2075
- 834,037 · -10.6%
- By 2100
- 708,033 · -24.1%
Race, ethnicity, and origin ACS 2023
- Neighborhood character
- Predominantly Black (67%)
- Race & ethnicity
- Black 67% White 15% Asian 7% Hispanic / Latino 6% Two or more races 6%
- Hispanic origin (detail)
- Puerto Rican 4%
- Common ancestry
- Romanian 4% Lithuanian 1% Italian 1%
- Foreign-born
- 9% · Canada, China
- Languages at home
- 88% English-only · Other Indo-European 4% Spanish 4% Chinese 1%
Political lean MEDSL · Erie
- 2024 margin
- Lean D (+9.7) · D 54.8% · R 45.2%
- 2008→2024 swing
- -7.9pp toward R · 2008: 17.5pp · 2024: 9.7pp
- All cycles
- 2024: D+9.7 2020: D+14.7 2016: D+4.8 2012: D+15.6 2008: D+17.5
Not yet ingested
- Civics
- —
Market trends
- HPI YoY
- ▼ -126.29%
- Current HPI
- 295.2966
- Rent YoY
- ▲ 0.67%
- Metro
- Buffalo-Cheektowaga, NY
- State GDP YoY
- ▲ 2.60%
- F500 in state
- 92
Industry mix (Fortune 500 HQ in NY)
| Industry | F500 HQs | Revenue |
|---|---|---|
| Financial Services | 10 | $950B |
|
||
| Consumer Goods | 9 | $162B |
|
||
| Insurance | 4 | $225B |
|
||
| Telecommunications | 2 | $144B |
|
||
| Pharmaceuticals | 2 | $112B |
|
||
| Media / Entertainment | 2 | $69B |
|
||
Price history
+331.5% since first listed6 events — show timeline
- 2026-04-08 Listed $179,900 WNYREIS
- 2019-11-12 Sold (Public Records) $50,000 Public Records
- 2019-09-30 Listing Removed — WNYREIS
- 2019-08-28 Price Changed $104,900 WNYREIS
- 2019-08-06 Listed $109,900 WNYREIS
- 1995-07-19 Sold (Public Records) $41,692 Public Records
Property tax history
+10.9%/yrLatest (2025): $252 · +0.0% YoY. Source: county tax records.
Cash-flow waterfall
monthlySold comps — $/sqft
last 12 mo · ≤1 miLoading sold comps…