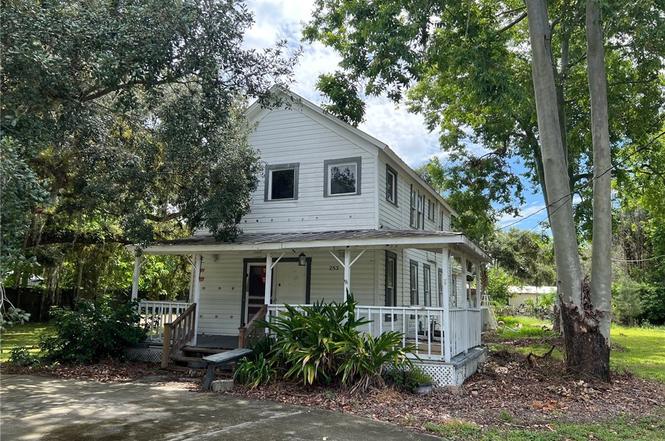
253 S Cypress St · LaBelle, FL
Flood risk 1/10 · Minimal
- FEMA flood zone
- X (unshaded)
- Chance of flooding over 30 yrs
- 0.0%
- Est. flood insurance / yr
- $507 – $1,088
Fire risk 2/10 · Minimal
- Est. fire insurance / yr
- $947 – $1,759
Heat risk 9/10 · Severe
- Hot days now (above 108°F)
- 7 days/yr
- Hot days in 30 yrs
- 25 days/yr
Wind risk 10/10 · Severe
- Chance of severe wind over 30 yrs
- 99.0%
Air-quality risk 2/10 · Minimal
- Unhealthy air days now
- 2 days/yr
- Unhealthy air days in 30 yrs
- 2 days/yr
Risk factors via First Street. Map © Google.
Why this score? — see what drove the A- grade
The composite is a weighted blend of 9 inputs, each scored 0–100. Each bar is that input's sub-score; the figure is the points it added to the 100-point composite (weight × sub-score).
- Cash flow +30.0/30.0
- ARV discount +15.0/15.0
- DSCR +10.0/10.0
- Appreciation +10.0/10.0
- 1% rule +8.2/10.0
- Livability +3.6/5.0
- Schools +3.1/10.0
- Rent growth +2.5/5.0
- Condition / age +2.5/5.0
$160,000
🖨 Deal sheet 📄 Offer letter ✓ Due diligence
Listing remarks MLS
Two story "Old Florida" home on . 64+/- acres in the city of LaBelle with beautiful trees!! Freshly painted on the outside, the home has both a front and back porch and features three bedrooms and two bathrooms. Also additional rooms that can be used for an office or playroom. Call today for your viewing appointment. This house will not meet lender requirements, cash only offers.
Key facts
- Metal roof
- Front porch
- Solid foundation
Tags
Property features AI
Finance
- Financial info: Pets allowed
- HOA & community: No association fee
Exterior
- Utilities: Public water; Septic tank sewer; Cable available
- Home design: 2 stories; Entry level: ground floor; Faces west; Resale property
- Construction: Wood siding and wood frame construction; Metal roof
- Exterior features: Open porch; No other exterior features listed; Oversized lot; East exposure
Interior
- Kitchen: Range; Refrigerator
- Flooring: Tile; Vinyl
- Bathrooms: 2 full bathrooms
- Heating & cooling: Central heating (electric); Window unit heating; Central air conditioning (electric); Window unit air conditioning
- Interior features: Unfurnished; Living/dining room; Pantry; Separate shower (shower only)
Neighborhood map
What this means for you Summary
Snapshot
- This is a 3-bed/2.0-bath single-family listed at $160k.
Deal economics
- At list price, monthly cash flow is $649 ($8k/yr) — positive.
- The deal already cash-flows at list — no discount required.
- Meets the 1% rule at list price ($2k rent vs $160k).
- Recommended offer: $141k (12.0% below list) — sets the bar for market timing.
- Cap rate 11.2% vs local median 4.8% in LaBelle — top-decile yield for the area; either an underpriced asset or a hidden risk that comps aren't pricing in. Stress-test before assuming the spread holds.
Location & tenants
- Location reads 72/100 on livability (#324 in FL) — a middle-class / working-renter tenant base. Strengths: cost of living A+, housing A+, health & safety A+; Watch: schools C-, commute F, employment F.
- Hendry (town): math 35% / reading 40% proficiency, ranked #65 of 73 in FL (top 89%) — families likely to look elsewhere, expect single-tenant / working-renter base with shorter leases; 75% free/reduced lunch — lower-income household profile, screen leases tightly.
- Market conditions: 942 active listings in the ZIP; 7 comparable units currently listed for rent nearby; rentals at typical pace (median 24d on market — plan ~3-4 weeks tenant-placement turnaround); 557 units permitted in Hendry County in 2024 (45 in 5+ unit buildings).
Forward outlook
- In year one you build about $17k of equity ($1k loan paydown + $16k appreciation (10.0% local appreciation)).
- Hendry County population projected to shrink 7% by 2050 — rents likely to lag national; underwrite the cash flow, not the appreciation.
- At projected returns (10.0% appreciation + 3.0% rent growth), your $45k cash investment doubles in ~2 years — after that, you're playing with house money.
- By year 3, paydown + projected appreciation supports a ~$43k cash-out refi (75% LTV) — recoverable capital for the next deal without selling this one.
Negotiation context
- It's been on market 131 days — a 12% lower offer ($141k) is reasonable based on typical stale-listing flexibility.
- 4 sale attempts since 15y ago; this cycle's ask has dropped $39k (20%) from the opening price — seller is motivated, your offer sets the floor, not the list.
- Current owner paid $125k; 28% above their basis — modest negotiation headroom, anchor on the comps not their cost.
Risks & watch-outs
- Watch-outs: built in 1930 — expect roof / HVAC / electrical / plumbing capex.
- Climate carrying-cost: severe wind risk, 99% chance of damaging wind over 30y; extreme-heat days projected 7→25/yr by 2055 (HVAC capex compounding) — expect insurance premiums to compound above CPI over the hold.
Questions for the listing agent
- It's been on market 131 days. Have you received any prior offers? Is the seller open to a 12% concession, seller financing, or rate buy-down credit?
- Built in 1930 — when were the roof, HVAC, electrical panel, plumbing, and water heater last replaced?
- Why hasn't it sold? Are there any deal-killer items the seller is aware of (foundation, flood, title, zoning, code violations)?
- Is there a deadline driving the sale (1031 exchange, divorce, estate, relocation)? That informs how much negotiation room exists.
- What's the average days-on-market for RENTAL listings here right now (not sales)? A rising rental-DOM trend means longer vacancies and softer asking-rent achievability than the comps imply.
- What's the recent tenant-quality profile in this submarket — average credit score on applications, eviction rate, late-payment / NSF rate, and stable-employment percentage? A property-management company in the area should have these aggregated.
- How much new for-sale + rental construction is in the pipeline within 1–3 miles? Heavy new supply typically softens prices + rents 12–24 months out; constrained supply supports both.
Investment metrics
- 1% rule
- 1.32% ✓
- Cap rate
- 11.16%
- Cash-on-cash
- 17.39%
- DSCR
- 1.77
- GRM
- 6.3
CMA / ARV
- ARV (on-the-fly)
- $313,622
- Comps found
- 6
Show comp detail 6 sales within ~0.75 mi
| Address | Dist | Beds/Ba | Sqft | Sold | Price | $/sf | Match |
|---|---|---|---|---|---|---|---|
| 420 Grant St | 0.37mi | 3/2.0 | 1,780 (+8%) | 1mo | $225,000 | $126 | 68 |
| 8034 Grove Ct | 0.28mi | 3/2.0 | 1,565 (-5%) | 17mo | $289,000 | $185 | 65 |
| 450 Grant St | 0.39mi | 4/2.0 (+1) | 1,595 (-3%) | 13mo | $305,000 | $191 | 62 |
| 220 N Cypress St | 0.49mi | 3/2.0 | 1,753 (+7%) | 9mo | $369,000 | $210 | 58 |
| 251 S Hall St | 0.71mi | 3/2.0 | 1,648 (+0%) | 22mo | $255,000 | $155 | 48 |
| 270 Ford Ave | 0.49mi | 3/2.0 | 1,464 (-11%) | 14mo | $385,000 | $263 | 48 |
Match score weights: distance 35% · size 25% · config 20% · recency 20%. Top-matched comps best support the ARV.
Projected returns pro-forma
10.0% appreciation · 3.0% rent growth · sell at horizon
- IRR
- 37.2%
- Equity multiple
- 3.87×
- Total profit
- $128,478
- Equity at exit
- $144,141
- IRR
- 32.0%
- Equity multiple
- 8.72×
- Total profit
- $345,782
- Equity at exit
- $310,845
Cash invested: $44,800 (down + closing). Projections, not guarantees.
Landlord ↔ Tenant lean methodology
- Overall (STATE)
- 87 Strongly Landlord-Friendly
- State Florida
- 87 Strongly Landlord-Friendly · R+3
- County
- — inherits STATE
- City
- — inherits STATE
ZIP-level market 33935
- Home prices YoY
- 16.3%
- Active inventory
- 942
- Price-to-rent
- 6.3×
Monthly cashflow live
- Estimated rent
- $2,114 high interval (Pro) →
- Mortgage (P&I)
- −$839
- Tax from tax record
- −$115 /mo · $1,376/yr
- Insurance
- −$67
- HOA
- −$0
- Vacancy / Maint / Mgmt
- −$444
- Net cashflow
- $649
Break-even live
UW: 25.0% down · 7.5% · 30yr · 1.5% tax · 5.0% vac · 8.0% maint · 8.0% mgmt
Financing live
Cash to close
- Down payment
- $40,000
- Closing costs
- $4,800
- Reserves months
- —
- Total cash needed
- —
Loan-product check · same deal, 3 products live
Conventional
25% down · 7.5% · 30yr
- Down + closing
- —
- Monthly P&I
- —
- Monthly cashflow
- —
- DSCR
- —
- Eligible?
- —
Personal DTI + credit; lowest rate.
DSCR
20% down · 8.5% · 30yr
- Down + closing
- —
- Monthly P&I
- —
- Monthly cashflow
- —
- DSCR
- —
- Eligible?
- —
No personal income docs; deal must DSCR.
Hard money
10% down · 12.0% · 12mo
- Down + closing
- —
- Monthly P&I
- —
- Monthly cashflow
- —
- DSCR
- —
- Eligible?
- —
Short-term bridge; refi at stabilization.
Rent comps 7 comps
| Address | Beds | Baths | Sqft | Rent | $/sqft | DOM | Units | Dist |
|---|---|---|---|---|---|---|---|---|
| 184 Village Cir Labelle, FL | 2.0 | 2.0 | 1239 | $2,000 | $1.61 | 3d | 1 | 0.43mi |
| 174 Village Cir Labelle, FL | 2.0 | 2.0 | 1224 | $1,600 | $1.31 | 23d | 1 | 0.44mi |
| 335 4th Ave Labelle, FL | 3.0 | 2.0 | 1710 | $2,000 | $1.17 | 23d | 1 | 0.95mi |
| 1092 Riverbend Dr Labelle, FL | 2.0 | 2.5 | 2100 | $2,900 | $1.38 | 21d | 1 | 0.96mi |
| 343 3rd Ave Labelle, FL | 3.0 | 2.0 | 1050 | $1,400 | $1.33 | 23d | 1 | 0.97mi |
| 345 3rd Ave LaBelle, FL | 3.0 | 2.0 | 1050 | $1,400 | $1.33 | 23d | 1 | 0.97mi |
| 3020 N Lakewood Rd Labelle, FL | 4.0 | 2.0 | 1499 | $1,950 | $1.30 | 23d | 1 | 0.99mi |
Listing history 35 events
-
2026-06-18days on market $160,000 Active 131 DOM
-
2026-06-17days on market $160,000 Active 130 DOM
-
2026-06-16days on market $160,000 Active 129 DOM
-
2026-06-15days on market $160,000 Active 128 DOM
-
2026-06-13days on market $160,000 Active 126 DOM
-
2026-06-13days on market $160,000 Active 125 DOM
-
2026-06-10days on market $160,000 Active 123 DOM
-
2026-06-09days on market $160,000 Active 122 DOM
-
2026-06-08days on market $160,000 Active 121 DOM
-
2026-06-07pricestatusdays on market $160,000 Active 120 DOM
-
2026-06-02status $165,000 Pending 118 DOM
-
2026-06-01days on market $165,000 Active 118 DOM
-
2026-05-31days on market $165,000 Active 117 DOM
-
2026-05-21price $165,000
-
2026-04-21price $170,000
-
2026-03-12price $175,000
-
2026-02-03$199,000 Active
-
2026-01-25historical
-
2026-01-05price $215,000
-
2025-11-13price $230,000
-
2025-09-02price $250,000
-
2025-07-25$260,000 Active
-
2018-05-22soldstatus $125,000
-
2016-04-26soldstatus $76,900
-
2016-04-25soldstatus $76,900 Sold 392-char remark
Show marketing remark (392 chars)
Two story "Old Florida" home on . 64+/- acres in the city of LaBelle with beautiful trees!! Freshly painted on the outside, the home has both a front and back porch and features three bedrooms and two bathrooms. Also additional rooms that can be used for an office or playroom. Call today for your viewing appointment. This house will not meet lender requirements, cash only offers.
-
2016-04-08status Pending 392-char remark
Show marketing remark (392 chars)
Two story "Old Florida" home on . 64+/- acres in the city of LaBelle with beautiful trees!! Freshly painted on the outside, the home has both a front and back porch and features three bedrooms and two bathrooms. Also additional rooms that can be used for an office or playroom. Call today for your viewing appointment. This house will not meet lender requirements, cash only offers.
-
2016-04-05$76,900 Active 392-char remark
Show marketing remark (392 chars)
Two story "Old Florida" home on . 64+/- acres in the city of LaBelle with beautiful trees!! Freshly painted on the outside, the home has both a front and back porch and features three bedrooms and two bathrooms. Also additional rooms that can be used for an office or playroom. Call today for your viewing appointment. This house will not meet lender requirements, cash only offers.
-
2012-10-26soldstatus $30,500
-
2012-10-26soldstatus $30,500
-
2012-01-06price $39,900
-
2011-02-09$39,900
-
2005-07-18soldstatus $70,000
-
2001-11-20soldstatus $40,000
-
2001-11-20soldstatus $40,000
-
2000-04-03soldstatus $20,000
ⓘ Source: listings_history table (triggers on properties + properties_extension) + one-shot
backfill from property_details.listing_events for pre-trigger history.
Tax reassessment forecast FL · Resets to sale price
- Current annual tax
- $1,376 · $115/mo
- Projected year-2 tax
- $1,376 · $115/mo
- Expected delta
- $0/yr ($0/mo · 0.0%)
ⓘ Screening estimate from a state-policy table — verify with the county assessor before closing.
Climate risk First Street
- Flood 1/10 Low FEMA zone X (unshaded) · 0% chance over 30 yrs
- Wildfire 2/10 Low
- Heat 9/10 Extreme 7 d/yr ≥108°F today · 25 d/yr by 30 yrs out
- Wind 10/10 Extreme 99% chance of damaging wind over 30 yrs
- Air quality 2/10 Low 2 unhealthy d/yr today · 2 by 30 yrs out
Nearby sold comps map
Loading sold comps map…
Walkable amenities ~0.75 mi
Loading nearby amenities…
Taxation est. · year 1
- Rental income
- $25,363
- − Mortgage interest
- −$8,962
- − Property taxes
- −$1,376
- − Insurance
- −$800
- − Repairs & maintenance
- −$2,029
- − Management
- −$2,029
- − Depreciation
- −$4,655
- Taxable income
- $5,512
- Est. tax owed @ 24.0%
- −$1,323
- After-tax cash flow
- $6,469/yr
For passive investors: Depreciation is non-cash, so a rental often shows a tax loss while cash-flowing — sheltering income. Rental losses are passive: they offset passive income freely, and up to $25,000/yr can offset ordinary (W-2) income if you actively participate and your MAGI is under $100k (phasing out to $0 by $150k); unused losses carry forward. On sale, claimed depreciation is recaptured at up to 25%, and gains may owe capital-gains tax (a 1031 exchange can defer both). Figures are a year-1 estimate at your 24.0% rate — not tax advice; consult a CPA.
Schools (NCES district)
- District
- Hendry
- NCES district ID
- 1200780
- Math proficiency
- 35% ▼ -11.00%
- Reading proficiency
- 40% ▼ -4.00%
- Median HH income
- $37,043
- Composite
- 31.16/100
- National rank
- #6054
- State rank
- #65 of 73 in FL
Livability — LaBelle
- Score
- 72/100
- State rank
- #324
- US rank
- #5736
Category grades
Schools grade is shown separately in the Schools card above.
Census & demographics
- Census place
- LaBelle, FL
- County
- Hendry County · 23,186 people
- City population
- 23,186
- Metro
- Clewiston, FL
- Population (ZIP)
- 23,186
- Household income
- $57,009
- Rent vs Own
- Severe rent burden
- 498.0
Population outlook (Hendry County) Hauer SSP2
- Today (2025)
- 38,866 people
- By 2030
- 38,558 · -0.8%
- By 2040
- 37,743 · -2.9%
- By 2050
- 36,117 · -7.1%
- By 2075
- 30,070 · -22.6%
- By 2100
- 21,966 · -43.5%
Race, ethnicity, and origin ACS 2023
- Neighborhood character
- Majority Hispanic (56%)
- Race & ethnicity
- Hispanic / Latino 56% White 39% Two or more races 21% Black 2% Native American 2%
- Hispanic origin (detail)
- Mexican 40% Puerto Rican 3% Cuban 5%
- Common ancestry
- Lithuanian 2% Serbian 2% Slovak 1%
- Foreign-born
- 27% · Canada, Jamaica
- Languages at home
- 50% English-only · Spanish 50%
Political lean MEDSL · Hendry
- 2024 margin
- Solid R (+38.3) · D 30.4% · R 68.7%
- 2008→2024 swing
- -31.1pp toward R · 2008: -7.2pp · 2024: -38.3pp
- All cycles
- 2024: R+38.3 2020: R+23.0 2016: R+14.2 2012: R+5.9 2008: R+7.2
Not yet ingested
- Civics
- —
Market trends
- HPI YoY
- ▲ 75.20%
- Current HPI
- 537.4928
- Rent YoY
- —
- Metro
- Clewiston, FL
- State GDP YoY
- ▲ 3.28%
- F500 in state
- 36
Industry mix (Fortune 500 HQ in FL)
| Industry | F500 HQs | Revenue |
|---|---|---|
| Industrial Technology | 2 | $29B |
|
||
| Insurance | 2 | $17B |
|
||
| Retail | 1 | $60B |
|
||
| Technology Distribution | 1 | $58B |
|
||
| Homebuilding | 1 | $35B |
|
||
| Technology Manufacturing | 1 | $35B |
|
||
Price history
+725.0% since first listed22 events — show timeline
- 2026-05-21 Price Changed $165,000 FORTMLS
- 2026-04-21 Price Changed $170,000 FORTMLS
- 2026-03-12 Price Changed $175,000 FORTMLS
- 2026-02-03 Listed $199,000 FORTMLS
- 2026-01-25 Listing Removed — FORTMLS
- 2026-01-05 Price Changed $215,000 FORTMLS
- 2025-11-13 Price Changed $230,000 FORTMLS
- 2025-09-02 Price Changed $250,000 FORTMLS
- 2025-07-25 Listed $260,000 FORTMLS
- 2018-05-22 Sold (Public Records) $125,000 Public Records
- 2016-04-26 Sold (Public Records) $76,900 Public Records
- 2016-04-25 Sold (MLS) $76,900 FORTMLS
- 2016-04-08 Pending — FORTMLS
- 2016-04-05 Listed $76,900 FORTMLS
- 2012-10-26 Sold (MLS) $30,500 MARMLS
- 2012-10-26 Sold (MLS) $30,500 FORTMLS
- 2012-01-06 Price Changed $39,900 FORTMLS
- 2011-02-09 Listed $39,900 MARMLS
- 2005-07-18 Sold (Public Records) $70,000 Public Records
- 2001-11-20 Sold (Public Records) $40,000 Public Records
- 2001-11-20 Sold (Public Records) $40,000 Public Records
- 2000-04-03 Sold (Public Records) $20,000 Public Records
Property tax history
+0.7%/yrLatest (2025): $1,376 · +27.9% YoY. Source: county tax records.
Cash-flow waterfall
monthlySold comps — $/sqft
last 12 mo · ≤1 miLoading sold comps…