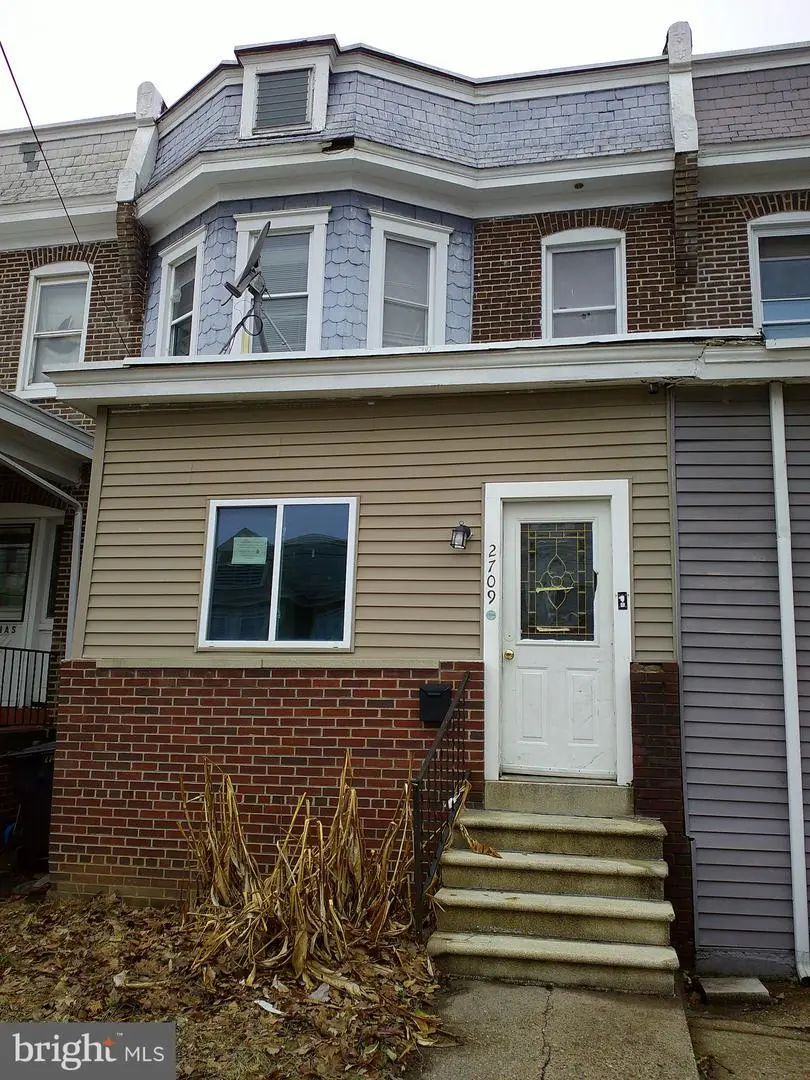
2709 N Madison St · Wilmington, DE
Flood risk 7/10 · Major
- FEMA flood zone
- X (unshaded)
- Chance of flooding over 30 yrs
- 0.99%
- Est. flood insurance / yr
- $473 – $860
Fire risk 1/10 · Minimal
- Est. fire insurance / yr
- $476 – $884
Heat risk 7/10 · Major
- Hot days now (above 103°F)
- 7 days/yr
- Hot days in 30 yrs
- 16 days/yr
Wind risk 6/10 · Moderate
- Chance of severe wind over 30 yrs
- 27.0%
Air-quality risk 3/10 · Minor
- Unhealthy air days now
- 2 days/yr
- Unhealthy air days in 30 yrs
- 3 days/yr
Risk factors via First Street. Map © Google.
Why this score? — see what drove the C+ grade
The composite is a weighted blend of 9 inputs, each scored 0–100. Each bar is that input's sub-score; the figure is the points it added to the 100-point composite (weight × sub-score).
- Cash flow +21.8/30.0
- ARV discount +14.9/15.0
- DSCR +7.0/10.0
- 1% rule +4.6/10.0
- Rent growth +3.9/5.0
- Livability +3.2/5.0
- Schools +3.1/10.0
- Condition / age +2.5/5.0
- Appreciation +0.0/10.0
$190,000
🖨 Deal sheet (PDF) 📄 Offer letter ✓ Due diligence
Listing remarks MLS
Spacious 3-bedroom 1-bathroom home just waiting for the next owner who is ready to roll up their sleeves and apply their personal touch and elbow grease. Great opportunity for investor or owner-occupant looking for a place to call home or next project. Enter property through front sun room leading into spacious living room which overlooks the dining room. Kitchen offers nice lay out with eat in area. Heading upstairs are 3 well sized bedrooms and full bath. Laundry is located in full basement area which offers tons of storage space and walk out to rear of the home. Convenient location. .. close to shopping, major roadways as well as Brandywine Park and Zoo. This property is eligible under the First Look Initiative. All Owner Occupant offers will be responded to after 7 days on the market and Investor offers will be responded to after 30 days. However, all offers can be submitted during the First Look period. A viewing release must be signed and returned to listing agent before showing this property. Property to be conveyed in AS IS condition.
Key facts
- Eat in area
- Kitchen layout
- Full basement
Tags
Neighborhood map
What this means for you Summary
Snapshot
- This is a 3-bed/1.0-bath townhouse listed at $190k.
Deal economics
- At list price, monthly cash flow is $241 ($3k/yr) — positive.
- The deal already cash-flows at list — no discount required.
- To meet the 1% rule (rent ≥ 1% of price), the offer needs to be $183k (3.7% below list).
- Recommended offer: $173k (9.0% below list) — sets the bar for market timing.
- Cap rate 8.2% vs local median 5.7% in Wilmington — top-decile yield for the area; either an underpriced asset or a hidden risk that comps aren't pricing in. Stress-test before assuming the spread holds.
Location & tenants
- Location reads 64/100 on livability (#52 in DE) — a middle-class / working-renter tenant base. Strengths: cost of living A+, housing A; Watch: employment D+, schools D, commute D.
- Red Clay Consolidated School District (suburban): math 27% / reading 42% proficiency, ranked #12 of 26 in DE (top 46%) — families likely to look elsewhere, expect single-tenant / working-renter base with shorter leases.
- Market conditions: Rents rising fast (+5.7%/yr); 129 active listings in the ZIP; 26 comparable units currently listed for rent nearby; rentals at typical pace (median 25d on market — plan ~3-4 weeks tenant-placement turnaround); 1,367 units permitted in New Castle County in 2024 (201 in 5+ unit buildings).
- This rent runs 41% of the median local income ($54k/yr) — at the standard rent-burdened threshold; future hikes will face affordability resistance.
Forward outlook
- Local home prices are declining (-3.0%/yr); year-one equity from $1k of loan paydown is wiped out by about $6k of value loss. Plan a longer hold.
- New Castle County population projected at +9% by 2050 — modest demand growth; plan on rents tracking national, not racing it.
Negotiation context
- It's been on market 104 days — a 9% lower offer ($173k) is reasonable based on typical stale-listing flexibility.
- 5 sale attempts since 24y ago; this cycle's ask has dropped $15k (7%) from the opening price — seller is motivated, your offer sets the floor, not the list.
Risks & watch-outs
- Watch-outs: flood insurance adds $56/mo; built in 1927 — expect roof / HVAC / electrical / plumbing capex.
- Climate carrying-cost: major flood risk; major wind risk, 27% chance of damaging wind over 30y; extreme-heat days projected 7→16/yr by 2055 (HVAC capex compounding) — expect insurance premiums to compound above CPI over the hold.
Questions for the listing agent
- It's been on market 104 days. Have you received any prior offers? Is the seller open to a 9% concession, seller financing, or rate buy-down credit?
- Built in 1927 — when were the roof, HVAC, electrical panel, plumbing, and water heater last replaced?
- What's the actual annual flood-insurance premium (NFIP or private), and is the property in a SFHA with mandatory coverage?
- Why hasn't it sold? Are there any deal-killer items the seller is aware of (foundation, flood, title, zoning, code violations)?
- Is there a deadline driving the sale (1031 exchange, divorce, estate, relocation)? That informs how much negotiation room exists.
- Schools are D-rated, which usually means shorter tenancies and higher turnover. Who's the typical renter profile here, and what's been the actual vacancy rate?
- Crime grade is F in this area — have there been break-ins, vandalism, or insurance claims at this property in the last 3 years? What carrier currently insures it and at what premium?
- What's the average days-on-market for RENTAL listings here right now (not sales)? A rising rental-DOM trend means longer vacancies and softer asking-rent achievability than the comps imply.
- What's the recent tenant-quality profile in this submarket — average credit score on applications, eviction rate, late-payment / NSF rate, and stable-employment percentage? A property-management company in the area should have these aggregated.
- How much new for-sale + rental construction is in the pipeline within 1–3 miles? Heavy new supply typically softens prices + rents 12–24 months out; constrained supply supports both.
Investment metrics
- 1% rule
- 0.96% ✗
- Cap rate
- 8.16%
- Cash-on-cash
- 6.68%
- DSCR
- 1.30
- GRM
- 8.7
CMA / ARV
- ARV (median comp)
- $227,166
- List price
- $190,000
- Delta
- -16.36%
- Verdict
- UNDERPRICED
- Comps
- 20 within 1.0 mi
Show comp detail 12 sales within ~0.75 mi
| Address | Dist | Beds/Ba | Sqft | Sold | Price | $/sf | Match |
|---|---|---|---|---|---|---|---|
| 3101 N Van Buren St | 0.28mi | 3/2.0 | 1,850 (0%) | 1mo | $290,000 | $157 | 82 |
| 412 W Thirty Second St | 0.16mi | 3/2.5 | 1,700 (-8%) | 0mo | $299,900 | $176 | 73 |
| 3312 N Market St | 0.53mi | 4/2.5 (+1) | 1,850 (0%) | 2mo | $329,900 | $178 | 62 |
| 907 W 25th St | 0.34mi | 3/1.5 | 1,615 (-13%) | 1mo | $305,000 | $189 | 60 |
| 1703 N Pine St | 0.73mi | 3/2.0 | 1,825 (-1%) | 0mo | $117,000 | $64 | 59 |
| 3318 N Market St | 0.55mi | 4/3.5 (+1) | 1,850 (0%) | 2mo | $345,000 | $186 | 58 |
| 817 W 32nd St | 0.44mi | 4/2.5 (+1) | 1,750 (-5%) | 2mo | $375,000 | $214 | 58 |
| 310 W 31st St | 0.24mi | 4/2.0 (+1) | 2,100 (+14%) | 2mo | $289,900 | $138 | 56 |
| 31 E 23rd St | 0.50mi | 3/2.0 | 1,675 (-10%) | 2mo | $249,999 | $149 | 56 |
| 318 W 39th St | 0.66mi | 3/1.5 | 1,700 (-8%) | 1mo | $251,000 | $148 | 53 |
| 16 W 38th St | 0.68mi | 3/1.5 | 1,575 (-15%) | 2mo | $325,000 | $206 | 40 |
| 25 W 39th St | 0.74mi | 4/2.0 (+1) | 1,650 (-11%) | 3mo | $225,600 | $137 | 36 |
Match score weights: distance 35% · size 25% · config 20% · recency 20%. Top-matched comps best support the ARV.
Projected returns pro-forma
-3.0% appreciation · 5.72% rent growth · sell at horizon
- IRR
- -5.1%
- Equity multiple
- 0.81×
- Total profit
- $-10,358
- Equity at exit
- $28,330
- IRR
- 7.3%
- Equity multiple
- 1.62×
- Total profit
- $32,871
- Equity at exit
- $16,428
Cash invested: $53,200 (down + closing). Projections, not guarantees.
Landlord ↔ Tenant lean methodology
- Overall (STATE)
- 70 Landlord-Friendly
- State Delaware
- 70 Landlord-Friendly · D+7
- County
- — inherits STATE
- City
- — inherits STATE
ZIP-level market 19802
- Rents YoY
- 5.7%
- Active inventory
- 129
- Price-to-rent
- 8.7×
Monthly cashflow live
- Estimated rent
- $1,830 high interval (Pro) →
- Mortgage (P&I)
- −$996
- Tax from tax record
- −$74 /mo · $883/yr
- Insurance
- −$79
- Flood insurance flood zone
- −$56 /mo · $666/yr
- HOA
- −$0
- Vacancy / Maint / Mgmt
- −$384
- Net cashflow
- $241
Break-even live
Sensitivity live
| Price | -10% $348 | -5% $294 | +0% $241 | +5% $187 | +10% $133 |
|---|---|---|---|---|---|
| Rent | -10% $96 | -5% $168 | +0% $241 | +5% $313 | +10% $385 |
| Rate | -1.0pp $336 | -0.5pp $289 | base $241 | +0.5pp $191 | +1.0pp $141 |
UW: 25.0% down · 7.5% · 30yr · 1.5% tax · 5.0% vac · 8.0% maint · 8.0% mgmt
Financing live
Cash to close
- Down payment
- $47,500
- Closing costs
- $5,700
- Reserves months
- —
- Total cash needed
- —
Loan-product check · same deal, 3 products live
Conventional
25% down · 7.5% · 30yr
- Down + closing
- —
- Monthly P&I
- —
- Monthly cashflow
- —
- DSCR
- —
- Eligible?
- —
Personal DTI + credit; lowest rate.
DSCR
20% down · 8.5% · 30yr
- Down + closing
- —
- Monthly P&I
- —
- Monthly cashflow
- —
- DSCR
- —
- Eligible?
- —
No personal income docs; deal must DSCR.
Hard money
10% down · 12.0% · 12mo
- Down + closing
- —
- Monthly P&I
- —
- Monthly cashflow
- —
- DSCR
- —
- Eligible?
- —
Short-term bridge; refi at stabilization.
Rent comps 26 comps
| Address | Beds | Baths | Sqft | Rent | $/sqft | DOM | Units | Dist |
|---|---|---|---|---|---|---|---|---|
| 517 W 26th St Unit NA Wilmington, DE | 3.0 | 1.5 | 1344 | $1,900 | $1.41 | 25d | 1 | 0.09mi |
| 2923 N Washington St Wilmington, DE | 3.0 | 1.0 | 1225 | $1,600 | $1.31 | 2d | 1 | 0.20mi |
| 3003 N Washington St Wilmington, DE | 3.0 | 1.0 | 1250 | $1,950 | $1.56 | 44d | 1 | 0.22mi |
| 2401 N West St Wilmington, DE | 4.0 | 1.0 | 1650 | $1,900 | $1.15 | 16d | 1 | 0.30mi |
| 306 W 23rd St Unit 1 Wilmington, DE | 2.0 | 1.0 | 1475 | $1,295 | $0.88 | 25d | 1 | 0.30mi |
| 306 W 23rd St Unit 2 Wilmington, DE | 2.0 | 1.0 | 1475 | $1,295 | $0.88 | 44d | 1 | 0.30mi |
| 302 W 23rd St Unit 1 Wilmington, DE | 2.0 | 1.0 | 1450 | $1,295 | $0.89 | 25d | 1 | 0.31mi |
| 314 Concord Ave Unit 2 Wilmington, DE | 2.0 | 1.0 | 1300 | $1,295 | $1.00 | 25d | 1 | 0.31mi |
| 2518 N Tatnall St Wilmington, DE | 4.0 | 1.5 | 1575 | $1,995 | $1.27 | 44d | 1 | 0.34mi |
| 125 W 23rd St Wilmington, DE | 4.0 | 2.0 | 1672 | $1,995 | $1.19 | 44d | 1 | 0.35mi |
| 912 McCabe Ave Wilmington, DE | 2.0 | 1.0 | 2100 | $1,950 | $0.93 | 0d | 1 | 0.44mi |
| 507 Barrett St Wilmington, DE | 3.0 | 1.0 | 1275 | $1,700 | $1.33 | 44d | 1 | 0.50mi |
| 547 Eastlawn Ave Wilmington, DE | 3.0 | 1.0 | 1400 | $1,995 | $1.43 | 44d | 1 | 0.89mi |
| 107 W 13th St Wilmington, DE | 3.0 | 1.5 | 1325 | $1,895 | $1.43 | 44d | 1 | 0.92mi |
| 903 Shallcross Ave Wilmington, DE | 2.0 | 1.5 | 1575 | $2,195 | $1.39 | 25d | 1 | 0.94mi |
| 1217 N King St Wilmington, DE | 3.0 | 1.5 | 1300 | $2,145 | $1.65 | 19d | 1 | 0.94mi |
| 1124 Clifford Brown Walk Wilmington, DE | 2.0 | 1.0 | 1240 | $1,625 | $1.31 | 44d | 1 | 1.05mi |
| 1501 N Broom St Unit 2/3 Wilmington, DE | 2.0 | 2.5 | 1250 | $2,500 | $2.00 | 6d | 1 | 1.16mi |
| 1010 Trenton Pl Wilmington, DE | 3.0 | 1.5 | 1475 | $2,350 | $1.59 | 17d | 1 | 1.19mi |
| 2 Colony Blvd Wilmington, DE | 1.0–2.0 | 1.0–2.0 | 1112 | $2,500 | $2.25 | 0d | 6 | 1.19mi |
| 212 W 9th St Unit 204 Wilmington, DE | 2.0 | 2.0 | 1671 | $1,745 | $1.04 | 6d | 1 | 1.21mi |
| 212 W 9th St Unit 204 Wilmington, DE | 2.0 | 2.0 | 1671 | $1,795 | $1.07 | 44d | 1 | 1.21mi |
| 801 N Orange St Wilmington, DE | 3.0 | 1.0–3.0 | 1118 | $3,991 | $3.57 | 3d | 117 | 1.25mi |
| 801 N Market St Unit 207 Wilmington, DE | 2.0 | 2.0 | 1239 | $1,895 | $1.53 | 6d | 1 | 1.28mi |
| 827 N Jackson St Unit 2 Wilmington, DE | 2.0 | 1.0 | 2250 | $1,545 | $0.69 | 13d | 1 | 1.34mi |
| 1319 W 10th St Wilmington, DE | 2.0 | 3.0 | 2200 | $2,500 | $1.14 | 19d | 1 | 1.39mi |
Listing history 26 events
-
2026-06-21days on market $190,000 Active 104 DOM
-
2026-06-18days on market $190,000 Active 101 DOM
-
2026-06-17days on market $190,000 Active 100 DOM
-
2026-06-16days on market $190,000 Active 99 DOM
-
2026-06-15days on market $190,000 Active 98 DOM
-
2026-06-13days on market $190,000 Active 96 DOM
-
2026-06-13days on market $190,000 Active 95 DOM
-
2026-06-09days on market $190,000 Active 92 DOM
-
2026-06-08days on market $190,000 Active 91 DOM
-
2026-06-07days on market $190,000 Active 90 DOM
-
2026-06-04days on market $190,000 Active 87 DOM
-
2026-06-03days on market $190,000 Active 86 DOM
-
2026-06-02days on market $190,000 Active 85 DOM
-
2026-06-01days on market $190,000 Active 84 DOM
-
2026-05-31days on market $190,000 Active 83 DOM
-
2026-04-29price $195,000 1061-char remark
Show marketing remark (1061 chars)
Spacious 3-bedroom 1-bathroom home just waiting for the next owner who is ready to roll up their sleeves and apply their personal touch and elbow grease. Great opportunity for investor or owner-occupant looking for a place to call home or next project. Enter property through front sun room leading into spacious living room which overlooks the dining room. Kitchen offers nice lay out with eat in area. Heading upstairs are 3 well sized bedrooms and full bath. Laundry is located in full basement area which offers tons of storage space and walk out to rear of the home. Convenient location. .. close to shopping, major roadways as well as Brandywine Park and Zoo. This property is eligible under the First Look Initiative. All Owner Occupant offers will be responded to after 7 days on the market and Investor offers will be responded to after 30 days. However, all offers can be submitted during the First Look period. A viewing release must be signed and returned to listing agent before showing this property. Property to be conveyed in AS IS condition.
-
2026-04-21soldstatus $1,575,100
-
2026-03-09$205,000 Active 1061-char remark
Show marketing remark (1061 chars)
Spacious 3-bedroom 1-bathroom home just waiting for the next owner who is ready to roll up their sleeves and apply their personal touch and elbow grease. Great opportunity for investor or owner-occupant looking for a place to call home or next project. Enter property through front sun room leading into spacious living room which overlooks the dining room. Kitchen offers nice lay out with eat in area. Heading upstairs are 3 well sized bedrooms and full bath. Laundry is located in full basement area which offers tons of storage space and walk out to rear of the home. Convenient location. .. close to shopping, major roadways as well as Brandywine Park and Zoo. This property is eligible under the First Look Initiative. All Owner Occupant offers will be responded to after 7 days on the market and Investor offers will be responded to after 30 days. However, all offers can be submitted during the First Look period. A viewing release must be signed and returned to listing agent before showing this property. Property to be conveyed in AS IS condition.
-
2025-05-19historical
-
2025-03-28$199,900 Active
-
2020-04-16historical
-
2019-04-17$129,900 Active
-
2005-09-14historical
-
2005-09-13$99,900
-
2002-06-17$84,900
-
2002-06-17historical
ⓘ Source: listings_history table (triggers on properties + properties_extension) + one-shot
backfill from property_details.listing_events for pre-trigger history.
Tax reassessment forecast DE · Partial reset (capped growth)
- Current annual tax
- $883 · $74/mo
- Projected year-2 tax
- $993 · $83/mo
- Expected delta
- +$109/yr (+$9/mo · 12.4%)
ⓘ Screening estimate from a state-policy table — verify with the county assessor before closing.
Climate risk First Street
- Flood 7/10 Severe FEMA zone X (unshaded) · 99% chance over 30 yrs
- Wildfire 1/10 Low
- Heat 7/10 Severe 7 d/yr ≥103°F today · 16 d/yr by 30 yrs out
- Wind 6/10 Major 27% chance of damaging wind over 30 yrs
- Air quality 3/10 Moderate 2 unhealthy d/yr today · 3 by 30 yrs out
Nearby sold comps map
Loading sold comps map…
Walkable amenities ~0.75 mi
Loading nearby amenities…
Taxation est. · year 1
- Rental income
- $21,954
- − Mortgage interest
- −$10,643
- − Property taxes
- −$883
- − Insurance
- −$1,616
- − Repairs & maintenance
- −$1,756
- − Management
- −$1,756
- − Depreciation
- −$5,527
- Taxable loss
- −$228
- Est. tax savings @ 24.0%
- +$55
- After-tax cash flow
- $2,942/yr
For passive investors: Depreciation is non-cash, so a rental often shows a tax loss while cash-flowing — sheltering income. Rental losses are passive: they offset passive income freely, and up to $25,000/yr can offset ordinary (W-2) income if you actively participate and your MAGI is under $100k (phasing out to $0 by $150k); unused losses carry forward. On sale, claimed depreciation is recaptured at up to 25%, and gains may owe capital-gains tax (a 1031 exchange can defer both). Figures are a year-1 estimate at your 24.0% rate — not tax advice; consult a CPA.
Schools (NCES district)
- District
- Red Clay Consolidated School District
- NCES district ID
- 1001300
- Math proficiency
- 27% ▼ -11.00%
- Reading proficiency
- 42% ▼ -7.00%
- Median HH income
- $64,298
- Composite
- 31.25/100
- National rank
- #6027
- State rank
- #12 of 26 in DE
Livability — Wilmington
- Score
- 64/100
- State rank
- #52
- US rank
- #14251
Category grades
Schools grade is shown separately in the Schools card above.
Census & demographics
- Census place
- Wilmington, DE
- County
- New Castle County · 483,412 people
- City population
- 173,480
- Metro
- Philadelphia-Camden-Wilmington, PA-NJ-DE-MD
- Population (ZIP)
- 26,051
- Household income
- $53,812
- Rent vs Own
- Severe rent burden
- 1816.0
Population outlook (New Castle County) Hauer SSP2
- Today (2025)
- 594,686 people
- By 2030
- 609,164 · +2.4%
- By 2040
- 632,154 · +6.3%
- By 2050
- 649,068 · +9.1%
- By 2075
- 687,771 · +15.7%
- By 2100
- 694,961 · +16.9%
Race, ethnicity, and origin ACS 2023
- Neighborhood character
- Predominantly Black (68%)
- Race & ethnicity
- Black 68% White 20% Hispanic / Latino 7% Two or more races 5%
- Hispanic origin (detail)
- Puerto Rican 4%
- Common ancestry
- Slovak 1% Romanian 1% Italian 1%
- Foreign-born
- 11% · Canada, Jamaica, China
- Languages at home
- 92% English-only · Spanish 4% Arabic 0%
Political lean MEDSL · New Castle
- 2024 margin
- Solid D (+32.6) · D 65.5% · R 32.9% · Other 1.6%
- 2008→2024 swing
- -8.1pp toward R · 2008: 40.6pp · 2024: 32.6pp
- All cycles
- 2024: D+32.6 2020: D+37.1 2016: D+29.6 2012: D+34.1 2008: D+40.6
Not yet ingested
- Civics
- —
Market trends
- HPI YoY
- ▼ -296.47%
- Current HPI
- 225.6613
- Rent YoY
- ▲ 5.72%
- Metro
- Philadelphia-Camden-Wilmington, PA-NJ-DE-MD
- State GDP YoY
- —
- F500 in state
- 0
Price history
+129.7% since first listed11 events — show timeline
- 2026-04-29 Price Changed $195,000 BRIGHT MLS
- 2026-04-21 Sold (Public Records) $1,575,100 Public Records
- 2026-03-09 Listed $205,000 BRIGHT MLS
- 2025-05-19 Listing Removed — BRIGHT MLS
- 2025-03-28 Listed $199,900 BRIGHT MLS
- 2020-04-16 Listing Removed — BRIGHT MLS
- 2019-04-17 Listed $129,900 BRIGHT MLS
- 2005-09-14 Listing Removed — BRIGHT MLS
- 2005-09-13 Listed $99,900 BRIGHT MLS
- 2002-06-17 Listing Removed — BRIGHT MLS
- 2002-06-17 Listed $84,900 BRIGHT MLS
Property tax history
+1.6%/yrLatest (2024): $883 · +15.1% YoY. Source: county tax records.
Cash-flow waterfall
monthlySold comps — $/sqft
last 12 mo · ≤1 miLoading sold comps…