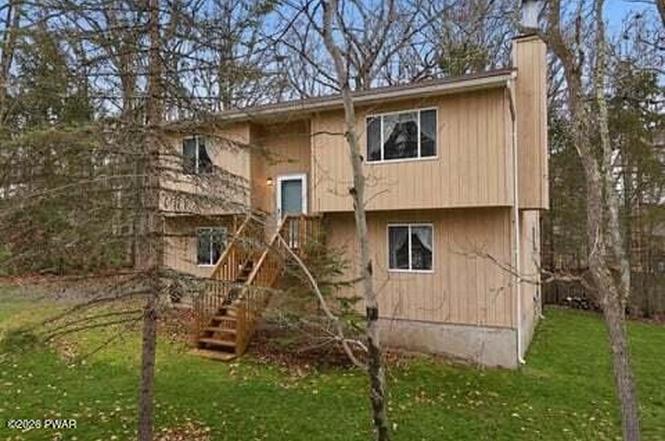
800 Wren Ct · Hemlock Farms, PA
Flood risk 1/10 · Minimal
- FEMA flood zone
- X (unshaded)
- Chance of flooding over 30 yrs
- 0.0%
- Est. flood insurance / yr
- $473 – $860
Fire risk 4/10 · Minor
- Est. fire insurance / yr
- $511 – $949
Heat risk 2/10 · Minimal
- Hot days now (above 91°F)
- 7 days/yr
- Hot days in 30 yrs
- 15 days/yr
Wind risk 3/10 · Minor
- Chance of severe wind over 30 yrs
- 6.0%
Air-quality risk 2/10 · Minimal
- Unhealthy air days now
- 1 days/yr
- Unhealthy air days in 30 yrs
- 2 days/yr
Risk factors via First Street. Map © Google.
Why this score? — see what drove the A grade
The composite is a weighted blend of 9 inputs, each scored 0–100. Each bar is that input's sub-score; the figure is the points it added to the 100-point composite (weight × sub-score).
- Cash flow +30.0/30.0
- ARV discount +14.9/15.0
- 1% rule +10.0/10.0
- DSCR +10.0/10.0
- Appreciation +10.0/10.0
- Schools +4.2/10.0
- Livability +3.4/5.0
- Rent growth +2.5/5.0
- Condition / age +2.5/5.0
$239,900
🖨 Deal sheet 📄 Offer letter ✓ Due diligence
Listing remarks
Welcome to 800 Wren Court, a charming cul-de-sac home in the heart of Hemlock Farms. This 4-bedroom, 2-bath property offers a solid layout, warm natural light, and the perfect chance to make it your own with a little TLC. As an estate sale, it has been thoughtfully decluttered and professionally cleaned, creating a clean canvas ready for your personal touches. Inside, the main living area features an inviting wood-burning fireplace and sliders that open to a generous deck with peaceful, wooded privacy. With some updating, this home can truly reflect your style -- whether you're looking for a full-time residence or a relaxing weekend escape. Set within one of the Poconos' premier amenity-fil
Key facts
- Generous deck
- Cul-de-sac home
- Hiking trails
Tags
Property features AI
Finance
- Other: Community features: pool, clubhouse, tennis courts, playground, park, lake, fitness center
- HOA & community: Hemlock Farms homeowners association; Association amenities include pool, indoor pool, clubhouse, fitness center, tennis courts, basketball court, playground, park, trails, lake access, spa/hot tub, sauna, dog park, game room, billiard room, meeting room, recreation room, picnic area, beach rights/access, exercise course, and security; Association provides maintenance of grounds, trash service, and snow removal; Annual association fee (derived monthly approx. $243.17)
Exterior
- Parking: Driveway with gravel surface
- Security: 24-hour security; Gated community with guard
- Utilities: 200+ amp electric service; Cable available; Electricity available; Septic tank
- Home design: Single family house; 2 stories; Residential property in Hemlock Farms
- Construction: Concrete and frame construction; Concrete perimeter foundation; Asphalt shingle roof; Built above grade finished area approximately 1,632
- Exterior features: Private yard; Deck; Shed(s); Corner lot; Wooded lot; Cul-de-sac lot; View of community lake
Interior
- Kitchen: Microwave; Free‑standing refrigerator; Free‑standing gas range
- Bedrooms: Total of 8 rooms (bedrooms included in room count)
- Flooring: Carpet; Tile; Laminate
- Bathrooms: 2 full bathrooms
- Heating & cooling: Baseboard heating (electric); Ceiling fan cooling
- Interior features: Ceiling fans; His and hers closets; Insulated windows; Finished basement; Wood-burning fireplace in the living room
- Laundry & utility: Washer; Dryer; Laundry room and basement laundry
Neighborhood map
What this means for you Summary
Snapshot
- This is a 4-bed/2.0-bath single-family listed at $240k.
Deal economics
- At list price, monthly cash flow is $1k ($17k/yr) — positive.
- The deal already cash-flows at list — no discount required.
- Meets the 1% rule at list price ($4k rent vs $240k).
- Recommended offer: $211k (12.0% below list) — sets the bar for market timing.
- Cap rate 13.5% vs local median 7.1% in Hemlock Farms — top-decile yield for the area; either an underpriced asset or a hidden risk that comps aren't pricing in. Stress-test before assuming the spread holds.
Location & tenants
- Location reads 68/100 on livability (#884 in PA) — a middle-class / working-renter tenant base. Strengths: crime A+, housing A+, health & safety A+; Watch: schools C-, amenities F, commute F.
- Wallenpaupack Area SD (rural): math 39% / reading 59% proficiency, ranked #192 of 539 in PA (top 36%) — families likely to look elsewhere, expect single-tenant / working-renter base with shorter leases.
- Market conditions: 371 active listings in the ZIP; 6 comparable units currently listed for rent nearby; rentals leasing fast (median 2d on market — plan ~1-2 weeks tenant-placement turnaround); 213 units permitted in Pike County in 2024 (0 in 5+ unit buildings).
Forward outlook
- In year one you build about $26k of equity ($2k loan paydown + $24k appreciation (10.0% local appreciation)).
- Pike County population projected at -25% by 2050 — secular population decline; favor cash flow + early exit over multi-decade hold.
- At projected returns (10.0% appreciation + 3.0% rent growth), your $67k cash investment doubles in ~2 years — after that, you're playing with house money.
- By year 2, paydown + projected appreciation supports a ~$41k cash-out refi (75% LTV) — recoverable capital for the next deal without selling this one.
Negotiation context
- It's been on market 153 days — a 12% lower offer ($211k) is reasonable based on typical stale-listing flexibility.
- 2 sale attempts; this cycle's ask has dropped $50k (17%) from the opening price — seller is motivated, your offer sets the floor, not the list.
Questions for the listing agent
- It's been on market 153 days. Have you received any prior offers? Is the seller open to a 12% concession, seller financing, or rate buy-down credit?
- What does the HOA fee cover, when was the last increase, and are there any pending special assessments or reserve-fund shortfalls?
- Why hasn't it sold? Are there any deal-killer items the seller is aware of (foundation, flood, title, zoning, code violations)?
- Is there a deadline driving the sale (1031 exchange, divorce, estate, relocation)? That informs how much negotiation room exists.
- What's the average days-on-market for RENTAL listings here right now (not sales)? A rising rental-DOM trend means longer vacancies and softer asking-rent achievability than the comps imply.
- What's the recent tenant-quality profile in this submarket — average credit score on applications, eviction rate, late-payment / NSF rate, and stable-employment percentage? A property-management company in the area should have these aggregated.
- How much new for-sale + rental construction is in the pipeline within 1–3 miles? Heavy new supply typically softens prices + rents 12–24 months out; constrained supply supports both.
Investment metrics
- 1% rule
- 1.74% ✓
- Cap rate
- 13.55%
- Cash-on-cash
- 25.90%
- DSCR
- 2.15
- GRM
- 4.8
CMA / ARV
- ARV (on-the-fly)
- $287,232
- Comps found
- 12
Show comp detail 12 sales within ~0.75 mi
| Address | Dist | Beds/Ba | Sqft | Sold | Price | $/sf | Match |
|---|---|---|---|---|---|---|---|
| 803 Lariat Ct | 0.38mi | 4/2.0 | 1,588 (-3%) | 8mo | $190,000 | $120 | 70 |
| 800 Osprey Ct | 0.25mi | 3/2.0 (-1) | 1,568 (-4%) | 9mo | $310,000 | $198 | 70 |
| 106 Fetlock Dr | 0.24mi | 3/3.0 (-1) | 1,700 (+4%) | 7mo | $255,000 | $150 | 67 |
| 119 Ridgeway Dr | 0.60mi | 3/2.5 (-1) | 1,662 (+2%) | 1mo | $549,000 | $330 | 61 |
| 120 Ridgeway Dr | 0.57mi | 3/2.0 (-1) | 1,641 (+1%) | 10mo | $280,000 | $171 | 60 |
| 118 Ledgeway Ln | 0.45mi | 3/2.5 (-1) | 1,716 (+5%) | 8mo | $399,999 | $233 | 56 |
| 114 Heron Bay Rd | 0.11mi | 3/2.0 (-1) | 1,816 (+11%) | 19mo | $320,000 | $176 | 56 |
| 804 Rowel Ct | 0.33mi | 3/2.0 (-1) | 1,536 (-6%) | 18mo | $189,900 | $124 | 55 |
| 803 Fetlock Ct | 0.32mi | 3/2.0 (-1) | 1,837 (+13%) | 7mo | $290,000 | $158 | 53 |
| 211 Stirrup Ln | 0.51mi | 3/2.0 (-1) | 1,638 (+0%) | 22mo | $283,500 | $173 | 52 |
| 801 Saddlebrook Spur Spur | 0.68mi | 3/2.0 (-1) | 1,728 (+6%) | 4mo | $550,500 | $319 | 50 |
| 101 Ridgeway Dr | 0.75mi | 3/2.0 (-1) | 1,420 (-13%) | 6mo | $292,500 | $206 | 34 |
Match score weights: distance 35% · size 25% · config 20% · recency 20%. Top-matched comps best support the ARV.
Projected returns pro-forma
10.0% appreciation · 3.0% rent growth · sell at horizon
- IRR
- 43.8%
- Equity multiple
- 4.32×
- Total profit
- $223,183
- Equity at exit
- $216,121
- IRR
- 38.0%
- Equity multiple
- 9.71×
- Total profit
- $584,962
- Equity at exit
- $466,073
Cash invested: $67,172 (down + closing). Projections, not guarantees.
Landlord ↔ Tenant lean methodology
- Overall (STATE)
- 62 Landlord-Friendly
- State Pennsylvania
- 62 Landlord-Friendly · EVEN
- County
- — inherits STATE
- City
- — inherits STATE
ZIP-level market 18428
- Home prices YoY
- 9.2%
- Active inventory
- 371
- Price-to-rent
- 4.8×
Monthly cashflow live
- Estimated rent
- $4,167 high interval (Pro) →
- Mortgage (P&I)
- −$1,258
- Tax from tax record
- −$241 /mo · $2,887/yr
- Insurance
- −$100
- HOA
- −$243
- Vacancy / Maint / Mgmt
- −$875
- Net cashflow
- $1,450
Break-even live
UW: 25.0% down · 7.5% · 30yr · 1.5% tax · 5.0% vac · 8.0% maint · 8.0% mgmt
Financing live
Cash to close
- Down payment
- $59,975
- Closing costs
- $7,197
- Reserves months
- —
- Total cash needed
- —
Loan-product check · same deal, 3 products live
Conventional
25% down · 7.5% · 30yr
- Down + closing
- —
- Monthly P&I
- —
- Monthly cashflow
- —
- DSCR
- —
- Eligible?
- —
Personal DTI + credit; lowest rate.
DSCR
20% down · 8.5% · 30yr
- Down + closing
- —
- Monthly P&I
- —
- Monthly cashflow
- —
- DSCR
- —
- Eligible?
- —
No personal income docs; deal must DSCR.
Hard money
10% down · 12.0% · 12mo
- Down + closing
- —
- Monthly P&I
- —
- Monthly cashflow
- —
- DSCR
- —
- Eligible?
- —
Short-term bridge; refi at stabilization.
Rent comps 6 comps
| Address | Beds | Baths | Sqft | Rent | $/sqft | DOM | Units | Dist |
|---|---|---|---|---|---|---|---|---|
| 101 Pommel Dr Hawley, PA | 3.0 | 2.0 | 1691 | $4,400 | $2.60 | 1d | 1 | 0.21mi |
| 402 Canoe Brook Dr Hawley, PA | 3.0 | 2.0 | 2055 | $3,500 | $1.70 | 1d | 1 | 1.02mi |
| 106 Corral Ln Hawley, PA | 3.0 | 2.0 | 2150 | $4,000 | $1.86 | 4d | 1 | 1.10mi |
| 113 Portage Ln Milford, PA | 3.0 | 2.0 | 1400 | $4,000 | $2.86 | 1d | 1 | 1.41mi |
| 313 Forest Dr Blooming Grove, PA | 3.0 | 2.0 | 1200 | $5,000 | $4.17 | 1d | 1 | 1.43mi |
| 811 Hickory Ct Hawley, PA | 3.0 | 2.0 | 1100 | $2,500 | $2.27 | 1d | 1 | 1.48mi |
HOA detail
- Monthly dues
- $243 · $2,916/yr
Listing history 6 events
-
2026-04-29status Pending
-
2026-04-25price $239,900
-
2026-01-28status Active
-
2026-01-16status Pending
-
2026-01-14price $259,900
-
2025-11-16$289,900 Active
ⓘ Source: listings_history table (triggers on properties + properties_extension) + one-shot
backfill from property_details.listing_events for pre-trigger history.
Tax reassessment forecast PA · Partial reset (capped growth)
- Current annual tax
- $2,887 · $241/mo
- Projected year-2 tax
- $3,339 · $278/mo
- Expected delta
- +$452/yr (+$38/mo · 15.6%)
ⓘ Screening estimate from a state-policy table — verify with the county assessor before closing.
Climate risk First Street
- Flood 1/10 Low FEMA zone X (unshaded) · 0% chance over 30 yrs
- Wildfire 4/10 Moderate
- Heat 2/10 Low 7 d/yr ≥91°F today · 15 d/yr by 30 yrs out
- Wind 3/10 Moderate 6% chance of damaging wind over 30 yrs
- Air quality 2/10 Low 1 unhealthy d/yr today · 2 by 30 yrs out
Nearby sold comps map
Loading sold comps map…
Walkable amenities ~0.75 mi
Loading nearby amenities…
Taxation est. · year 1
- Rental income
- $49,999
- − Mortgage interest
- −$13,438
- − Property taxes
- −$2,887
- − Insurance
- −$1,200
- − Repairs & maintenance
- −$4,000
- − Management
- −$4,000
- − HOA
- −$2,916
- − Depreciation
- −$6,979
- Taxable income
- $14,580
- Est. tax owed @ 24.0%
- −$3,499
- After-tax cash flow
- $13,901/yr
For passive investors: Depreciation is non-cash, so a rental often shows a tax loss while cash-flowing — sheltering income. Rental losses are passive: they offset passive income freely, and up to $25,000/yr can offset ordinary (W-2) income if you actively participate and your MAGI is under $100k (phasing out to $0 by $150k); unused losses carry forward. On sale, claimed depreciation is recaptured at up to 25%, and gains may owe capital-gains tax (a 1031 exchange can defer both). Figures are a year-1 estimate at your 24.0% rate — not tax advice; consult a CPA.
Schools (NCES district)
- District
- Wallenpaupack Area SD
- NCES district ID
- 4224750
- Math proficiency
- 39% ▼ -10.00%
- Reading proficiency
- 59% ▼ -5.00%
- Median HH income
- $51,027
- Composite
- 41.97/100
- National rank
- #3345
- State rank
- #192 of 539 in PA
Livability — Hemlock Farms
- Score
- 68/100
- State rank
- #884
- US rank
- #9421
Category grades
Schools grade is shown separately in the Schools card above.
Census & demographics
- Census place
- Hemlock Farms, PA
- Population (ZIP)
- 12,446
Population outlook (Pike County) Hauer SSP2
- Today (2025)
- 53,548 people
- By 2030
- 51,622 · -3.6%
- By 2040
- 46,490 · -13.2%
- By 2050
- 40,372 · -24.6%
- By 2075
- 31,951 · -40.3%
- By 2100
- 26,821 · -49.9%
Race, ethnicity, and origin ACS 2023
- Neighborhood character
- Predominantly White (85%)
- Race & ethnicity
- White 85% Hispanic / Latino 8% Two or more races 6% Black 1% Asian 1%
- Hispanic origin (detail)
- Puerto Rican 5%
- Common ancestry
- Romanian 5% Portuguese 3% Italian 2%
- Foreign-born
- 5% · Canada
- Languages at home
- 91% English-only · Spanish 5% Russian/Polish/Slavic 1% Other Asian/Pacific 1%
Political lean MEDSL · Pike
- 2024 margin
- Strong R (+24.1) · D 37.6% · R 61.6%
- 2008→2024 swing
- -19.8pp toward R · 2008: -4.2pp · 2024: -24.1pp
- All cycles
- 2024: R+24.1 2020: R+19.0 2016: R+26.0 2012: R+11.0 2008: R+4.2
Not yet ingested
- Civics
- —
Market trends
- HPI YoY
- ▲ 28.60%
- Current HPI
- 340.8254
- Rent YoY
- —
- Metro
- —
- State GDP YoY
- ▲ 1.68%
- F500 in state
- 34
Industry mix (Fortune 500 HQ in PA)
| Industry | F500 HQs | Revenue |
|---|---|---|
| Healthcare | 2 | $309B |
|
||
| Insurance | 2 | $27B |
|
||
| Telecommunications / Media | 1 | $124B |
|
||
| Industrial Distribution | 1 | $22B |
|
||
| Financial Services | 1 | $20B |
|
||
| Chemicals / Materials | 1 | $18B |
|
||
Price history
-17.2% since first listed6 events — show timeline
- 2026-04-29 Pending — PWMLS
- 2026-04-25 Price Changed $239,900 PWMLS
- 2026-01-28 Relisted — PWMLS
- 2026-01-16 Pending — PWMLS
- 2026-01-14 Price Changed $259,900 PWMLS
- 2025-11-16 Listed $289,900 PWMLS
Property tax history
+2.8%/yrLatest (2026): $2,887 · +3.0% YoY. Source: county tax records.
Cash-flow waterfall
monthlySold comps — $/sqft
last 12 mo · ≤1 miLoading sold comps…