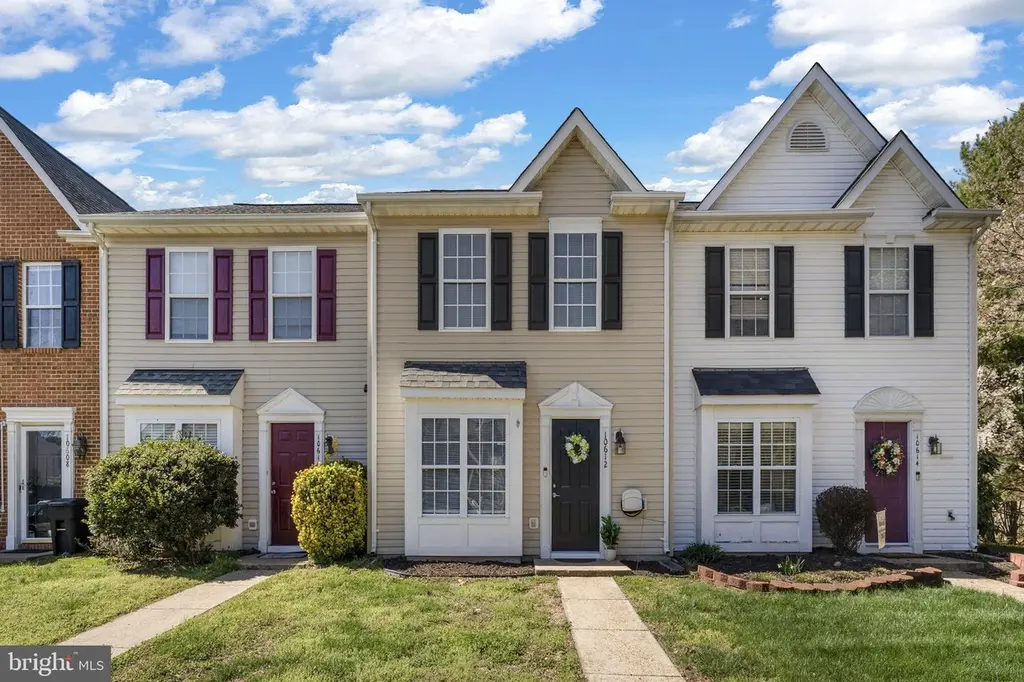
10612 Boxmeer Ct · Fredericksburg, VA
Flood risk 1/10 · Minimal
- FEMA flood zone
- X (unshaded)
- Chance of flooding over 30 yrs
- 0.0%
- Est. flood insurance / yr
- $507 – $1,088
Fire risk 5/10 · Moderate
- Est. fire insurance / yr
- $666 – $1,236
Heat risk 8/10 · Major
- Hot days now (above 105°F)
- 7 days/yr
- Hot days in 30 yrs
- 16 days/yr
Wind risk 5/10 · Moderate
- Chance of severe wind over 30 yrs
- 22.0%
Air-quality risk 2/10 · Minimal
- Unhealthy air days now
- 0 days/yr
- Unhealthy air days in 30 yrs
- 1 days/yr
Risk factors via First Street. Map © Google.
Why this score? — see what drove the D grade
The composite is a weighted blend of 9 inputs, each scored 0–100. Each bar is that input's sub-score; the figure is the points it added to the 100-point composite (weight × sub-score).
- Cash flow +11.3/30.0
- ARV discount +9.0/15.0
- Schools +5.6/10.0
- Livability +3.4/5.0
- DSCR +3.3/10.0
- Rent growth +3.3/5.0
- 1% rule +2.7/10.0
- Condition / age +2.5/5.0
- Appreciation +0.0/10.0
$290,000
🖨 Deal sheet 📄 Offer letter ✓ Due diligence
Listing remarks MLS
Renovated townhome move-in ready! Freshly painted throughout this home includes new kitchen granite countertops and brand new flooring throughout! This three bedroom home is located in convenient location just mins. from downtown, shopping and I-95!
Key facts
- $80 HOA
- 2 parking spots
- Built 1998
Neighborhood map
What this means for you Summary
Snapshot
- This is a 3-bed/1.5-bath townhouse listed at $290k.
Deal economics
- At list price, monthly cash flow is $-104 ($-1k/yr) — negative.
- To cash-flow at today's rent, offer at most $272k (6.3% below list).
- To meet the 1% rule (rent ≥ 1% of price), the offer needs to be $224k (22.9% below list).
- Recommended offer: $224k (22.9% below list) — sets the bar for 1% rule.
- Cap rate 5.9% vs local median 3.6% in Fredericksburg — top-decile yield for the area; either an underpriced asset or a hidden risk that comps aren't pricing in. Stress-test before assuming the spread holds.
Location & tenants
- Location reads 67/100 on livability (#299 in VA) — a middle-class / working-renter tenant base. Strengths: health & safety A+, schools A, employment A-; Watch: crime F, commute F, cost of living F.
- Spotsylvania County Public School District (rural): math 54% / reading 71% proficiency, ranked #38 of 131 in VA (top 29%) — acceptable for families but not a draw, mixed tenant base, ~2y average lease.
- Market conditions: Rents rising (+3.1%/yr); 130 active listings in the ZIP; 1 comparable units currently listed for rent nearby; high-income renter base; 707 units permitted in Spotsylvania County in 2024 (0 in 5+ unit buildings).
Forward outlook
- Local home prices are declining (-3.0%/yr); year-one equity from $2k of loan paydown is wiped out by about $9k of value loss. Plan a longer hold.
- Spotsylvania County population projected at +17% by 2050 — long-run rental-demand tailwind backs the buy-and-hold thesis.
Negotiation context
- Only 3 days on market — expect competitive offers; lowballing is unlikely to land.
- 3 sale attempts since 20y ago with the ask held roughly flat each time — persistent listings suggest the price (not the market) is what's stuck; bring a comps-based counter.
Risks & watch-outs
- Climate carrying-cost: moderate wind risk, 22% chance of damaging wind over 30y; moderate wildfire risk; extreme-heat days projected 7→16/yr by 2055 (HVAC capex compounding) — expect insurance premiums to compound above CPI over the hold.
Questions for the listing agent
- What do current leases actually rent for vs. the listed asking? Can we see a recent rent roll and the last 12 months of T-12 income?
- What does the HOA fee cover, when was the last increase, and are there any pending special assessments or reserve-fund shortfalls?
- Is there a deadline driving the sale (1031 exchange, divorce, estate, relocation)? That informs how much negotiation room exists.
- Schools are A-rated — typically a magnet for longer-tenancy family renters. What's the average tenant stay here, and is there a school-zone premium baked into asking?
- Crime grade is F in this area — have there been break-ins, vandalism, or insurance claims at this property in the last 3 years? What carrier currently insures it and at what premium?
- The area grade is low — what's the realistic commute time and amenity access for the typical tenant pool here? Any planned neighborhood developments (good or bad) we should know about?
- What's the average days-on-market for RENTAL listings here right now (not sales)? A rising rental-DOM trend means longer vacancies and softer asking-rent achievability than the comps imply.
- What's the recent tenant-quality profile in this submarket — average credit score on applications, eviction rate, late-payment / NSF rate, and stable-employment percentage? A property-management company in the area should have these aggregated.
- How much new for-sale + rental construction is in the pipeline within 1–3 miles? Heavy new supply typically softens prices + rents 12–24 months out; constrained supply supports both.
Investment metrics
- 1% rule
- 0.77% ✗
- Cap rate
- 5.86%
- Cash-on-cash
- -1.53%
- DSCR
- 0.93
- GRM
- 10.8
CMA / ARV
- ARV (on-the-fly)
- $299,841
- Comps found
- 12
Show comp detail 12 sales within ~0.75 mi
| Address | Dist | Beds/Ba | Sqft | Sold | Price | $/sf | Match |
|---|---|---|---|---|---|---|---|
| 10612 Boxmeer Ct | 0.00mi | 3/1.5 | 1,123 (0%) | 1mo | $300,000 | $267 | 99 |
| 10602 Boxmeer Ct | 0.02mi | 3/2.0 | 1,123 (0%) | 8mo | $280,000 | $249 | 90 |
| 10606 Boxmeer Ct | 0.01mi | 3/2.5 | 1,123 (0%) | 8mo | $307,000 | $273 | 89 |
| 10512 Tidewater Plains Dr | 0.11mi | 3/2.5 | 1,123 (0%) | 3mo | $298,000 | $265 | 88 |
| 10510 Limburg Ct | 0.06mi | 2/2.0 (-1) | 1,123 (0%) | 3mo | $285,000 | $254 | 88 |
| 10606 Tidewater Plains Dr | 0.10mi | 2/2.0 (-1) | 1,123 (0%) | 4mo | $280,000 | $249 | 84 |
| 10613 Limburg Ct | 0.02mi | 2/2.5 (-1) | 1,123 (0%) | 12mo | $315,000 | $280 | 80 |
| 10503 Boxmeer Ct | 0.06mi | 2/2.0 (-1) | 1,123 (0%) | 13mo | $315,000 | $280 | 79 |
| 10505 Boxmeer Ct | 0.06mi | 2/2.0 (-1) | 1,116 (-1%) | 16mo | $315,000 | $282 | 76 |
| 10504 Limburg Ct | 0.07mi | 2/2.0 (-1) | 1,116 (-1%) | 16mo | $310,000 | $278 | 75 |
| 10515 Tidewater Plains Dr | 0.14mi | 3/2.0 | 1,247 (+11%) | 13mo | $325,000 | $261 | 62 |
| 10913 Bevin Dr | 0.49mi | 3/2.5 | 1,276 (+14%) | 14mo | $315,000 | $247 | 39 |
Match score weights: distance 35% · size 25% · config 20% · recency 20%. Top-matched comps best support the ARV.
Projected returns pro-forma
-3.0% appreciation · 3.12% rent growth · sell at horizon
- IRR
- -18.7%
- Equity multiple
- 0.34×
- Total profit
- $-53,365
- Equity at exit
- $43,240
- IRR
- -11.0%
- Equity multiple
- 0.33×
- Total profit
- $-54,047
- Equity at exit
- $25,074
Cash invested: $81,200 (down + closing). Projections, not guarantees.
Landlord ↔ Tenant lean methodology
- Overall (STATE)
- 55 Moderately Landlord-Leaning
- State Virginia
- 55 Moderately Landlord-Leaning · D+2
- County
- — inherits STATE
- City
- — inherits STATE
ZIP-level market 22408
- Home prices YoY
- -32.5%
- Rents YoY
- 3.1%
- Active inventory
- 130
- Price-to-rent
- 10.8×
Monthly cashflow live
- Estimated rent
- $2,235 medium interval (Pro) →
- Mortgage (P&I)
- −$1,521
- Tax from tax record
- −$148 /mo · $1,773/yr
- Insurance
- −$121
- HOA
- −$80
- Vacancy / Maint / Mgmt
- −$469
- Net cashflow
- $-104
Break-even live
UW: 25.0% down · 7.5% · 30yr · 1.5% tax · 5.0% vac · 8.0% maint · 8.0% mgmt
Financing live
Cash to close
- Down payment
- $72,500
- Closing costs
- $8,700
- Reserves months
- —
- Total cash needed
- —
Loan-product check · same deal, 3 products live
Conventional
25% down · 7.5% · 30yr
- Down + closing
- —
- Monthly P&I
- —
- Monthly cashflow
- —
- DSCR
- —
- Eligible?
- —
Personal DTI + credit; lowest rate.
DSCR
20% down · 8.5% · 30yr
- Down + closing
- —
- Monthly P&I
- —
- Monthly cashflow
- —
- DSCR
- —
- Eligible?
- —
No personal income docs; deal must DSCR.
Hard money
10% down · 12.0% · 12mo
- Down + closing
- —
- Monthly P&I
- —
- Monthly cashflow
- —
- DSCR
- —
- Eligible?
- —
Short-term bridge; refi at stabilization.
Rent comps 1 comps
| Address | Beds | Baths | Sqft | Rent | $/sqft | DOM | Units | Dist |
|---|---|---|---|---|---|---|---|---|
| 10502 Guilderland Ct Fredericksburg, VA | 2.0 | 2.0 | 1123 | $1,800 | $1.60 | 13d | 1 | 0.06mi |
HOA detail
- Monthly dues
- $80 · $960/yr
Listing history 13 events
-
2026-04-11status Pending
-
2026-04-09$290,000 Active
-
2026-03-20historical $290,000
-
2022-10-04soldstatus $270,000
-
2022-10-03soldstatus $270,000 Closed 249-char remark
Show marketing remark (249 chars)
Renovated townhome move-in ready! Freshly painted throughout this home includes new kitchen granite countertops and brand new flooring throughout! This three bedroom home is located in convenient location just mins. from downtown, shopping and I-95!
-
2022-09-15historical Active Under Contract 249-char remark
Show marketing remark (249 chars)
Renovated townhome move-in ready! Freshly painted throughout this home includes new kitchen granite countertops and brand new flooring throughout! This three bedroom home is located in convenient location just mins. from downtown, shopping and I-95!
-
2022-09-13$269,900 Active 249-char remark
Show marketing remark (249 chars)
Renovated townhome move-in ready! Freshly painted throughout this home includes new kitchen granite countertops and brand new flooring throughout! This three bedroom home is located in convenient location just mins. from downtown, shopping and I-95!
-
2022-09-09historical $269,900 249-char remark
Show marketing remark (249 chars)
Renovated townhome move-in ready! Freshly painted throughout this home includes new kitchen granite countertops and brand new flooring throughout! This three bedroom home is located in convenient location just mins. from downtown, shopping and I-95!
-
2006-04-20soldstatus $222,500
-
2006-04-19soldstatus $222,500 266-char remark
Show marketing remark (266 chars)
Cute as can be and perfect for 1st time homeowners! Townhome has been freshly painted and has new carpet & vinyl. Hardwood floors in LR w/ Bay Window, eat-in open kitchen w/ island, fenced rear yard, 3 BR's and conveniently located to F'burg, shopping and VRE!
-
2006-03-05historical 266-char remark
Show marketing remark (266 chars)
Cute as can be and perfect for 1st time homeowners! Townhome has been freshly painted and has new carpet & vinyl. Hardwood floors in LR w/ Bay Window, eat-in open kitchen w/ island, fenced rear yard, 3 BR's and conveniently located to F'burg, shopping and VRE!
-
2006-03-01$222,500 266-char remark
Show marketing remark (266 chars)
Cute as can be and perfect for 1st time homeowners! Townhome has been freshly painted and has new carpet & vinyl. Hardwood floors in LR w/ Bay Window, eat-in open kitchen w/ island, fenced rear yard, 3 BR's and conveniently located to F'burg, shopping and VRE!
-
1997-09-08soldstatus $106,722
ⓘ Source: listings_history table (triggers on properties + properties_extension) + one-shot
backfill from property_details.listing_events for pre-trigger history.
Tax reassessment forecast VA · Resets to sale price
- Current annual tax
- $1,773 · $148/mo
- Projected year-2 tax
- $2,378 · $198/mo
- Expected delta
- +$605/yr (+$50/mo · 34.1%)
ⓘ Screening estimate from a state-policy table — verify with the county assessor before closing.
Climate risk First Street
- Flood 1/10 Low FEMA zone X (unshaded) · 0% chance over 30 yrs
- Wildfire 5/10 Major
- Heat 8/10 Severe 7 d/yr ≥105°F today · 16 d/yr by 30 yrs out
- Wind 5/10 Major 22% chance of damaging wind over 30 yrs
- Air quality 2/10 Low 0 unhealthy d/yr today · 1 by 30 yrs out
Nearby sold comps map
Loading sold comps map…
Walkable amenities ~0.75 mi
Loading nearby amenities…
Taxation est. · year 1
- Rental income
- $26,823
- − Mortgage interest
- −$16,245
- − Property taxes
- −$1,773
- − Insurance
- −$1,450
- − Repairs & maintenance
- −$2,146
- − Management
- −$2,146
- − HOA
- −$960
- − Depreciation
- −$8,436
- Taxable loss
- −$6,332
- Est. tax savings @ 24.0%
- +$1,520
- After-tax cash flow
- $278/yr
For passive investors: Depreciation is non-cash, so a rental often shows a tax loss while cash-flowing — sheltering income. Rental losses are passive: they offset passive income freely, and up to $25,000/yr can offset ordinary (W-2) income if you actively participate and your MAGI is under $100k (phasing out to $0 by $150k); unused losses carry forward. On sale, claimed depreciation is recaptured at up to 25%, and gains may owe capital-gains tax (a 1031 exchange can defer both). Figures are a year-1 estimate at your 24.0% rate — not tax advice; consult a CPA.
Schools (NCES district)
- District
- Spotsylvania County Public School District
- NCES district ID
- 5103640
- Math proficiency
- 54% ▼ -25.00%
- Reading proficiency
- 71% ▼ -4.00%
- Median HH income
- $78,321
- Composite
- 55.79/100
- National rank
- #1213
- State rank
- #38 of 131 in VA
Livability — Fredericksburg
- Score
- 67/100
- State rank
- #299
- US rank
- #10735
Category grades
Schools grade is shown separately in the Schools card above.
Census & demographics
- County
- Spotsylvania County · 138,364 people
- City population
- 207,206
- Metro
- Washington-Arlington-Alexandria, DC-VA-MD-WV
- Population (ZIP)
- 31,586
- Household income
- $110,112
- Rent vs Own
- Severe rent burden
- 657.0
Population outlook (Spotsylvania County) Hauer SSP2
- Today (2025)
- 146,292 people
- By 2030
- 153,092 · +4.6%
- By 2040
- 164,270 · +12.3%
- By 2050
- 171,000 · +16.9%
- By 2075
- 183,080 · +25.1%
- By 2100
- 180,412 · +23.3%
Race, ethnicity, and origin ACS 2023
- Neighborhood character
- Diverse neighborhood (Simpson 0.60)
- Race & ethnicity
- White 59% Black 20% Hispanic / Latino 12% Two or more races 10% Asian 3%
- Hispanic origin (detail)
- Mexican 4% Puerto Rican 2%
- Common ancestry
- Italian 3% Romanian 2% Iranian 2%
- Foreign-born
- 10% · Canada, China
- Languages at home
- 86% English-only · Spanish 9% Other Indo-European 2% Other Asian/Pacific 1%
Political lean MEDSL · Spotsylvania
- 2024 margin
- Lean R (+8.6) · D 45.1% · R 53.7% · Other 1.2%
- 2008→2024 swing
- -1.7pp toward R · 2008: -6.9pp · 2024: -8.6pp
- All cycles
- 2024: R+8.6 2020: R+6.8 2016: R+16.8 2012: R+11.5 2008: R+6.9
Not yet ingested
- Civics
- —
Market trends
- HPI YoY
- ▼ -124.72%
- Current HPI
- 259.5759
- Rent YoY
- ▲ 3.12%
- Metro
- Washington-Arlington-Alexandria, DC-VA-MD-WV
- State GDP YoY
- ▲ 2.40%
- F500 in state
- 50
Industry mix (Fortune 500 HQ in VA)
| Industry | F500 HQs | Revenue |
|---|---|---|
| Aerospace / Defense | 4 | $236B |
|
||
| Technology / Defense | 3 | $32B |
|
||
| Financial Services | 2 | $176B |
|
||
| Utilities | 2 | $27B |
|
||
| Insurance | 2 | $25B |
|
||
| Technology | 2 | $15B |
|
||
Price history
+171.7% since first listed13 events — show timeline
- 2026-04-11 Pending — BRIGHT MLS
- 2026-04-09 Listed $290,000 BRIGHT MLS
- 2026-03-20 Coming Soon $290,000 BRIGHT MLS
- 2022-10-04 Sold (Public Records) $270,000 Public Records
- 2022-10-03 Sold (MLS) $270,000 BRIGHT MLS
- 2022-09-15 Contingent — BRIGHT MLS
- 2022-09-13 Listed $269,900 BRIGHT MLS
- 2022-09-09 Coming Soon $269,900 BRIGHT MLS
- 2006-04-20 Sold (Public Records) $222,500 Public Records
- 2006-04-19 Sold (MLS) $222,500 MRIS
- 2006-03-05 Delisted — MRIS
- 2006-03-01 Listed $222,500 MRIS
- 1997-09-08 Sold (Public Records) $106,722 Public Records
Property tax history
+2.7%/yrLatest (2025): $1,773 · +0.0% YoY. Source: county tax records.
Cash-flow waterfall
monthlySold comps — $/sqft
last 12 mo · ≤1 miLoading sold comps…