 🌊 Lakefront
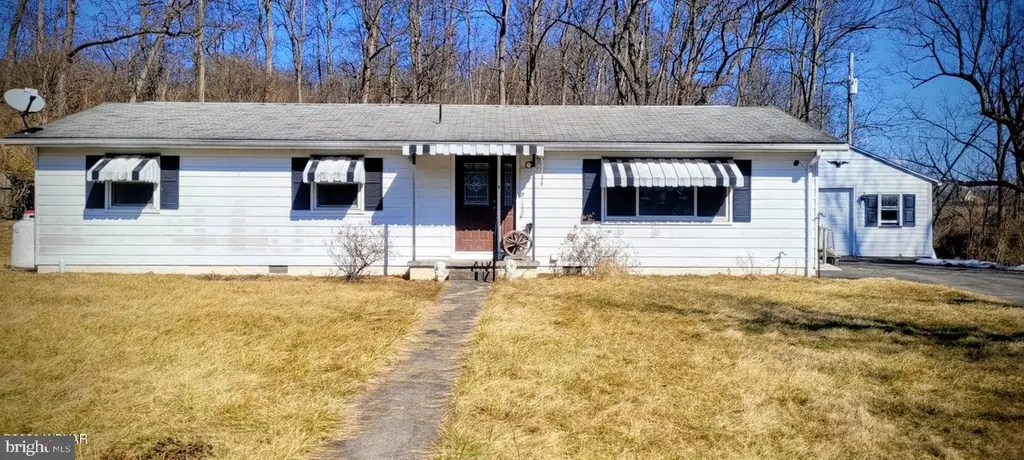
137 Firehouse Rd · Salona, PA
Flood risk No data
- FEMA flood zone
- —
- Chance of flooding over 30 yrs
- —
- Est. flood insurance / yr
- —
Fire risk No data
- Est. fire insurance / yr
- —
Heat risk No data
- Hot days now (above threshold)
- —
- Hot days in 30 yrs
- —
Wind risk No data
- Chance of severe wind over 30 yrs
- —
Air-quality risk No data
- Unhealthy air days now
- —
- Unhealthy air days in 30 yrs
- —
Risk factors via First Street. Map © Google.
Why this score? — see what drove the D- grade
The composite is a weighted blend of 9 inputs, each scored 0–100. Each bar is that input's sub-score; the figure is the points it added to the 100-point composite (weight × sub-score).
- Cash flow +10.3/30.0
- ARV discount +9.2/15.0
- Schools +3.2/10.0
- DSCR +3.0/10.0
- Rent growth +2.5/5.0
- Livability +2.5/5.0
- Condition / age +2.5/5.0
- 1% rule +2.1/10.0
- Appreciation +0.0/10.0
$159,000
🖨 Deal sheet (PDF) 📄 Offer letter ✓ Due diligence
Listing remarks MLS
Updated doublewide offering newer kitchen with island, 2-sinks, slow closing drawers, new windows and walk-in shower. Please verify all room sizes. All inclusions are being offered as-is.
Key facts
- Newer kitchen
- Walk-in shower
- Island
Tags
Neighborhood map
What this means for you Summary
Snapshot
- This is a 3-bed/1.5-bath single-family listed at $159k.
Deal economics
- At list price, monthly cash flow is $-87 ($-1k/yr) — negative.
- To cash-flow at today's rent, offer at most $144k (9.7% below list).
- To meet the 1% rule (rent ≥ 1% of price), the offer needs to be $113k (28.8% below list).
- Recommended offer: $113k (28.8% below list) — sets the bar for 1% rule.
Location & tenants
- Location reads: area grade D — affects rentability + tenant quality, not the cash-flow math above.
- Keystone Central SD (town): math 32% / reading 44% proficiency, ranked #384 of 539 in PA (top 71%) — families likely to look elsewhere, expect single-tenant / working-renter base with shorter leases.
- Market conditions: 31 active listings in the ZIP; 44 units permitted in Clinton County in 2024 (0 in 5+ unit buildings).
Forward outlook
- Local home prices are declining (-3.0%/yr); year-one equity from $1k of loan paydown is wiped out by about $5k of value loss. Plan a longer hold.
- Clinton County population projected to shrink 5% by 2050 — rents likely to lag national; underwrite the cash flow, not the appreciation.
Negotiation context
- It's been on market 47 days — a 3% lower offer ($154k) is reasonable based on typical stale-listing flexibility.
- 2 sale attempts; this cycle's ask has dropped $10k (6%) from the opening price — seller is motivated, your offer sets the floor, not the list.
Questions for the listing agent
- What do current leases actually rent for vs. the listed asking? Can we see a recent rent roll and the last 12 months of T-12 income?
- It's been on market 47 days. Have you received any prior offers? Is the seller open to a 29% concession, seller financing, or rate buy-down credit?
- Built in 1975 — when were the roof, HVAC, electrical panel, plumbing, and water heater last replaced?
- Is there a deadline driving the sale (1031 exchange, divorce, estate, relocation)? That informs how much negotiation room exists.
- The area grade is low — what's the realistic commute time and amenity access for the typical tenant pool here? Any planned neighborhood developments (good or bad) we should know about?
- This sits on a lake — are riparian / water-frontage rights deeded with the parcel? Any dock permits, shoreline easements, or HOA water-use restrictions?
- What's the documented flood / surge / shoreline-erosion history here (FEMA AND non-FEMA — e.g., storm surge, creek backup, septic-field saturation)?
- Any water-quality or seasonal algae-bloom issues that affect tenant satisfaction or short-term-rental demand?
- What's the average days-on-market for RENTAL listings here right now (not sales)? A rising rental-DOM trend means longer vacancies and softer asking-rent achievability than the comps imply.
- What's the recent tenant-quality profile in this submarket — average credit score on applications, eviction rate, late-payment / NSF rate, and stable-employment percentage? A property-management company in the area should have these aggregated.
- How much new for-sale + rental construction is in the pipeline within 1–3 miles? Heavy new supply typically softens prices + rents 12–24 months out; constrained supply supports both.
Investment metrics
- 1% rule
- 0.71% ✗
- Cap rate
- 5.63%
- Cash-on-cash
- -2.36%
- DSCR
- 0.90
- GRM
- 11.7
CMA / ARV
- ARV (median comp)
- $165,154
- List price
- $159,000
- Delta
- -3.73%
- Verdict
- FAIR
- Comps
- 6 within 1.0 mi
Show comp detail 1 sale within ~0.75 mi
| Address | Dist | Beds/Ba | Sqft | Sold | Price | $/sf | Match |
|---|---|---|---|---|---|---|---|
| 519 Long Run Rd | 0.09mi | 2/1.5 (-1) | 1,224 (-2%) | 22mo | $140,000 | $114 | 69 |
Match score weights: distance 35% · size 25% · config 20% · recency 20%. Top-matched comps best support the ARV.
Projected returns pro-forma
-3.0% appreciation · 3.0% rent growth · sell at horizon
- IRR
- -20.3%
- Equity multiple
- 0.30×
- Total profit
- $-31,385
- Equity at exit
- $23,707
- IRR
- -13.4%
- Equity multiple
- 0.22×
- Total profit
- $-34,720
- Equity at exit
- $13,747
Cash invested: $44,520 (down + closing). Projections, not guarantees.
Landlord ↔ Tenant lean methodology
- Overall (STATE)
- 62 Landlord-Friendly
- State Pennsylvania
- 62 Landlord-Friendly · EVEN
- County
- — inherits STATE
- City
- — inherits STATE
ZIP-level market 17751
- Home prices YoY
- -18.1%
- Active inventory
- 31
- Price-to-rent
- 11.7×
Monthly cashflow live
- Estimated rent
- $1,132 medium interval (Pro) →
- Mortgage (P&I)
- −$834
- Tax from tax record
- −$81 /mo · $975/yr
- Insurance
- −$66
- HOA
- −$0
- Vacancy / Maint / Mgmt
- −$238
- Net cashflow
- $-87
Break-even live
Sensitivity live
| Price | -10% $3 | -5% $-42 | +0% $-87 | +5% $-132 | +10% $-177 |
|---|---|---|---|---|---|
| Rent | -10% $-177 | -5% $-132 | +0% $-87 | +5% $-43 | +10% $2 |
| Rate | -1.0pp $-7 | -0.5pp $-47 | base $-87 | +0.5pp $-129 | +1.0pp $-170 |
UW: 25.0% down · 7.5% · 30yr · 1.5% tax · 5.0% vac · 8.0% maint · 8.0% mgmt
Financing live
Cash to close
- Down payment
- $39,750
- Closing costs
- $4,770
- Reserves months
- —
- Total cash needed
- —
Loan-product check · same deal, 3 products live
Conventional
25% down · 7.5% · 30yr
- Down + closing
- —
- Monthly P&I
- —
- Monthly cashflow
- —
- DSCR
- —
- Eligible?
- —
Personal DTI + credit; lowest rate.
DSCR
20% down · 8.5% · 30yr
- Down + closing
- —
- Monthly P&I
- —
- Monthly cashflow
- —
- DSCR
- —
- Eligible?
- —
No personal income docs; deal must DSCR.
Hard money
10% down · 12.0% · 12mo
- Down + closing
- —
- Monthly P&I
- —
- Monthly cashflow
- —
- DSCR
- —
- Eligible?
- —
Short-term bridge; refi at stabilization.
Listing history 9 events
-
2026-06-04statusdays on market $159,000 Pending 47 DOM
-
2026-06-02days on market $159,000 Active 46 DOM
-
2026-06-01days on market $159,000 Active 45 DOM
-
2026-05-31days on market $159,000 Active 44 DOM
-
2026-05-31days on market $159,000 Active 43 DOM
-
2026-05-13price $159,000 187-char remark
Show marketing remark (187 chars)
Updated doublewide offering newer kitchen with island, 2-sinks, slow closing drawers, new windows and walk-in shower. Please verify all room sizes. All inclusions are being offered as-is.
-
2026-05-06price $159,000 187-char remark
Show marketing remark (187 chars)
Updated doublewide offering newer kitchen with island, 2-sinks, slow closing drawers, new windows and walk-in shower. Please verify all room sizes. All inclusions are being offered as-is.
-
2026-04-17$169,000 Active 187-char remark
Show marketing remark (187 chars)
Updated doublewide offering newer kitchen with island, 2-sinks, slow closing drawers, new windows and walk-in shower. Please verify all room sizes. All inclusions are being offered as-is.
-
2026-04-13$169,000 Active 187-char remark
Show marketing remark (187 chars)
Updated doublewide offering newer kitchen with island, 2-sinks, slow closing drawers, new windows and walk-in shower. Please verify all room sizes. All inclusions are being offered as-is.
ⓘ Source: listings_history table (triggers on properties + properties_extension) + one-shot
backfill from property_details.listing_events for pre-trigger history.
Tax reassessment forecast PA · Partial reset (capped growth)
- Current annual tax
- $975 · $81/mo
- Projected year-2 tax
- $1,744 · $145/mo
- Expected delta
- +$769/yr (+$64/mo · 78.8%)
ⓘ Screening estimate from a state-policy table — verify with the county assessor before closing.
Nearby sold comps map
Loading sold comps map…
Walkable amenities ~0.75 mi
Loading nearby amenities…
Taxation est. · year 1
- Rental income
- $13,579
- − Mortgage interest
- −$8,906
- − Property taxes
- −$975
- − Insurance
- −$795
- − Repairs & maintenance
- −$1,086
- − Management
- −$1,086
- − Depreciation
- −$4,625
- Taxable loss
- −$3,896
- Est. tax savings @ 24.0%
- +$935
- After-tax cash flow
- $-114/yr
For passive investors: Depreciation is non-cash, so a rental often shows a tax loss while cash-flowing — sheltering income. Rental losses are passive: they offset passive income freely, and up to $25,000/yr can offset ordinary (W-2) income if you actively participate and your MAGI is under $100k (phasing out to $0 by $150k); unused losses carry forward. On sale, claimed depreciation is recaptured at up to 25%, and gains may owe capital-gains tax (a 1031 exchange can defer both). Figures are a year-1 estimate at your 24.0% rate — not tax advice; consult a CPA.
Schools (NCES district)
- District
- Keystone Central SD
- NCES district ID
- 4212725
- Math proficiency
- 32% ▼ -6.00%
- Reading proficiency
- 44% ▼ -10.00%
- Median HH income
- $42,713
- Composite
- 32.09/100
- National rank
- #5810
- State rank
- #384 of 539 in PA
Livability — Salona
No livability data for this city. (Only ~50 U.S. cities are tracked.)
Census & demographics
- Census place
- Salona, PA
- Population (ZIP)
- 7,145
Population outlook (Clinton County) Hauer SSP2
- Today (2025)
- 39,048 people
- By 2030
- 38,812 · -0.6%
- By 2040
- 38,011 · -2.7%
- By 2050
- 36,931 · -5.4%
- By 2075
- 34,077 · -12.7%
- By 2100
- 29,683 · -24.0%
Race, ethnicity, and origin ACS 2023
- Neighborhood character
- Predominantly White (96%)
- Race & ethnicity
- White 96% Hispanic / Latino 2% Two or more races 2%
- Common ancestry
- Iranian 3% Lithuanian 3% Polish 2%
- Foreign-born
- 1%
- Languages at home
- 92% English-only · German/W. Germanic 6%
Political lean MEDSL · Clinton
- 2024 margin
- Solid R (+40.9) · D 29.1% · R 70.0%
- 2008→2024 swing
- -38.1pp toward R · 2008: -2.8pp · 2024: -40.9pp
- All cycles
- 2024: R+40.9 2020: R+36.3 2016: R+34.8 2012: R+11.3 2008: R+2.8
Not yet ingested
- Civics
- —
Market trends
- HPI YoY
- ▼ -34.22%
- Current HPI
- 154.7316
- Rent YoY
- —
- Metro
- —
- State GDP YoY
- ▲ 1.68%
- F500 in state
- 34
Industry mix (Fortune 500 HQ in PA)
| Industry | F500 HQs | Revenue |
|---|---|---|
| Healthcare | 2 | $309B |
|
||
| Insurance | 2 | $27B |
|
||
| Telecommunications / Media | 1 | $124B |
|
||
| Industrial Distribution | 1 | $22B |
|
||
| Financial Services | 1 | $20B |
|
||
| Chemicals / Materials | 1 | $18B |
|
||
Price history
-5.9% since first listed4 events — show timeline
- 2026-05-13 Price Changed $159,000 BRIGHT MLS
- 2026-05-06 Price Changed $159,000 WBVAR
- 2026-04-17 Listed $169,000 BRIGHT MLS
- 2026-04-13 Listed $169,000 WBVAR
Property tax history
+2.4%/yrLatest (2026): $975 · +1.2% YoY. Source: county tax records.
Cash-flow waterfall
monthlySold comps — $/sqft
last 12 mo · ≤1 miLoading sold comps…