 Multi-family
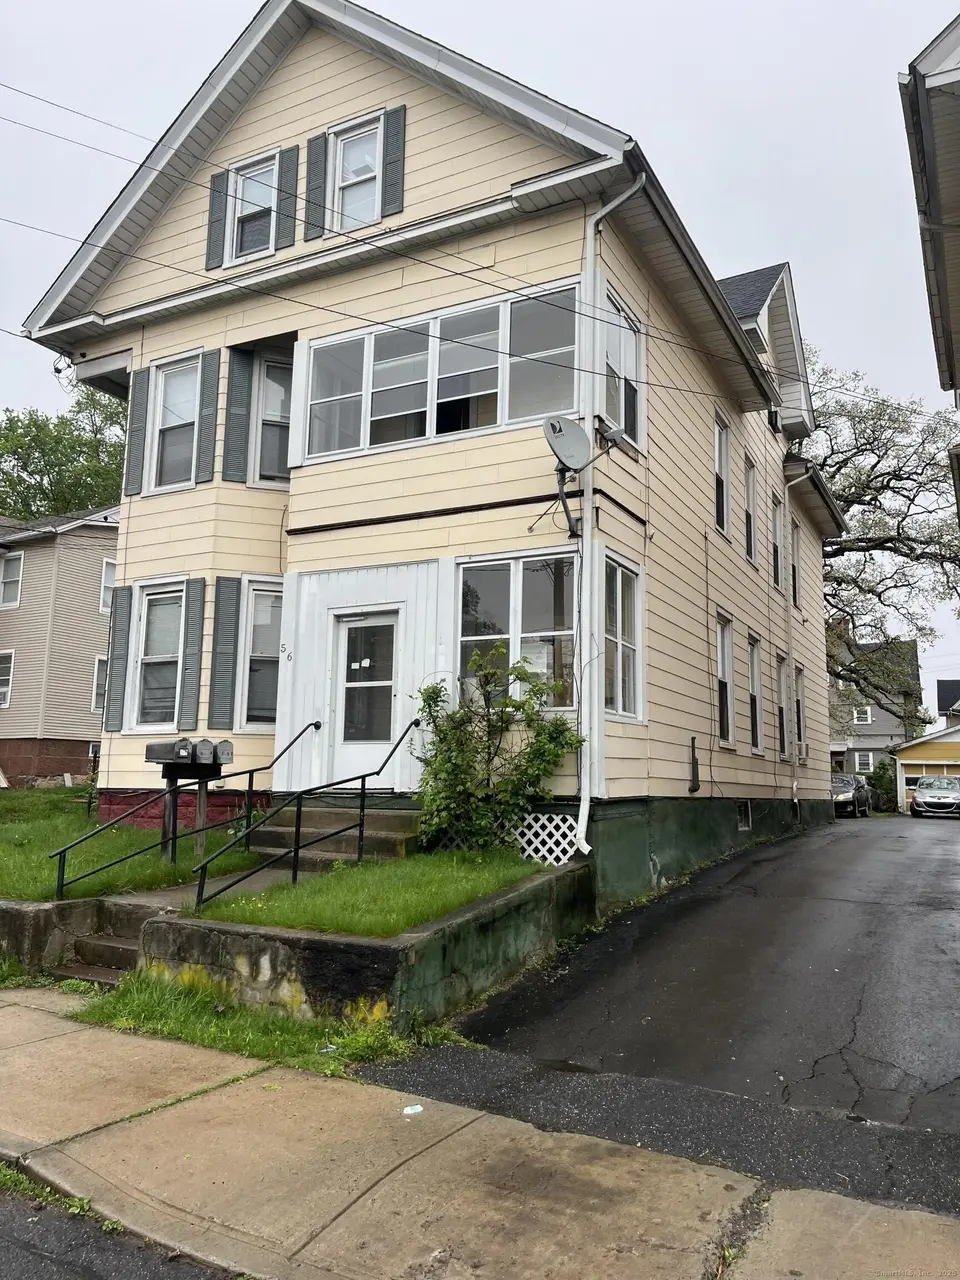
56 N First St · Meriden, CT
Flood risk 1/10 · Minimal
- FEMA flood zone
- X (unshaded)
- Chance of flooding over 30 yrs
- 0.0%
- Est. flood insurance / yr
- $473 – $860
Fire risk 1/10 · Minimal
- Est. fire insurance / yr
- $829 – $1,539
Heat risk 5/10 · Moderate
- Hot days now (above 99°F)
- 7 days/yr
- Hot days in 30 yrs
- 17 days/yr
Wind risk 6/10 · Moderate
- Chance of severe wind over 30 yrs
- 27.0%
Air-quality risk 4/10 · Minor
- Unhealthy air days now
- 3 days/yr
- Unhealthy air days in 30 yrs
- 5 days/yr
Risk factors via First Street. Map © Google.
Why this score? — see what drove the D- grade
The composite is a weighted blend of 9 inputs, each scored 0–100. Each bar is that input's sub-score; the figure is the points it added to the 100-point composite (weight × sub-score).
- Cash flow +15.0/30.0
- 1% rule +5.0/10.0
- DSCR +5.0/10.0
- Livability +4.2/5.0
- Schools +3.0/10.0
- Rent growth +2.5/5.0
- Condition / age +2.5/5.0
- ARV discount +0.0/15.0
- Appreciation +0.0/10.0
$475,000
🖨 Deal sheet 📄 Offer letter ✓ Due diligence
Multi-family units
County records classify this as Multi-Family (2-4 Unit). Listing-text estimate: 1 unit. estimate disagrees with records
Listing remarks MLS
This property has been extensively renovated: new roof, plumbing from Head to Toe, HVAC from head to toe, flooring, electrical, etc. 8 bedrooms which makes this property a cash cow. THIS PROPERTY IS PART OF 37 UNIT PORTFOLIO FOR SALE, can be purchased seperately.
Key facts
- Nearby amenities
- 4,356 sq ft lot
- Built 1890
Tags
Neighborhood map
What this means for you Summary
Snapshot
- This is a 6-bed/3.0-bath multifamily listed at $475k.
Deal economics
- At list price, monthly cash flow is $52k ($627k/yr) — positive.
- The deal already cash-flows at list — no discount required.
- Meets the 1% rule at list price ($70k rent vs $475k).
- Recommended offer: $418k (12.0% below list) — sets the bar for market timing.
- Cap rate 138.3% vs local median 4.2% in Meriden — top-decile yield for the area; either an underpriced asset or a hidden risk that comps aren't pricing in. Stress-test before assuming the spread holds.
Location & tenants
- Location reads 85/100 on livability (#4 in CT, #505 nationally) — a professional / high-income tenant draw. Strengths: amenities A+, housing A+, health & safety A+.
- Meriden School District (suburban): math 27% / reading 41% proficiency, ranked #116 of 153 in CT (top 76%) — families likely to look elsewhere, expect single-tenant / working-renter base with shorter leases; 61% free/reduced lunch — lower-income household profile, screen leases tightly.
- Market conditions: 70 active listings in the ZIP; 1 comparable units currently listed for rent nearby; 1,059 units permitted in South Central Connecticut Planning Region in 2024 (779 in 5+ unit buildings).
- At $70,102/mo this rent would consume 1181% of the median local household income ($71k/yr) (locally 973% of renters already pay >50% of income on rent) — very limited rent-growth headroom before tenants either downsize or default.
Forward outlook
- Local home prices are declining (-3.0%/yr); year-one equity from $3k of loan paydown is wiped out by about $14k of value loss. Plan a longer hold.
- At projected returns (-3.0% appreciation + 3.0% rent growth), your $133k cash investment doubles in ~1 year — after that, you're playing with house money.
Negotiation context
- It's been on market 400 days — a 12% lower offer ($418k) is reasonable based on typical stale-listing flexibility.
- 5 sale attempts since 17y ago; this cycle's ask has dropped $110k (19%) from the opening price — seller is motivated, your offer sets the floor, not the list.
- Current owner paid $112k; list at $475k implies a 324% gain — meaningful room to come down on a strong offer.
Risks & watch-outs
- Watch-outs: built in 1890 — expect roof / HVAC / electrical / plumbing capex.
- Climate carrying-cost: major wind risk, 27% chance of damaging wind over 30y; extreme-heat days projected 7→17/yr by 2055 (HVAC capex compounding) — expect insurance premiums to compound above CPI over the hold.
Questions for the listing agent
- It's been on market 400 days. Have you received any prior offers? Is the seller open to a 12% concession, seller financing, or rate buy-down credit?
- Built in 1890 — when were the roof, HVAC, electrical panel, plumbing, and water heater last replaced?
- Why hasn't it sold? Are there any deal-killer items the seller is aware of (foundation, flood, title, zoning, code violations)?
- Is there a deadline driving the sale (1031 exchange, divorce, estate, relocation)? That informs how much negotiation room exists.
- The area grade is low — what's the realistic commute time and amenity access for the typical tenant pool here? Any planned neighborhood developments (good or bad) we should know about?
- What's the average days-on-market for RENTAL listings here right now (not sales)? A rising rental-DOM trend means longer vacancies and softer asking-rent achievability than the comps imply.
- What's the recent tenant-quality profile in this submarket — average credit score on applications, eviction rate, late-payment / NSF rate, and stable-employment percentage? A property-management company in the area should have these aggregated.
- How much new apartment / multifamily construction is in the pipeline within 1–3 miles? Heavy new supply (>2% of stock underway) typically softens rents 12–24 months out; light construction supports rent growth.
Investment metrics
- 1% rule
- 14.76% ✓
- Cap rate
- 138.34%
- Cash-on-cash
- 471.60%
- DSCR
- 21.98
- GRM
- 0.6
CMA / ARV
- ARV (median comp)
- $407,139
- List price
- $475,000
- Delta
- 16.67%
- Verdict
- OVERPRICED
- Comps
- 20 within 1.0 mi
Show comp detail 12 sales within ~0.75 mi
| Address | Dist | Beds/Ba | Sqft | Sold | Price | $/sf | Match |
|---|---|---|---|---|---|---|---|
| 42 Maple St | 0.23mi | 6/3.0 | 3,126 (+4%) | 11mo | $367,500 | $118 | 72 |
| 85 Goodwill Ave | 0.30mi | 6/3.0 | 2,705 (-10%) | 6mo | $500,000 | $185 | 65 |
| 221 Grove St | 0.53mi | 7/3.0 (+1) | 2,898 (-3%) | 4mo | $375,000 | $129 | 62 |
| 27 Windsor Ave | 0.21mi | 6/2.0 | 2,578 (-14%) | 2mo | $385,000 | $149 | 62 |
| 70 Summer St | 0.50mi | 6/3.0 | 3,075 (+3%) | 15mo | $412,050 | $134 | 60 |
| 52 Cherry St | 0.38mi | 6/4.0 | 2,728 (-9%) | 10mo | $420,000 | $154 | 56 |
| 31 Winthrop St | 0.53mi | 5/3.0 (-1) | 2,738 (-8%) | 1mo | $430,000 | $157 | 55 |
| 49 Foster St | 0.54mi | 7/2.5 (+1) | 2,990 (0%) | 16mo | $278,000 | $93 | 54 |
| 126 Pleasant St | 0.64mi | 7/2.0 (+1) | 2,986 (-0%) | 11mo | $397,000 | $133 | 52 |
| 122 Willow St | 0.57mi | 6/6.0 | 3,162 (+6%) | 2mo | $670,000 | $212 | 50 |
| 2 Springdale Ave | 0.43mi | 6/4.0 | 2,604 (-13%) | 6mo | $295,000 | $113 | 50 |
| 23 Akron St | 0.69mi | 7/2.0 (+1) | 2,877 (-4%) | 16mo | $280,000 | $97 | 40 |
Match score weights: distance 35% · size 25% · config 20% · recency 20%. Top-matched comps best support the ARV.
Projected returns pro-forma
-3.0% appreciation · 3.0% rent growth · sell at horizon
- IRR
- —
- Equity multiple
- 25.46×
- Total profit
- $3,252,999
- Equity at exit
- $70,824
- IRR
- —
- Equity multiple
- 54.56×
- Total profit
- $7,123,166
- Equity at exit
- $41,069
Cash invested: $133,000 (down + closing). Projections, not guarantees.
Landlord ↔ Tenant lean methodology
- Overall (STATE)
- 27 Tenant-Leaning
- State Connecticut
- 27 Tenant-Leaning · D+7
- County
- — inherits STATE
- City
- — inherits STATE
ZIP-level market 06451
- Home prices YoY
- -14.2%
- Active inventory
- 70
- Price-to-rent
- 20.9×
Monthly cashflow live
- Estimated rent
- $70,102 medium interval (Pro) →
- Mortgage (P&I)
- −$2,491
- Tax from tax record
- −$423 /mo · $5,077/yr
- Insurance
- −$198
- HOA
- −$0
- Vacancy / Maint / Mgmt
- −$14,721
- Net cashflow
- $52,269
Break-even live
37-unit breakdown (identical units grouped — click to expand)
| Units | Beds | Baths | Est. rent |
|---|---|---|---|
| 37× units | 12 | 3 | $70,115 |
| #1 | 12 | 3 | $1,895 |
| #2 | 12 | 3 | $1,895 |
| #3 | 12 | 3 | $1,895 |
| #4 | 12 | 3 | $1,895 |
| #5 | 12 | 3 | $1,895 |
| #6 | 12 | 3 | $1,895 |
| #7 | 12 | 3 | $1,895 |
| #8 | 12 | 3 | $1,895 |
| #9 | 12 | 3 | $1,895 |
| #10 | 12 | 3 | $1,895 |
| #11 | 12 | 3 | $1,895 |
| #12 | 12 | 3 | $1,895 |
| #13 | 12 | 3 | $1,895 |
| #14 | 12 | 3 | $1,895 |
| #15 | 12 | 3 | $1,895 |
| #16 | 12 | 3 | $1,895 |
| #17 | 12 | 3 | $1,895 |
| #18 | 12 | 3 | $1,895 |
| #19 | 12 | 3 | $1,895 |
| #20 | 12 | 3 | $1,895 |
| #21 | 12 | 3 | $1,895 |
| #22 | 12 | 3 | $1,895 |
| #23 | 12 | 3 | $1,895 |
| #24 | 12 | 3 | $1,895 |
| #25 | 12 | 3 | $1,895 |
| #26 | 12 | 3 | $1,895 |
| #27 | 12 | 3 | $1,895 |
| #28 | 12 | 3 | $1,895 |
| #29 | 12 | 3 | $1,895 |
| #30 | 12 | 3 | $1,895 |
| #31 | 12 | 3 | $1,895 |
| #32 | 12 | 3 | $1,895 |
| #33 | 12 | 3 | $1,895 |
| #34 | 12 | 3 | $1,895 |
| #35 | 12 | 3 | $1,895 |
| #36 | 12 | 3 | $1,895 |
| #37 | 12 | 3 | $1,895 |
| Total (37 units) | $70,102 | ||
UW: 25.0% down · 7.5% · 30yr · 1.5% tax · 5.0% vac · 8.0% maint · 8.0% mgmt
Financing live
Cash to close
- Down payment
- $118,750
- Closing costs
- $14,250
- Reserves months
- —
- Total cash needed
- —
Loan-product check · same deal, 3 products live
Conventional
25% down · 7.5% · 30yr
- Down + closing
- —
- Monthly P&I
- —
- Monthly cashflow
- —
- DSCR
- —
- Eligible?
- —
Personal DTI + credit; lowest rate.
DSCR
20% down · 8.5% · 30yr
- Down + closing
- —
- Monthly P&I
- —
- Monthly cashflow
- —
- DSCR
- —
- Eligible?
- —
No personal income docs; deal must DSCR.
Hard money
10% down · 12.0% · 12mo
- Down + closing
- —
- Monthly P&I
- —
- Monthly cashflow
- —
- DSCR
- —
- Eligible?
- —
Short-term bridge; refi at stabilization.
Rent comps 1 comps
| Address | Beds | Baths | Sqft | Rent | $/sqft | DOM | Units | Dist |
|---|---|---|---|---|---|---|---|---|
| 55 Liberty St Meriden, CT | 5.0 | 3.0 | 2215 | $2,900 | $1.31 | 3d | 1 | 0.77mi |
Listing history 27 events
-
2026-06-18days on market $475,000 Active 400 DOM
-
2026-06-17days on market $475,000 Active 399 DOM
-
2026-06-16days on market $475,000 Active 398 DOM
-
2026-06-15days on market $475,000 Active 397 DOM
-
2026-06-14days on market $475,000 Active 395 DOM
-
2026-06-10days on market $475,000 Active 392 DOM
-
2026-06-09days on market $475,000 Active 391 DOM
-
2026-06-08days on market $475,000 Active 390 DOM
-
2026-06-07days on market $475,000 Active 389 DOM
-
2026-06-05days on market $475,000 Active 386 DOM
-
2026-06-03days on market $475,000 Active 385 DOM
-
2026-06-03days on market $475,000 Active 384 DOM
-
2026-06-01days on market $475,000 Active 383 DOM
-
2026-05-31days on market $475,000 Active 382 DOM
-
2025-08-06price $475,000 263-char remark
Show marketing remark (263 chars)
This property has been extensively renovated: new roof, plumbing from Head to Toe, HVAC from head to toe, flooring, electrical, etc. 8 bedrooms which makes this property a cash cow. THIS PROPERTY IS PART OF 37 UNIT PORTFOLIO FOR SALE, can be purchased seperately.
-
2025-06-27price $525,000 263-char remark
Show marketing remark (263 chars)
This property has been extensively renovated: new roof, plumbing from Head to Toe, HVAC from head to toe, flooring, electrical, etc. 8 bedrooms which makes this property a cash cow. THIS PROPERTY IS PART OF 37 UNIT PORTFOLIO FOR SALE, can be purchased seperately.
-
2025-05-14$585,000 Active 263-char remark
Show marketing remark (263 chars)
This property has been extensively renovated: new roof, plumbing from Head to Toe, HVAC from head to toe, flooring, electrical, etc. 8 bedrooms which makes this property a cash cow. THIS PROPERTY IS PART OF 37 UNIT PORTFOLIO FOR SALE, can be purchased seperately.
-
2020-06-22soldstatus $112,000 Closed 547-char remark
Show marketing remark (547 chars)
Opportunity is here! Don't let it pass! Triplex - 3 family unit. Each unit is 2 bed, 1 bath and approximately 1000 sq feet each. Large room including bedroom sizes with many walk-in closets. Enclosed porch on 1st and 2nd floor. Small deck/balcony off second floor back. Basement with mechanicals. Spacious backyard. This property is a perfect starter for owner occupant and investor! Bring your ideas and contractors and schedule a viewing today! Located off W. Main Street near food, shopping and more! Finance Terms: Cash, Conventional, FHA 203K
-
2020-05-18status Under Contract 547-char remark
Show marketing remark (547 chars)
Opportunity is here! Don't let it pass! Triplex - 3 family unit. Each unit is 2 bed, 1 bath and approximately 1000 sq feet each. Large room including bedroom sizes with many walk-in closets. Enclosed porch on 1st and 2nd floor. Small deck/balcony off second floor back. Basement with mechanicals. Spacious backyard. This property is a perfect starter for owner occupant and investor! Bring your ideas and contractors and schedule a viewing today! Located off W. Main Street near food, shopping and more! Finance Terms: Cash, Conventional, FHA 203K
-
2020-05-15status Active 547-char remark
Show marketing remark (547 chars)
Opportunity is here! Don't let it pass! Triplex - 3 family unit. Each unit is 2 bed, 1 bath and approximately 1000 sq feet each. Large room including bedroom sizes with many walk-in closets. Enclosed porch on 1st and 2nd floor. Small deck/balcony off second floor back. Basement with mechanicals. Spacious backyard. This property is a perfect starter for owner occupant and investor! Bring your ideas and contractors and schedule a viewing today! Located off W. Main Street near food, shopping and more! Finance Terms: Cash, Conventional, FHA 203K
-
2020-03-03status Under Contract 547-char remark
Show marketing remark (547 chars)
Opportunity is here! Don't let it pass! Triplex - 3 family unit. Each unit is 2 bed, 1 bath and approximately 1000 sq feet each. Large room including bedroom sizes with many walk-in closets. Enclosed porch on 1st and 2nd floor. Small deck/balcony off second floor back. Basement with mechanicals. Spacious backyard. This property is a perfect starter for owner occupant and investor! Bring your ideas and contractors and schedule a viewing today! Located off W. Main Street near food, shopping and more! Finance Terms: Cash, Conventional, FHA 203K
-
2020-02-27$120,000 Active 547-char remark
Show marketing remark (547 chars)
Opportunity is here! Don't let it pass! Triplex - 3 family unit. Each unit is 2 bed, 1 bath and approximately 1000 sq feet each. Large room including bedroom sizes with many walk-in closets. Enclosed porch on 1st and 2nd floor. Small deck/balcony off second floor back. Basement with mechanicals. Spacious backyard. This property is a perfect starter for owner occupant and investor! Bring your ideas and contractors and schedule a viewing today! Located off W. Main Street near food, shopping and more! Finance Terms: Cash, Conventional, FHA 203K
-
2010-08-31historical
-
2009-09-11$229,900
-
2009-07-13historical
-
2009-01-14$240,000
-
1997-12-30soldstatus $77,000
ⓘ Source: listings_history table (triggers on properties + properties_extension) + one-shot
backfill from property_details.listing_events for pre-trigger history.
Tax reassessment forecast CT · Partial reset (capped growth)
- Current annual tax
- $5,077 · $423/mo
- Projected year-2 tax
- $7,621 · $635/mo
- Expected delta
- +$2,544/yr (+$212/mo · 50.1%)
ⓘ Screening estimate from a state-policy table — verify with the county assessor before closing.
Climate risk First Street
- Flood 1/10 Low FEMA zone X (unshaded) · 0% chance over 30 yrs
- Wildfire 1/10 Low
- Heat 5/10 Major 7 d/yr ≥99°F today · 17 d/yr by 30 yrs out
- Wind 6/10 Major 27% chance of damaging wind over 30 yrs
- Air quality 4/10 Moderate 3 unhealthy d/yr today · 5 by 30 yrs out
Nearby sold comps map
Loading sold comps map…
Walkable amenities ~0.75 mi
Loading nearby amenities…
Taxation est. · year 1
- Rental income
- $841,224
- − Mortgage interest
- −$26,607
- − Property taxes
- −$5,077
- − Insurance
- −$2,375
- − Repairs & maintenance
- −$67,298
- − Management
- −$67,298
- − Depreciation
- −$13,818
- Taxable income
- $658,751
- Est. tax owed @ 24.0%
- −$158,100
- After-tax cash flow
- $469,123/yr
For passive investors: Depreciation is non-cash, so a rental often shows a tax loss while cash-flowing — sheltering income. Rental losses are passive: they offset passive income freely, and up to $25,000/yr can offset ordinary (W-2) income if you actively participate and your MAGI is under $100k (phasing out to $0 by $150k); unused losses carry forward. On sale, claimed depreciation is recaptured at up to 25%, and gains may owe capital-gains tax (a 1031 exchange can defer both). Figures are a year-1 estimate at your 24.0% rate — not tax advice; consult a CPA.
Schools (NCES district)
- District
- Meriden School District
- NCES district ID
- 0902400
- Math proficiency
- 27% ▼ -8.00%
- Reading proficiency
- 41% ▼ -6.00%
- Median HH income
- $53,883
- Composite
- 29.84/100
- National rank
- #6413
- State rank
- #116 of 153 in CT
Livability — Meriden
- Score
- 85/100
- State rank
- #4
- US rank
- #505
Category grades
Schools grade is shown separately in the Schools card above.
Census & demographics
- Census place
- Meriden, CT
- County
- New Haven County · 688,236 people
- City population
- 60,545
- Metro
- New Haven-Milford, CT
- Population (ZIP)
- 24,851
- Household income
- $71,255
- Rent vs Own
- Severe rent burden
- 973.0
Population outlook (South Central Connecticut County) Hauer SSP2
- By 2040
- 608,362
Race, ethnicity, and origin ACS 2023
- Neighborhood character
- Diverse neighborhood (Simpson 0.62)
- Race & ethnicity
- White 46% Hispanic / Latino 40% Two or more races 26% Black 8% Asian 2%
- Hispanic origin (detail)
- Mexican 4% Puerto Rican 24% Cuban 2% Dominican 2%
- Common ancestry
- Romanian 5% Lithuanian 4% Subsaharan African 1%
- Foreign-born
- 11% · Canada, Jamaica, China
- Languages at home
- 65% English-only · Spanish 31% Chinese 1% French/Haitian/Cajun 1%
Political lean MEDSL · South Central Connecticut
- 2024 margin
- Strong D (+20.1) · D 59.0% · R 38.9% · Other 2.1%
- All cycles
- 2024: D+20.1
Not yet ingested
- Civics
- —
Market trends
- HPI YoY
- ▼ -45.38%
- Current HPI
- 274.0567
- Rent YoY
- —
- Metro
- New Haven-Milford, CT
- State GDP YoY
- ▲ 1.06%
- F500 in state
- 38
Industry mix (Fortune 500 HQ in CT)
| Industry | F500 HQs | Revenue |
|---|---|---|
| Industrial Machinery | 4 | $38B |
|
||
| Insurance | 3 | $71B |
|
||
| Financial Services | 2 | $25B |
|
||
| Transportation / Logistics | 2 | $18B |
|
||
| Healthcare | 1 | $247B |
|
||
| Telecommunications | 1 | $55B |
|
||
Price history
+516.9% since first listed13 events — show timeline
- 2025-08-06 Price Changed $475,000 Smart MLS
- 2025-06-27 Price Changed $525,000 Smart MLS
- 2025-05-14 Listed $585,000 Smart MLS
- 2020-06-22 Sold (MLS) $112,000 Smart MLS
- 2020-05-18 Pending — Smart MLS
- 2020-05-15 Relisted — Smart MLS
- 2020-03-03 Pending — Smart MLS
- 2020-02-27 Listed $120,000 Smart MLS
- 2010-08-31 Listing Removed — Smart MLS
- 2009-09-11 Listed $229,900 Smart MLS
- 2009-07-13 Listing Removed — Smart MLS
- 2009-01-14 Listed $240,000 Smart MLS
- 1997-12-30 Sold (Public Records) $77,000 Public Records
Property tax history
-0.9%/yrLatest (2023): $5,077 · +6.0% YoY. Source: county tax records.
Cash-flow waterfall
monthlySold comps — $/sqft
last 12 mo · ≤1 miLoading sold comps…