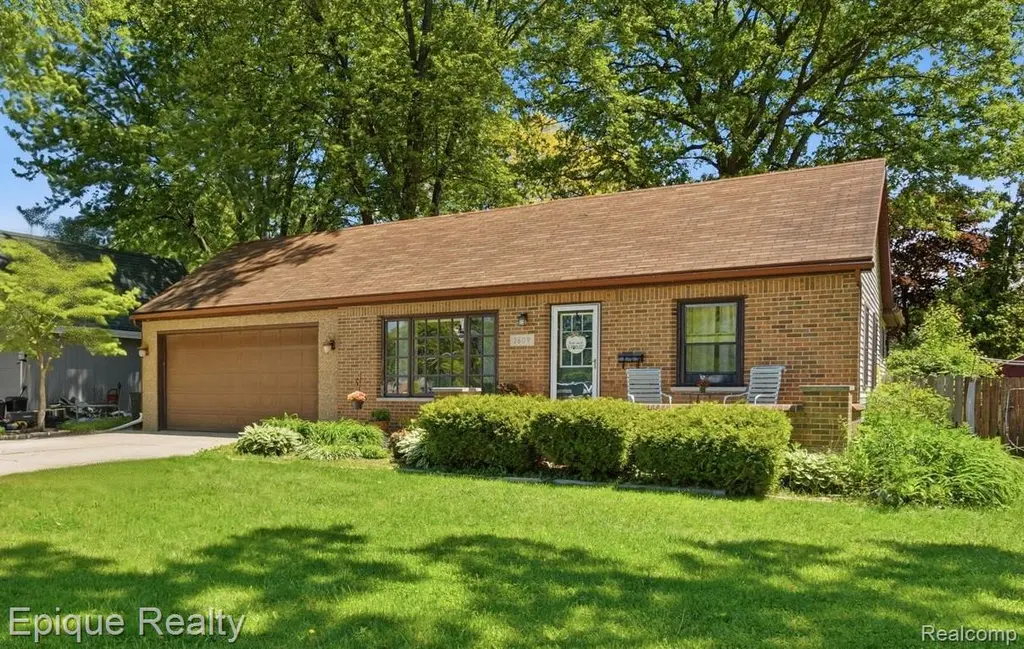
1609 New Jersey Ave · Marysville, MI
Flood risk 1/10 · Minimal
- FEMA flood zone
- X (unshaded)
- Chance of flooding over 30 yrs
- 0.0%
- Est. flood insurance / yr
- $507 – $1,088
Fire risk 1/10 · Minimal
- Est. fire insurance / yr
- $784 – $1,456
Heat risk 2/10 · Minimal
- Hot days now (above 99°F)
- 7 days/yr
- Hot days in 30 yrs
- 14 days/yr
Wind risk 1/10 · Minimal
- Chance of severe wind over 30 yrs
- —
Air-quality risk 3/10 · Minor
- Unhealthy air days now
- 2 days/yr
- Unhealthy air days in 30 yrs
- 3 days/yr
Risk factors via First Street. Map © Google.
Why this score? — see what drove the C- grade
The composite is a weighted blend of 9 inputs, each scored 0–100. Each bar is that input's sub-score; the figure is the points it added to the 100-point composite (weight × sub-score).
- Cash flow +21.0/30.0
- ARV discount +7.9/15.0
- DSCR +6.7/10.0
- 1% rule +5.6/10.0
- Schools +4.2/10.0
- Livability +3.9/5.0
- Rent growth +2.5/5.0
- Condition / age +2.5/5.0
- Appreciation +0.0/10.0
$200,000
🖨 Deal sheet 📄 Offer letter ✓ Due diligence
Listing remarks MLS
Located in a well-established Marysville neighborhood and directly across from Washington Elementary School, this 3-bedroom, 2-bath home offers convenience and a great location. With 1,056 square feet of living space, this home features granite countertops, a functional layout, and a large back deck that's perfect for relaxing or entertaining. A 2-car garage provides plenty of room for parking and storage. Whether you're looking for a place close to schools, parks, and everyday amenities or simply want to enjoy all that Marysville has to offer, this home is ready for its next owner. Schedule your showing today.
Key facts
- Large back deck
- Granite countertops
- 8,276 sq ft lot
Tags
Property features AI
Exterior
- Parking: Attached garage with 2 spaces
- Utilities: Public water; Public sewer
- Home design: Single-family residence; One-story; Ground-level entry; Brick exterior
- Construction: Brick construction; Block foundation
- Exterior features: Fenced yard; Shed on the property; Paved road access; Lot roughly 70 x 120 (0.19 acre)
Interior
- Bathrooms: 2 full bathrooms
- Heating & cooling: Baseboard heating (natural gas); Ceiling fans; No central air conditioning
- Interior features: Crawl space basement; Total of 5 rooms
Neighborhood map
What this means for you Summary
Snapshot
- This is a 3-bed/2.0-bath single-family listed at $200k.
Deal economics
- At list price, monthly cash flow is $280 ($3k/yr) — positive.
- The deal already cash-flows at list — no discount required.
- Meets the 1% rule at list price ($2k rent vs $200k).
- Cap rate 8.0% vs local median 4.8% in Marysville — top-decile yield for the area; either an underpriced asset or a hidden risk that comps aren't pricing in. Stress-test before assuming the spread holds.
Location & tenants
- Location reads 78/100 on livability (#114 in MI, #2,700 nationally) — a middle-class / working-renter tenant base. Strengths: crime A+, cost of living A+, housing A+; Watch: amenities C-, employment D+, health & safety D.
- Marysville Public Schools (suburban): math 42% / reading 53% proficiency, ranked #115 of 540 in MI (top 21%) — families likely to look elsewhere, expect single-tenant / working-renter base with shorter leases.
- Market conditions: 84 active listings in the ZIP; 232 units permitted in St. Clair County in 2024 (0 in 5+ unit buildings).
Forward outlook
- Local home prices are declining (-3.0%/yr); year-one equity from $1k of loan paydown is wiped out by about $6k of value loss. Plan a longer hold.
- St. Clair County population projected at -20% by 2050 — secular population decline; favor cash flow + early exit over multi-decade hold.
Negotiation context
- Only 5 days on market — expect competitive offers; lowballing is unlikely to land.
- 5 sale attempts since 15y ago with the ask held roughly flat each time — persistent listings suggest the price (not the market) is what's stuck; bring a comps-based counter.
- Current owner paid $130k; list at $200k implies a 54% gain — meaningful room to come down on a strong offer.
Risks & watch-outs
- Watch-outs: built in 1930 — expect roof / HVAC / electrical / plumbing capex.
Questions for the listing agent
- Built in 1930 — when were the roof, HVAC, electrical panel, plumbing, and water heater last replaced?
- Is there a deadline driving the sale (1031 exchange, divorce, estate, relocation)? That informs how much negotiation room exists.
- Schools are B-rated — typically a magnet for longer-tenancy family renters. What's the average tenant stay here, and is there a school-zone premium baked into asking?
- What's the average days-on-market for RENTAL listings here right now (not sales)? A rising rental-DOM trend means longer vacancies and softer asking-rent achievability than the comps imply.
- What's the recent tenant-quality profile in this submarket — average credit score on applications, eviction rate, late-payment / NSF rate, and stable-employment percentage? A property-management company in the area should have these aggregated.
- How much new for-sale + rental construction is in the pipeline within 1–3 miles? Heavy new supply typically softens prices + rents 12–24 months out; constrained supply supports both.
Investment metrics
- 1% rule
- 1.06% ✓
- Cap rate
- 7.97%
- Cash-on-cash
- 6.00%
- DSCR
- 1.27
- GRM
- 7.8
CMA / ARV
- ARV (on-the-fly)
- $201,696
- Comps found
- 12
Show comp detail 12 sales within ~0.75 mi
| Address | Dist | Beds/Ba | Sqft | Sold | Price | $/sf | Match |
|---|---|---|---|---|---|---|---|
| 1112 17th St | 0.28mi | 3/1.5 | 1,130 (+7%) | 1mo | $229,000 | $203 | 73 |
| 1653 Vermont St | 0.19mi | 2/1.5 (-1) | 1,024 (-3%) | 8mo | $160,000 | $156 | 72 |
| 1329 Vermont Rd | 0.46mi | 3/2.0 | 1,067 (+1%) | 6mo | $260,000 | $244 | 72 |
| 1551 Georgia Ave | 0.30mi | 3/1.0 | 1,008 (-4%) | 8mo | $176,000 | $175 | 68 |
| 1675 Pennsylvania Ave | 0.25mi | 3/1.0 | 960 (-9%) | 2mo | $145,000 | $151 | 67 |
| 1207 Colorado St | 0.59mi | 3/2.0 | 1,008 (-4%) | 4mo | $240,000 | $238 | 61 |
| 1441 Wisconsin Ave | 0.25mi | 2/1.0 (-1) | 940 (-11%) | 0mo | $180,000 | $191 | 60 |
| 1423 Wisconsin Ave | 0.29mi | 2/1.0 (-1) | 992 (-6%) | 9mo | $192,000 | $194 | 60 |
| 1634 Vermont Ave | 0.15mi | 2/1.5 (-1) | 1,180 (+12%) | 9mo | $225,000 | $191 | 59 |
| 1404 Georgia Ave | 0.45mi | 3/1.5 | 1,032 (-2%) | 18mo | $205,000 | $199 | 58 |
| 1330 Minnesota Ave | 0.47mi | 3/2.0 | 1,200 (+14%) | 3mo | $229,000 | $191 | 53 |
| 1320 Connecticut Ave | 0.44mi | 3/2.0 | 1,156 (+10%) | 16mo | $195,000 | $169 | 50 |
Match score weights: distance 35% · size 25% · config 20% · recency 20%. Top-matched comps best support the ARV.
Projected returns pro-forma
-3.0% appreciation · 3.0% rent growth · sell at horizon
- IRR
- -7.0%
- Equity multiple
- 0.74×
- Total profit
- $-14,521
- Equity at exit
- $29,821
- IRR
- 2.6%
- Equity multiple
- 1.19×
- Total profit
- $10,509
- Equity at exit
- $17,292
Cash invested: $56,000 (down + closing). Projections, not guarantees.
Landlord ↔ Tenant lean methodology
- Overall (STATE)
- 62 Landlord-Friendly
- State Michigan
- 62 Landlord-Friendly · EVEN
- County
- — inherits STATE
- City
- — inherits STATE
ZIP-level market 48040
- Home prices YoY
- -34.4%
- Active inventory
- 84
- Price-to-rent
- 7.8×
Monthly cashflow live
- Estimated rent
- $2,128 medium interval (Pro) →
- Mortgage (P&I)
- −$1,049
- Tax from tax record
- −$268 /mo · $3,222/yr
- Insurance
- −$83
- HOA
- −$0
- Vacancy / Maint / Mgmt
- −$447
- Net cashflow
- $280
Break-even live
UW: 25.0% down · 7.5% · 30yr · 1.5% tax · 5.0% vac · 8.0% maint · 8.0% mgmt
Financing live
Cash to close
- Down payment
- $50,000
- Closing costs
- $6,000
- Reserves months
- —
- Total cash needed
- —
Loan-product check · same deal, 3 products live
Conventional
25% down · 7.5% · 30yr
- Down + closing
- —
- Monthly P&I
- —
- Monthly cashflow
- —
- DSCR
- —
- Eligible?
- —
Personal DTI + credit; lowest rate.
DSCR
20% down · 8.5% · 30yr
- Down + closing
- —
- Monthly P&I
- —
- Monthly cashflow
- —
- DSCR
- —
- Eligible?
- —
No personal income docs; deal must DSCR.
Hard money
10% down · 12.0% · 12mo
- Down + closing
- —
- Monthly P&I
- —
- Monthly cashflow
- —
- DSCR
- —
- Eligible?
- —
Short-term bridge; refi at stabilization.
Listing history 6 events
-
2026-06-18days on market $200,000 Active 5 DOM
-
2026-06-17remarks 699-char remark
-
2026-06-17statusdays on market $200,000 Active 4 DOM
-
2026-06-08status $200,000 Pending 3 DOM
-
2026-06-07remarks 618-char remark
-
2026-06-07$200,000 Active 3 DOM
ⓘ Source: listings_history table (triggers on properties + properties_extension) + one-shot
backfill from property_details.listing_events for pre-trigger history.
Tax reassessment forecast MI · Partial reset (capped growth)
- Current annual tax
- $3,222 · $268/mo
- Projected year-2 tax
- $3,222 · $268/mo
- Expected delta
- $0/yr ($0/mo · 0.0%)
ⓘ Screening estimate from a state-policy table — verify with the county assessor before closing.
Climate risk First Street
- Flood 1/10 Low FEMA zone X (unshaded) · 0% chance over 30 yrs
- Wildfire 1/10 Low
- Heat 2/10 Low 7 d/yr ≥99°F today · 14 d/yr by 30 yrs out
- Wind 1/10 Low
- Air quality 3/10 Moderate 2 unhealthy d/yr today · 3 by 30 yrs out
Nearby sold comps map
Loading sold comps map…
Walkable amenities ~0.75 mi
Loading nearby amenities…
Taxation est. · year 1
- Rental income
- $25,531
- − Mortgage interest
- −$11,203
- − Property taxes
- −$3,222
- − Insurance
- −$1,000
- − Repairs & maintenance
- −$2,043
- − Management
- −$2,043
- − Depreciation
- −$5,818
- Taxable income
- $203
- Est. tax owed @ 24.0%
- −$49
- After-tax cash flow
- $3,313/yr
For passive investors: Depreciation is non-cash, so a rental often shows a tax loss while cash-flowing — sheltering income. Rental losses are passive: they offset passive income freely, and up to $25,000/yr can offset ordinary (W-2) income if you actively participate and your MAGI is under $100k (phasing out to $0 by $150k); unused losses carry forward. On sale, claimed depreciation is recaptured at up to 25%, and gains may owe capital-gains tax (a 1031 exchange can defer both). Figures are a year-1 estimate at your 24.0% rate — not tax advice; consult a CPA.
Schools (NCES district)
- District
- Marysville Public Schools
- NCES district ID
- 2623040
- Math proficiency
- 42% ▼ -14.00%
- Reading proficiency
- 53% ▼ -12.00%
- Median HH income
- $58,817
- Composite
- 41.51/100
- National rank
- #3454
- State rank
- #115 of 540 in MI
Livability — Marysville
- Score
- 78/100
- State rank
- #114
- US rank
- #2700
Category grades
Schools grade is shown separately in the Schools card above.
Census & demographics
- Census place
- Marysville, MI
- City population
- 9,942
- Population (ZIP)
- 9,942
Population outlook (St. Clair County) Hauer SSP2
- Today (2025)
- 154,587 people
- By 2030
- 150,031 · -2.9%
- By 2040
- 138,177 · -10.6%
- By 2050
- 124,390 · -19.5%
- By 2075
- 95,825 · -38.0%
- By 2100
- 68,672 · -55.6%
Race, ethnicity, and origin ACS 2023
- Neighborhood character
- Predominantly White (93%)
- Race & ethnicity
- White 93% Two or more races 3% Hispanic / Latino 1% Asian 1% Black 1%
- Common ancestry
- Romanian 11% Iranian 6% Lithuanian 5%
- Foreign-born
- 2% · Canada, Philippines
- Languages at home
- 98% English-only · Other Asian/Pacific 1%
Political lean MEDSL · St. Clair
- 2024 margin
- Solid R (+34.6) · D 32.0% · R 66.6% · Other 1.4%
- 2008→2024 swing
- -37.3pp toward R · 2008: 2.6pp · 2024: -34.6pp
- All cycles
- 2024: R+34.6 2020: R+30.2 2016: R+31.4 2012: R+7.1 2008: D+2.6
Not yet ingested
- Civics
- —
Market trends
- HPI YoY
- ▼ -98.64%
- Current HPI
- 188.3932
- Rent YoY
- —
- Metro
- —
- State GDP YoY
- ▲ 1.37%
- F500 in state
- 28
Industry mix (Fortune 500 HQ in MI)
| Industry | F500 HQs | Revenue |
|---|---|---|
| Automotive Parts | 3 | $48B |
|
||
| Automotive | 2 | $372B |
|
||
| Chemicals | 1 | $45B |
|
||
| Automotive Retail | 1 | $29B |
|
||
| Healthcare / Medical Devices | 1 | $23B |
|
||
| Automotive Technology | 1 | $20B |
|
||
Price history
+186.1% since first listed12 events — show timeline
- 2026-06-04 Listed $200,000 MiRealSource-MiMLS
- 2026-06-04 Listed $200,000 REALCOMP
- 2019-12-13 Sold (MLS) $129,900 MiRealSource-MiMLS
- 2019-12-13 Sold (MLS) $129,900 REALCOMP
- 2019-11-07 Pending — MiRealSource-MiMLS
- 2019-11-07 Pending — REALCOMP
- 2019-10-28 Listed $129,900 MiRealSource-MiMLS
- 2019-10-28 Listed $129,900 REALCOMP
- 2012-04-26 Sold (Public Records) $70,000 Public Records
- 2012-04-23 Sold (MLS) $70,000 MiRealSource-MiMLS
- 2012-03-27 Listing Removed — MiRealSource-MiMLS
- 2011-12-07 Listed $69,900 MiRealSource-MiMLS
Property tax history
+7.4%/yrLatest (2025): $3,222 · +4.2% YoY. Source: county tax records.
Cash-flow waterfall
monthlySold comps — $/sqft
last 12 mo · ≤1 miLoading sold comps…