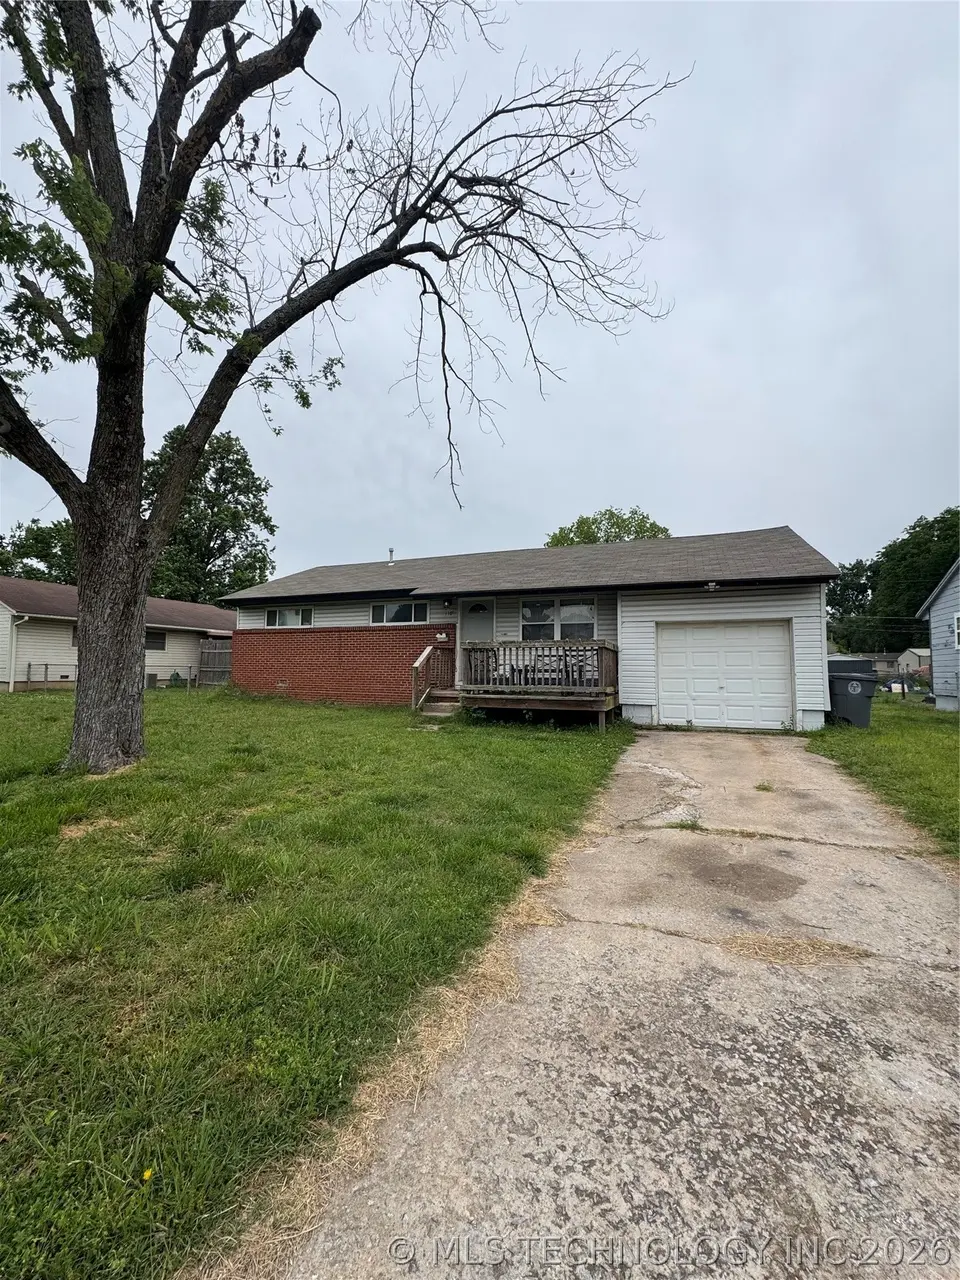
110 N 44th WestAvenue · Tulsa, OK
Flood risk 1/10 · Minimal
- FEMA flood zone
- X (shaded)
- Chance of flooding over 30 yrs
- 0.0%
- Est. flood insurance / yr
- $507 – $1,088
Fire risk 5/10 · Moderate
- Est. fire insurance / yr
- $2,463 – $4,575
Heat risk 6/10 · Moderate
- Hot days now (above 110°F)
- 7 days/yr
- Hot days in 30 yrs
- 18 days/yr
Wind risk 3/10 · Minor
- Chance of severe wind over 30 yrs
- 4.0%
Air-quality risk 2/10 · Minimal
- Unhealthy air days now
- 2 days/yr
- Unhealthy air days in 30 yrs
- 2 days/yr
Risk factors via First Street. Map © Google.
Why this score? — see what drove the C- grade
The composite is a weighted blend of 9 inputs, each scored 0–100. Each bar is that input's sub-score; the figure is the points it added to the 100-point composite (weight × sub-score).
- Cash flow +24.4/30.0
- DSCR +7.9/10.0
- ARV discount +6.5/15.0
- 1% rule +5.8/10.0
- Livability +3.8/5.0
- Rent growth +3.1/5.0
- Condition / age +2.5/5.0
- Schools +0.8/10.0
- Appreciation +0.0/10.0
$162,500
🖨 Deal sheet (PDF) 📄 Offer letter ✓ Due diligence
Listing remarks MLS
Large master bedroom, wood floors, great fixer-upper. This is a Fannie Mae HomePath property.
Key facts
- 9,536 sq ft lot
- Garage
- Built 1954
Property features AI
Exterior
- Parking: Attached garage (1 car)
- Security: No safety shelter
- Utilities: Natural gas available; Public water; Public sewer
- Home design: Single-story home; Faces east; Slab foundation
- Construction: Brick, vinyl siding, and wood frame construction; Asphalt/fiberglass roof; Built in public-records year (year built per public records)
- Exterior features: Concrete driveway; Deck; Chain link fencing; Mature trees on the lot
Interior
- Kitchen: Dishwasher; Oven; Range; Refrigerator; Breakfast nook; Dining area combined with living space
- Bedrooms: Multiple first-floor bedrooms including a master bedroom with private bath; Additional bedrooms on the first floor (no attached baths)
- Flooring: Carpet; Tile; Wood
- Bathrooms: Two full bathrooms (including a master bath and a hall bath)
- Heating & cooling: Central heating (gas); Central air conditioning
- Interior features: Ceiling fans; Laminate counters; Storm windows with wood frames
- Laundry & utility: Washer hookup; Utility room located in the garage
Neighborhood map
What this means for you Summary
Snapshot
- This is a 4-bed/1.5-bath single-family listed at $162k.
Deal economics
- At list price, monthly cash flow is $331 ($4k/yr) — positive.
- The deal already cash-flows at list — no discount required.
- Meets the 1% rule at list price ($2k rent vs $162k).
- Recommended offer: $158k (3.0% below list) — sets the bar for market timing.
- Cap rate 8.7% vs local median 3.8% in Tulsa — top-decile yield for the area; either an underpriced asset or a hidden risk that comps aren't pricing in. Stress-test before assuming the spread holds.
Location & tenants
- Location reads 75/100 on livability (#13 in OK, #4,058 nationally) — a middle-class / working-renter tenant base. Strengths: amenities A+, commute A+, cost of living A+; Watch: crime F, employment D-.
- Tulsa (urban): math 7% / reading 12% proficiency, ranked #250 of 270 in OK (top 93%) — low school quality limits family demand, transient renter base, plan for 1-2y turnover; 76% free/reduced lunch — lower-income household profile, screen leases tightly.
- Zoned schools: Project Accept Traice Es (math 10% / reading 10%, grade F, #695 of 845 statewide, top 84%, 558 students, 0% FRL); Monroe Demonstration Ms (math 0% / reading 2%, grade F, #344 of 345 statewide, top 100%, 688 students, 0% FRL); Booker T. Washington Hs (math 41% / reading 61%, grade D+, #2 of 447 statewide, top 0%, 1,280 students, 0% FRL) — zoned schools average 0% FRL vs 76% district-wide (76 pts lower); this property's tenant base skews higher-income than the district average.
- Market conditions: Rents rising (+2.5%/yr); 115 active listings in the ZIP; 3 comparable units currently listed for rent nearby; rentals leasing fast (median 3d on market — plan ~1-2 weeks tenant-placement turnaround); 2,818 units permitted in Tulsa County in 2024 (518 in 5+ unit buildings).
- At $1,750/mo this rent would consume 45% of the median local household income ($46k/yr) (locally 782% of renters already pay >50% of income on rent) — very limited rent-growth headroom before tenants either downsize or default.
Forward outlook
- Local home prices are declining (-3.0%/yr); year-one equity from $1k of loan paydown is wiped out by about $5k of value loss. Plan a longer hold.
- Tulsa County population projected at +30% by 2050 — long-run rental-demand tailwind backs the buy-and-hold thesis.
Negotiation context
- It's been on market 44 days — a 3% lower offer ($158k) is reasonable based on typical stale-listing flexibility.
- 8 sale attempts since 26y ago with the ask held roughly flat each time — persistent listings suggest the price (not the market) is what's stuck; bring a comps-based counter.
- Current owner paid $35k; list at $162k implies a 364% gain — meaningful room to come down on a strong offer.
Risks & watch-outs
- Watch-outs: built in 1954 — expect roof / HVAC / electrical / plumbing capex.
- Climate carrying-cost: moderate wildfire risk; extreme-heat days projected 7→18/yr by 2055 (HVAC capex compounding) — expect insurance premiums to compound above CPI over the hold.
Questions for the listing agent
- It's been on market 44 days. Have you received any prior offers? Is the seller open to a 3% concession, seller financing, or rate buy-down credit?
- Built in 1954 — when were the roof, HVAC, electrical panel, plumbing, and water heater last replaced?
- Is there a deadline driving the sale (1031 exchange, divorce, estate, relocation)? That informs how much negotiation room exists.
- Schools are F-rated, which usually means shorter tenancies and higher turnover. Who's the typical renter profile here, and what's been the actual vacancy rate?
- Crime grade is F in this area — have there been break-ins, vandalism, or insurance claims at this property in the last 3 years? What carrier currently insures it and at what premium?
- What's the average days-on-market for RENTAL listings here right now (not sales)? A rising rental-DOM trend means longer vacancies and softer asking-rent achievability than the comps imply.
- What's the recent tenant-quality profile in this submarket — average credit score on applications, eviction rate, late-payment / NSF rate, and stable-employment percentage? A property-management company in the area should have these aggregated.
- How much new for-sale + rental construction is in the pipeline within 1–3 miles? Heavy new supply typically softens prices + rents 12–24 months out; constrained supply supports both.
Investment metrics
- 1% rule
- 1.08% ✓
- Cap rate
- 8.74%
- Cash-on-cash
- 8.73%
- DSCR
- 1.39
- GRM
- 7.7
CMA / ARV
- ARV (on-the-fly)
- $159,000
- Comps found
- 12
Show comp detail 12 sales within ~0.75 mi
| Address | Dist | Beds/Ba | Sqft | Sold | Price | $/sf | Match |
|---|---|---|---|---|---|---|---|
| 503 N 45th WestAvenue | 0.24mi | 3/1.0 (-1) | 1,500 (0%) | 3mo | $135,000 | $90 | 79 |
| 329 S 45th WestAvenue | 0.25mi | 4/2.0 | 1,550 (+3%) | 3mo | $164,000 | $106 | 78 |
| 218 N 44th WestAvenue | 0.12mi | 3/2.0 (-1) | 1,550 (+3%) | 9mo | $158,000 | $102 | 75 |
| 323 S 45th WestAvenue | 0.24mi | 3/2.0 (-1) | 1,512 (+1%) | 8mo | $72,000 | $48 | 74 |
| 344 S 41st WestAvenue | 0.35mi | 4/1.5 | 1,383 (-8%) | 7mo | $165,000 | $119 | 65 |
| 4307 W Reconciliation Way | 0.10mi | 3/1.0 (-1) | 1,344 (-10%) | 10mo | $150,000 | $112 | 63 |
| 5114 W 3rd St | 0.52mi | 3/2.0 (-1) | 1,500 (0%) | 10mo | $215,000 | $143 | 60 |
| 5353 W 2nd St | 0.69mi | 3/2.0 (-1) | 1,488 (-1%) | 9mo | $135,000 | $91 | 52 |
| 3504 W Edison St | 0.68mi | 4/3.0 | 1,562 (+4%) | 9mo | $303,000 | $194 | 48 |
| 4716 W 8th St | 0.69mi | 4/2.0 | 1,292 (-14%) | 1mo | $158,000 | $122 | 41 |
| 4138 W 8th St | 0.66mi | 3/2.0 (-1) | 1,672 (+12%) | 4mo | $119,900 | $72 | 40 |
| 512 N 38th WestAvenue | 0.58mi | 3/2.0 (-1) | 1,722 (+15%) | 3mo | $180,000 | $105 | 38 |
Match score weights: distance 35% · size 25% · config 20% · recency 20%. Top-matched comps best support the ARV.
Projected returns pro-forma
-3.0% appreciation · 2.45% rent growth · sell at horizon
- IRR
- -3.7%
- Equity multiple
- 0.86×
- Total profit
- $-6,236
- Equity at exit
- $24,229
- IRR
- 5.4%
- Equity multiple
- 1.39×
- Total profit
- $17,730
- Equity at exit
- $14,050
Cash invested: $45,500 (down + closing). Projections, not guarantees.
Landlord ↔ Tenant lean methodology
- Overall (STATE)
- 83 Strongly Landlord-Friendly
- State Oklahoma
- 83 Strongly Landlord-Friendly · R+20
- County
- — inherits STATE
- City
- — inherits STATE
ZIP-level market 74127
- Home prices YoY
- -20.4%
- Rents YoY
- 2.5%
- Active inventory
- 115
- Price-to-rent
- 7.7×
Monthly cashflow live
- Estimated rent
- $1,750 medium interval (Pro) →
- Mortgage (P&I)
- −$852
- Tax from tax record
- −$131 /mo · $1,577/yr
- Insurance
- −$68
- HOA
- −$0
- Vacancy / Maint / Mgmt
- −$367
- Net cashflow
- $331
Break-even live
Sensitivity live
| Price | -10% $423 | -5% $377 | +0% $331 | +5% $285 | +10% $239 |
|---|---|---|---|---|---|
| Rent | -10% $193 | -5% $262 | +0% $331 | +5% $400 | +10% $469 |
| Rate | -1.0pp $413 | -0.5pp $372 | base $331 | +0.5pp $289 | +1.0pp $246 |
UW: 25.0% down · 7.5% · 30yr · 1.5% tax · 5.0% vac · 8.0% maint · 8.0% mgmt
Financing live
Cash to close
- Down payment
- $40,625
- Closing costs
- $4,875
- Reserves months
- —
- Total cash needed
- —
Loan-product check · same deal, 3 products live
Conventional
25% down · 7.5% · 30yr
- Down + closing
- —
- Monthly P&I
- —
- Monthly cashflow
- —
- DSCR
- —
- Eligible?
- —
Personal DTI + credit; lowest rate.
DSCR
20% down · 8.5% · 30yr
- Down + closing
- —
- Monthly P&I
- —
- Monthly cashflow
- —
- DSCR
- —
- Eligible?
- —
No personal income docs; deal must DSCR.
Hard money
10% down · 12.0% · 12mo
- Down + closing
- —
- Monthly P&I
- —
- Monthly cashflow
- —
- DSCR
- —
- Eligible?
- —
Short-term bridge; refi at stabilization.
Rent comps 3 comps
| Address | Beds | Baths | Sqft | Rent | $/sqft | DOM | Units | Dist |
|---|---|---|---|---|---|---|---|---|
| 5342 W 1st St Tulsa, OK | 5.0 | 2.0 | 1380 | $2,100 | $1.52 | 3d | 1 | 0.65mi |
| 5330 W 2nd St Tulsa, OK | 4.0 | 2.0 | 1212 | $1,700 | $1.40 | 3d | 1 | 0.65mi |
| 2521 W Cameron St Tulsa, OK | 3.0 | 1.5 | 1161 | $1,295 | $1.12 | 20d | 1 | 1.17mi |
Listing history 35 events
-
2026-06-22days on market $162,500 Active 44 DOM
-
2026-06-18days on market $162,500 Active 41 DOM
-
2026-06-17days on market $162,500 Active 40 DOM
-
2026-06-16days on market $162,500 Active 39 DOM
-
2026-06-15days on market $162,500 Active 38 DOM
-
2026-06-13days on market $162,500 Active 36 DOM
-
2026-06-10days on market $162,500 Active 33 DOM
-
2026-06-09days on market $162,500 Active 32 DOM
-
2026-06-08days on market $162,500 Active 31 DOM
-
2026-06-07days on market $162,500 Active 30 DOM
-
2026-06-05days on market $162,500 Active 27 DOM
-
2026-06-03days on market $162,500 Active 26 DOM
-
2026-06-02days on market $162,500 Active 25 DOM
-
2026-06-01days on market $162,500 Active 24 DOM
-
2026-05-31days on market $162,500 Active 23 DOM
-
2026-05-08$162,500 Active
-
2014-10-24historical
-
2014-06-23$69,900
-
2014-04-12soldstatus $35,000 93-char remark
Show marketing remark (93 chars)
Large master bedroom, wood floors, great fixer-upper. This is a Fannie Mae HomePath property.
-
2014-03-20historical 93-char remark
Show marketing remark (93 chars)
Large master bedroom, wood floors, great fixer-upper. This is a Fannie Mae HomePath property.
-
2014-02-25historical
-
2014-02-24$39,000 93-char remark
Show marketing remark (93 chars)
Large master bedroom, wood floors, great fixer-upper. This is a Fannie Mae HomePath property.
-
2013-10-23$39,000
-
2007-01-29soldstatus $45,000
-
2007-01-17historical
-
2006-10-19$51,900
-
2006-10-19historical
-
2006-09-25$59,900
-
2006-09-13historical
-
2006-06-14$63,900
-
2000-06-20soldstatus $63,000
-
2000-06-15soldstatus $62,900
-
2000-05-03historical
-
2000-02-28$62,900
-
1987-04-24soldstatus $42,000
ⓘ Source: listings_history table (triggers on properties + properties_extension) + one-shot
backfill from property_details.listing_events for pre-trigger history.
Tax reassessment forecast OK · Resets to sale price
- Current annual tax
- $1,577 · $131/mo
- Projected year-2 tax
- $1,577 · $131/mo
- Expected delta
- $0/yr ($0/mo · 0.0%)
ⓘ Screening estimate from a state-policy table — verify with the county assessor before closing.
Climate risk First Street
- Flood 1/10 Low FEMA zone X (shaded) · 0% chance over 30 yrs
- Wildfire 5/10 Major
- Heat 6/10 Major 7 d/yr ≥110°F today · 18 d/yr by 30 yrs out
- Wind 3/10 Moderate 4% chance of damaging wind over 30 yrs
- Air quality 2/10 Low 2 unhealthy d/yr today · 2 by 30 yrs out
Nearby sold comps map
Loading sold comps map…
Walkable amenities ~0.75 mi
Loading nearby amenities…
Taxation est. · year 1
- Rental income
- $20,996
- − Mortgage interest
- −$9,103
- − Property taxes
- −$1,577
- − Insurance
- −$812
- − Repairs & maintenance
- −$1,680
- − Management
- −$1,680
- − Depreciation
- −$4,727
- Taxable income
- $1,417
- Est. tax owed @ 24.0%
- −$340
- After-tax cash flow
- $3,631/yr
For passive investors: Depreciation is non-cash, so a rental often shows a tax loss while cash-flowing — sheltering income. Rental losses are passive: they offset passive income freely, and up to $25,000/yr can offset ordinary (W-2) income if you actively participate and your MAGI is under $100k (phasing out to $0 by $150k); unused losses carry forward. On sale, claimed depreciation is recaptured at up to 25%, and gains may owe capital-gains tax (a 1031 exchange can defer both). Figures are a year-1 estimate at your 24.0% rate — not tax advice; consult a CPA.
Schools (NCES district)
- District
- Tulsa
- NCES district ID
- 4030240
- Math proficiency
- 7% ▼ -9.00%
- Reading proficiency
- 12% ▼ -7.00%
- Median HH income
- $37,895
- Composite
- 8.04/100
- National rank
- #9919
- State rank
- #250 of 270 in OK
Livability — Tulsa
- Score
- 75/100
- State rank
- #13
- US rank
- #4058
Category grades
Schools grade is shown separately in the Schools card above.
Census & demographics
- Census place
- Tulsa, OK
- County
- Osage County · 26,244 people
- City population
- 389,418
- Metro
- Tulsa, OK
- Population (ZIP)
- 16,324
- Household income
- $46,373
- Rent vs Own
- Severe rent burden
- 782.0
Population outlook (Tulsa County) Hauer SSP2
- Today (2025)
- 723,846 people
- By 2030
- 766,033 · +5.8%
- By 2040
- 851,386 · +17.6%
- By 2050
- 938,389 · +29.6%
- By 2075
- 1,166,011 · +61.1%
- By 2100
- 1,350,277 · +86.5%
Race, ethnicity, and origin ACS 2023
- Neighborhood character
- Diverse neighborhood (Simpson 0.66)
- Race & ethnicity
- White 50% Black 28% Two or more races 10% Hispanic / Latino 7% Native American 7%
- Hispanic origin (detail)
- Mexican 5%
- Common ancestry
- Slovak 2% Italian 1% Iranian 1%
- Foreign-born
- 4% · Canada, Jamaica
- Languages at home
- 94% English-only · Spanish 4%
Political lean MEDSL · Tulsa
- 2024 margin
- R (+15.2) · D 41.3% · R 56.5% · Other 2.2%
- 2008→2024 swing
- +9.2pp toward D · 2008: -24.5pp · 2024: -15.2pp
- All cycles
- 2024: R+15.2 2020: R+15.6 2016: R+22.9 2012: R+27.4 2008: R+24.5
Not yet ingested
- Civics
- —
Market trends
- HPI YoY
- ▼ -59.31%
- Current HPI
- 231.5994
- Rent YoY
- ▲ 2.45%
- Metro
- Tulsa, OK
- State GDP YoY
- ▲ 1.55%
- F500 in state
- 6
Industry mix (Fortune 500 HQ in OK)
| Industry | F500 HQs | Revenue |
|---|---|---|
| Energy | 3 | $48B |
|
||
Price history
+286.9% since first listed20 events — show timeline
- 2026-05-08 Listed $162,500 MLS Technology, Inc.
- 2014-10-24 Listing Removed — MLS Technology, Inc.
- 2014-06-23 Listed $69,900 MLS Technology, Inc.
- 2014-04-12 Sold (MLS) $35,000 MLS Technology, Inc.
- 2014-03-20 Listing Removed — MLS Technology, Inc.
- 2014-02-25 Listing Removed — MLS Technology, Inc.
- 2014-02-24 Listed $39,000 MLS Technology, Inc.
- 2013-10-23 Listed $39,000 MLS Technology, Inc.
- 2007-01-29 Sold (MLS) $45,000 MLS Technology, Inc.
- 2007-01-17 Listing Removed — MLS Technology, Inc.
- 2006-10-19 Listing Removed — MLS Technology, Inc.
- 2006-10-19 Listed $51,900 MLS Technology, Inc.
- 2006-09-25 Listed $59,900 MLS Technology, Inc.
- 2006-09-13 Listing Removed — MLS Technology, Inc.
- 2006-06-14 Listed $63,900 MLS Technology, Inc.
- 2000-06-20 Sold (Public Records) $63,000 Public Records
- 2000-06-15 Sold (MLS) $62,900 MLS Technology, Inc.
- 2000-05-03 Listing Removed — MLS Technology, Inc.
- 2000-02-28 Listed $62,900 MLS Technology, Inc.
- 1987-04-24 Sold (Public Records) $42,000 Public Records
Property tax history
+4.5%/yrLatest (2025): $1,577 · +8.7% YoY. Source: county tax records.
Cash-flow waterfall
monthlySold comps — $/sqft
last 12 mo · ≤1 miLoading sold comps…