 🏷️ Likely Rental
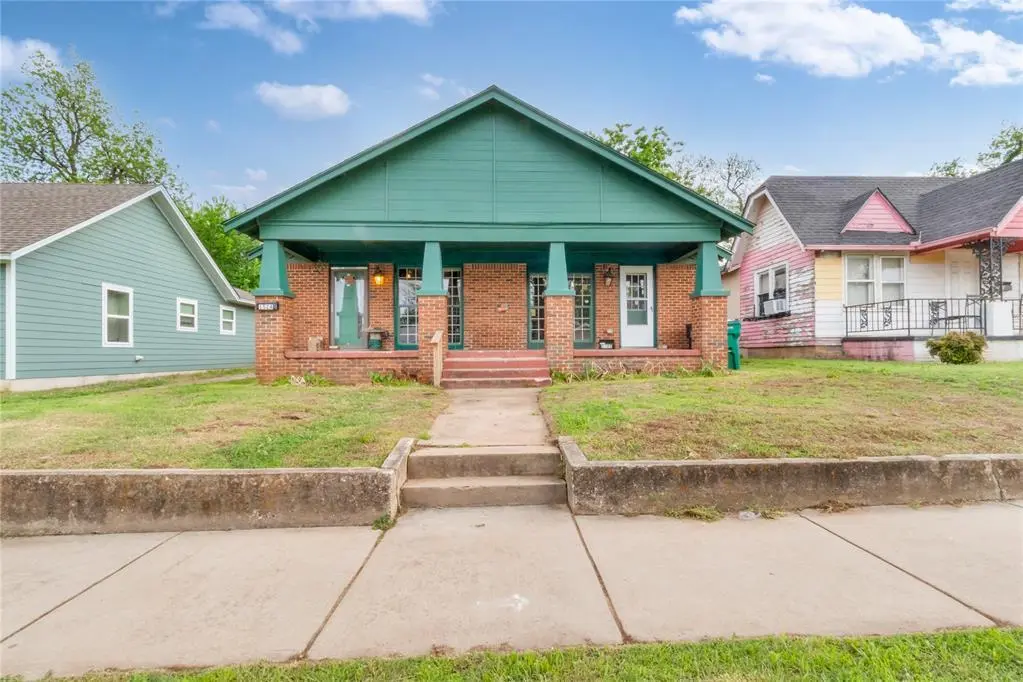
1522 NE 14th St · Oklahoma City, OK
Flood risk 1/10 · Minimal
- FEMA flood zone
- X (unshaded)
- Chance of flooding over 30 yrs
- 0.0%
- Est. flood insurance / yr
- $507 – $1,088
Fire risk 1/10 · Minimal
- Est. fire insurance / yr
- $2,463 – $4,575
Heat risk 5/10 · Moderate
- Hot days now (above 107°F)
- 7 days/yr
- Hot days in 30 yrs
- 18 days/yr
Wind risk 2/10 · Minimal
- Chance of severe wind over 30 yrs
- 3.0%
Air-quality risk 2/10 · Minimal
- Unhealthy air days now
- 1 days/yr
- Unhealthy air days in 30 yrs
- 2 days/yr
Risk factors via First Street. Map © Google.
Why this score? — see what drove the C- grade
The composite is a weighted blend of 9 inputs, each scored 0–100. Each bar is that input's sub-score; the figure is the points it added to the 100-point composite (weight × sub-score).
- ARV discount +15.0/15.0
- Cash flow +14.3/30.0
- Appreciation +6.2/10.0
- DSCR +4.3/10.0
- Livability +4.0/5.0
- 1% rule +3.2/10.0
- Rent growth +2.5/5.0
- Condition / age +2.5/5.0
- Schools +0.7/10.0
$155,000
🖨 Deal sheet (PDF) 📄 Offer letter ✓ Due diligence
Listing remarks MLS
Investment opportunity in the heart of Oklahoma City! This duplex at 1522 NE 14th St offers a total of 1,435 sqft, with each unit featuring 1 bedroom, 1 bathroom, and approximately 717 sqft of living space. One side is currently rented at $850/month on a month-to-month lease, providing immediate income with flexibility for future adjustments. Whether you're an investor looking to add to your portfolio or a first-time buyer wanting to house hack, this property checks all the boxes—live in one side and rent out the other. Conveniently located just minutes from OU Medical Center and the Oklahoma State Capitol, with quick access to major highways including I-235, I-35, and I-40, making commuting easy. Don’t miss your chance to own a cash-flowing property in a growing area with strong rental demand!
Key facts
- Currently rented
- Live in one side
- Rent out the other
Tags
Neighborhood map
What this means for you Summary
Snapshot
- This is a 2-bed/2.0-bath townhouse listed at $155k.
Deal economics
- At list price, monthly cash flow is $28 ($331/yr) — positive.
- The deal already cash-flows at list — no discount required.
- To meet the 1% rule (rent ≥ 1% of price), the offer needs to be $127k (18.2% below list).
- Recommended offer: $127k (18.2% below list) — sets the bar for 1% rule.
- Cap rate 6.5% vs local median 3.7% in Oklahoma City — top-decile yield for the area; either an underpriced asset or a hidden risk that comps aren't pricing in. Stress-test before assuming the spread holds.
Location & tenants
- Location reads 80/100 on livability (#3 in OK, #1,635 nationally) — a professional / high-income tenant draw. Strengths: amenities A+, commute A+, cost of living A+; Watch: crime F.
- Oklahoma City (urban): math 7% / reading 10% proficiency, ranked #254 of 270 in OK (top 94%) — low school quality limits family demand, transient renter base, plan for 1-2y turnover; 82% free/reduced lunch — lower-income household profile, screen leases tightly.
- Zoned schools: Emerson Alternative Ed. (Es) (math 24% / reading 24%, grade F, #354 of 845 statewide, top 47%, 64 students, 0% FRL); Classen Ms of Advanced Studies (math 35% / reading 46%, grade F, #6 of 345 statewide, top 1%, 855 students, 0% FRL); Southeast Hs (math 8% / reading 17%, grade F, #355 of 447 statewide, top 80%, 854 students, 0% FRL) — zoned schools average 0% FRL vs 82% district-wide (82 pts lower); this property's tenant base skews higher-income than the district average.
- Zoned-school proficiency averages 26% at this address vs 8% district-wide (+17 pts) — the actual schools serving this property are materially stronger than the Oklahoma City average implies; a family-tenant draw the district grade alone would hide.
- Market conditions: 75 active listings in the ZIP; 40 comparable units currently listed for rent nearby; rentals at typical pace (median 19d on market — plan ~3-4 weeks tenant-placement turnaround); lower-income renter base — watch delinquency; 5,365 units permitted in Oklahoma County in 2024 (569 in 5+ unit buildings).
Forward outlook
- In year one you build about $5k of equity ($1k loan paydown + $4k appreciation (2.4% local appreciation)).
- Oklahoma County population projected at +41% by 2050 — long-run rental-demand tailwind backs the buy-and-hold thesis.
- At projected returns (2.4% appreciation + 3.0% rent growth), your $43k cash investment doubles in ~7 years — after that, you're playing with house money.
- By year 7, paydown + projected appreciation supports a ~$31k cash-out refi (75% LTV) — recoverable capital for the next deal without selling this one.
Negotiation context
- It's been on market 52 days — a 3% lower offer ($150k) is reasonable based on typical stale-listing flexibility.
Risks & watch-outs
- Watch-outs: built in 1932 — expect roof / HVAC / electrical / plumbing capex.
- Climate carrying-cost: extreme-heat days projected 7→18/yr by 2055 (HVAC capex compounding) — expect insurance premiums to compound above CPI over the hold.
Questions for the listing agent
- It's been on market 52 days. Have you received any prior offers? Is the seller open to a 18% concession, seller financing, or rate buy-down credit?
- Built in 1932 — when were the roof, HVAC, electrical panel, plumbing, and water heater last replaced?
- Is there a deadline driving the sale (1031 exchange, divorce, estate, relocation)? That informs how much negotiation room exists.
- Schools are F-rated, which usually means shorter tenancies and higher turnover. Who's the typical renter profile here, and what's been the actual vacancy rate?
- Crime grade is F in this area — have there been break-ins, vandalism, or insurance claims at this property in the last 3 years? What carrier currently insures it and at what premium?
- What's the average days-on-market for RENTAL listings here right now (not sales)? A rising rental-DOM trend means longer vacancies and softer asking-rent achievability than the comps imply.
- What's the recent tenant-quality profile in this submarket — average credit score on applications, eviction rate, late-payment / NSF rate, and stable-employment percentage? A property-management company in the area should have these aggregated.
- How much new for-sale + rental construction is in the pipeline within 1–3 miles? Heavy new supply typically softens prices + rents 12–24 months out; constrained supply supports both.
Investment metrics
- 1% rule
- 0.82% ✗
- Cap rate
- 6.51%
- Cash-on-cash
- 0.76%
- DSCR
- 1.03
- GRM
- 10.2
CMA / ARV
- ARV (median comp)
- $299,900
- List price
- $155,000
- Delta
- -48.32%
- Verdict
- UNDERPRICED
- Comps
- 3 within 1.0 mi
Projected returns pro-forma
2.42% appreciation · 3.0% rent growth · sell at horizon
- IRR
- 6.5%
- Equity multiple
- 1.36×
- Total profit
- $15,655
- Equity at exit
- $64,657
- IRR
- 9.7%
- Equity multiple
- 2.37×
- Total profit
- $59,268
- Equity at exit
- $95,892
Cash invested: $43,400 (down + closing). Projections, not guarantees.
Landlord ↔ Tenant lean methodology
- Overall (STATE)
- 83 Strongly Landlord-Friendly
- State Oklahoma
- 83 Strongly Landlord-Friendly · R+20
- County
- — inherits STATE
- City
- — inherits STATE
ZIP-level market 73117
- Home prices YoY
- 1.3%
- Active inventory
- 75
- Price-to-rent
- 10.2×
Monthly cashflow live
- Estimated rent
- $1,269 high interval (Pro) →
- Mortgage (P&I)
- −$813
- Tax from tax record
- −$97 /mo · $1,167/yr
- Insurance
- −$65
- HOA
- −$0
- Vacancy / Maint / Mgmt
- −$266
- Net cashflow
- $28
Break-even live
Sensitivity live
| Price | -10% $115 | -5% $71 | +0% $28 | +5% $-16 | +10% $-60 |
|---|---|---|---|---|---|
| Rent | -10% $-73 | -5% $-22 | +0% $28 | +5% $78 | +10% $128 |
| Rate | -1.0pp $106 | -0.5pp $67 | base $28 | +0.5pp $-13 | +1.0pp $-53 |
UW: 25.0% down · 7.5% · 30yr · 1.5% tax · 5.0% vac · 8.0% maint · 8.0% mgmt
Financing live
Cash to close
- Down payment
- $38,750
- Closing costs
- $4,650
- Reserves months
- —
- Total cash needed
- —
Loan-product check · same deal, 3 products live
Conventional
25% down · 7.5% · 30yr
- Down + closing
- —
- Monthly P&I
- —
- Monthly cashflow
- —
- DSCR
- —
- Eligible?
- —
Personal DTI + credit; lowest rate.
DSCR
20% down · 8.5% · 30yr
- Down + closing
- —
- Monthly P&I
- —
- Monthly cashflow
- —
- DSCR
- —
- Eligible?
- —
No personal income docs; deal must DSCR.
Hard money
10% down · 12.0% · 12mo
- Down + closing
- —
- Monthly P&I
- —
- Monthly cashflow
- —
- DSCR
- —
- Eligible?
- —
Short-term bridge; refi at stabilization.
Rent comps 40 comps
| Address | Beds | Baths | Sqft | Rent | $/sqft | DOM | Units | Dist |
|---|---|---|---|---|---|---|---|---|
| 1444 NE 13th St Unit 1446 Oklahoma City, OK | 2.0 | 2.0 | 1167 | $1,199 | $1.03 | 19d | 1 | 0.13mi |
| 1450 NE 16th Ter Oklahoma City, OK | 3.0 | 1.0 | 1096 | $1,295 | $1.18 | 46d | 1 | 0.14mi |
| 1801 N Jordan Ave Oklahoma City, OK | 2.0 | 1.0 | 1080 | $1,000 | $0.93 | 16d | 1 | 0.20mi |
| 1609 NE 18th St Oklahoma City, OK | 2.0 | 1.0 | 899 | $900 | $1.00 | 6d | 1 | 0.28mi |
| 1633 NE 11th St Oklahoma City, OK | 3.0 | 2.0 | 1284 | $1,945 | $1.51 | 0d | 1 | 0.28mi |
| 1727 NE 19th St Oklahoma City, OK | 3.0 | 1.0 | 892 | $995 | $1.12 | 46d | 1 | 0.37mi |
| 1220 NE 17th St Oklahoma City, OK | 2.0 | 1.0 | 1100 | $1,195 | $1.09 | 46d | 1 | 0.40mi |
| 1148 N Lottie Ave Oklahoma City, OK | 2.0 | 1.0 | 1040 | $1,150 | $1.11 | 5d | 1 | 0.41mi |
| 1445 NE 10th St Oklahoma City, OK | 2.0 | 1.0 | 1011 | $1,195 | $1.18 | 19d | 1 | 0.41mi |
| 1428 NE 10th St Oklahoma City, OK | 3.0 | 2.0 | 1487 | $1,600 | $1.08 | 46d | 1 | 0.44mi |
| 1200 NE 17th St Unit B Oklahoma City, OK | 2.0 | 1.0 | 1002 | $2,100 | $2.10 | 46d | 1 | 0.45mi |
| 1615 NE 9th St Oklahoma City, OK | 3.0 | 2.0 | 1724 | $2,700 | $1.57 | 0d | 1 | 0.47mi |
| 2105 NE 12th St Oklahoma City, OK | 3.0 | 2.0 | 1180 | $1,650 | $1.40 | 23d | 1 | 0.56mi |
| 2135 N Lottie Ave Oklahoma City, OK | 3.0 | 2.0 | 1602 | $1,600 | $1.00 | 46d | 1 | 0.57mi |
| 1436 NE 8th St Oklahoma City, OK | 2.0 | 1.0 | 1048 | $1,095 | $1.04 | 46d | 1 | 0.58mi |
| 1424 NE 8th St Oklahoma City, OK | 2.0 | 1.0 | 992 | $1,275 | $1.29 | 0d | 1 | 0.59mi |
| 1706 NE 8th St Oklahoma City, OK | 3.0 | 2.0 | 1389 | $1,345 | $0.97 | 5d | 1 | 0.60mi |
| 943 East Dr Oklahoma City, OK | 1.0 | 1.0 | 900 | $995 | $1.11 | 6d | 1 | 0.64mi |
| 943 East Dr Oklahoma City, OK | 1.0 | 1.0 | 900 | $985 | $1.09 | 0d | 1 | 0.64mi |
| 939 East Dr Oklahoma City, OK | 2.0 | 1.0 | 1039 | $1,100 | $1.06 | 26d | 1 | 0.65mi |
| 2128 N Stonewall Ave Unit 1 Oklahoma City, OK | 2.0 | 1.0 | 960 | $800 | $0.83 | 5d | 1 | 0.66mi |
| 2143 NE 19th St Oklahoma City, OK | 2.0 | 1.0 | 1265 | $945 | $0.75 | 46d | 1 | 0.69mi |
| 2312 N Everest Ave Oklahoma City, OK | 3.0 | 1.0 | 1100 | $1,299 | $1.18 | 46d | 1 | 0.70mi |
| 2148 N Stonewall Ave Oklahoma City, OK | 2.0 | 1.0 | 1055 | $875 | $0.83 | 6d | 1 | 0.70mi |
| 2148 N Stonewall Ave Oklahoma City, OK | 2.0 | 1.0 | 1055 | $875 | $0.83 | 0d | 1 | 0.70mi |
| 2107 Hardin Dr Oklahoma City, OK | 3.0 | 1.0 | 999 | $875 | $0.88 | 46d | 1 | 0.71mi |
| 2225 Glen Ellyn St Oklahoma City, OK | 2.0 | 1.0 | 1095 | $925 | $0.84 | 0d | 1 | 0.73mi |
| 2225 Glen Ellyn St Oklahoma City, OK | 2.0 | 1.0 | 1095 | $925 | $0.84 | 46d | 1 | 0.73mi |
| 1812 NE 24th St Oklahoma City, OK | 3.0 | 1.0 | 1071 | $1,175 | $1.10 | 4d | 1 | 0.77mi |
| 2200 Hardin Dr Oklahoma City, OK | 3.0 | 1.0 | 1091 | $1,025 | $0.94 | 46d | 1 | 0.77mi |
| 2300 Granada Blvd Oklahoma City, OK | 3.0 | 1.0 | 999 | $1,000 | $1.00 | 14d | 1 | 0.80mi |
| 1217 Carverdale Dr Oklahoma City, OK | 2.0 | 2.0 | 1323 | $1,300 | $0.98 | 46d | 1 | 0.82mi |
| 1321 Bellevidere Dr Oklahoma City, OK | 3.0 | 2.0 | 1000 | $1,200 | $1.20 | 26d | 1 | 0.83mi |
| 912 NE 21st St Oklahoma City, OK | 2.0 | 1.0 | 1521 | $1,350 | $0.89 | 23d | 1 | 0.84mi |
| 912 NE 21st St Oklahoma City, OK | 2.0 | 1.0 | 1521 | $1,350 | $0.89 | 0d | 1 | 0.84mi |
| 2112 NE 23rd St Oklahoma City, OK | 3.0 | 1.0 | 1117 | $1,070 | $0.96 | 19d | 1 | 0.85mi |
| 735 NE 14th St Oklahoma City, OK | 2.0 | 1.0 | 1216 | $1,299 | $1.07 | 6d | 1 | 0.86mi |
| 735 NE 14th St Oklahoma City, OK | 2.0 | 1.0 | 1216 | $1,299 | $1.07 | 0d | 1 | 0.86mi |
| 737 NE 14th St Oklahoma City, OK | 2.0 | 2.0 | 1216 | $1,299 | $1.07 | 46d | 1 | 0.86mi |
| 1904 NE 25th St Oklahoma City, OK | 2.0 | 1.0 | 939 | $950 | $1.01 | 6d | 1 | 0.86mi |
Listing history 13 events
-
2026-06-22days on market $155,000 Active 52 DOM
-
2026-06-21days on market $155,000 Active 51 DOM
-
2026-06-18days on market $155,000 Active 48 DOM
-
2026-06-17days on market $155,000 Active 47 DOM
-
2026-06-16days on market $155,000 Active 46 DOM
-
2026-06-15days on market $155,000 Active 45 DOM
-
2026-06-13days on market $155,000 Active 43 DOM
-
2026-06-09days on market $155,000 Active 39 DOM
-
2026-06-08days on market $155,000 Active 38 DOM
-
2026-06-07days on market $155,000 Active 37 DOM
-
2026-06-05status $155,000 Active 34 DOM
-
2026-05-05price $155,000 817-char remark
Show marketing remark (817 chars)
Investment opportunity in the heart of Oklahoma City! This duplex at 1522 NE 14th St offers a total of 1,435 sqft, with each unit featuring 1 bedroom, 1 bathroom, and approximately 717 sqft of living space. One side is currently rented at $850/month on a month-to-month lease, providing immediate income with flexibility for future adjustments. Whether you're an investor looking to add to your portfolio or a first-time buyer wanting to house hack, this property checks all the boxes—live in one side and rent out the other. Conveniently located just minutes from OU Medical Center and the Oklahoma State Capitol, with quick access to major highways including I-235, I-35, and I-40, making commuting easy. Don’t miss your chance to own a cash-flowing property in a growing area with strong rental demand!
-
2026-04-17$160,000 Active 817-char remark
Show marketing remark (817 chars)
Investment opportunity in the heart of Oklahoma City! This duplex at 1522 NE 14th St offers a total of 1,435 sqft, with each unit featuring 1 bedroom, 1 bathroom, and approximately 717 sqft of living space. One side is currently rented at $850/month on a month-to-month lease, providing immediate income with flexibility for future adjustments. Whether you're an investor looking to add to your portfolio or a first-time buyer wanting to house hack, this property checks all the boxes—live in one side and rent out the other. Conveniently located just minutes from OU Medical Center and the Oklahoma State Capitol, with quick access to major highways including I-235, I-35, and I-40, making commuting easy. Don’t miss your chance to own a cash-flowing property in a growing area with strong rental demand!
ⓘ Source: listings_history table (triggers on properties + properties_extension) + one-shot
backfill from property_details.listing_events for pre-trigger history.
Tax reassessment forecast OK · Resets to sale price
- Current annual tax
- $1,167 · $97/mo
- Projected year-2 tax
- $1,395 · $116/mo
- Expected delta
- +$228/yr (+$19/mo · 19.6%)
ⓘ Screening estimate from a state-policy table — verify with the county assessor before closing.
Climate risk First Street
- Flood 1/10 Low FEMA zone X (unshaded) · 0% chance over 30 yrs
- Wildfire 1/10 Low
- Heat 5/10 Major 7 d/yr ≥107°F today · 18 d/yr by 30 yrs out
- Wind 2/10 Low 3% chance of damaging wind over 30 yrs
- Air quality 2/10 Low 1 unhealthy d/yr today · 2 by 30 yrs out
Nearby sold comps map
Loading sold comps map…
Walkable amenities ~0.75 mi
Loading nearby amenities…
Taxation est. · year 1
- Rental income
- $15,224
- − Mortgage interest
- −$8,682
- − Property taxes
- −$1,167
- − Insurance
- −$775
- − Repairs & maintenance
- −$1,218
- − Management
- −$1,218
- − Depreciation
- −$4,509
- Taxable loss
- −$2,345
- Est. tax savings @ 24.0%
- +$563
- After-tax cash flow
- $894/yr
For passive investors: Depreciation is non-cash, so a rental often shows a tax loss while cash-flowing — sheltering income. Rental losses are passive: they offset passive income freely, and up to $25,000/yr can offset ordinary (W-2) income if you actively participate and your MAGI is under $100k (phasing out to $0 by $150k); unused losses carry forward. On sale, claimed depreciation is recaptured at up to 25%, and gains may owe capital-gains tax (a 1031 exchange can defer both). Figures are a year-1 estimate at your 24.0% rate — not tax advice; consult a CPA.
Schools (NCES district)
- District
- Oklahoma City
- NCES district ID
- 4022770
- Math proficiency
- 7% ▼ -5.00%
- Reading proficiency
- 10% ▼ -6.00%
- Median HH income
- $35,606
- Composite
- 7.0/100
- National rank
- #9970
- State rank
- #254 of 270 in OK
Livability — Oklahoma City
- Score
- 80/100
- State rank
- #3
- US rank
- #1635
Category grades
Schools grade is shown separately in the Schools card above.
Census & demographics
- Census place
- Oklahoma City, OK
- County
- Oklahoma County · 771,644 people
- City population
- 498,656
- Metro
- Oklahoma City, OK
- Population (ZIP)
- 6,225
- Household income
- $23,413
- Rent vs Own
- Severe rent burden
- 681.0
Population outlook (Oklahoma County) Hauer SSP2
- Today (2025)
- 911,875 people
- By 2030
- 982,413 · +7.7%
- By 2040
- 1,130,468 · +24.0%
- By 2050
- 1,288,422 · +41.3%
- By 2075
- 1,711,482 · +87.7%
- By 2100
- 2,088,448 · +129.0%
Race, ethnicity, and origin ACS 2023
- Neighborhood character
- Diverse neighborhood (Simpson 0.56)
- Race & ethnicity
- Black 63% White 16% Two or more races 13% Hispanic / Latino 12% Asian 2%
- Hispanic origin (detail)
- Mexican 10%
- Foreign-born
- 10% · Canada, Guatemala, China
- Languages at home
- 87% English-only · Spanish 8% Other Indo-European 1% Other Asian/Pacific 1%
Political lean MEDSL · Oklahoma
- 2024 margin
- Toss-up / Even · D 48.0% · R 49.7% · Other 2.3%
- 2008→2024 swing
- +15.1pp toward D · 2008: -16.8pp · 2024: -1.7pp
- All cycles
- 2024: R+1.7 2020: R+1.1 2016: R+10.5 2012: R+16.7 2008: R+16.8
Not yet ingested
- Civics
- —
Market trends
- HPI YoY
- ▲ 2.42%
- Current HPI
- 192.3185
- Rent YoY
- —
- Metro
- Oklahoma City, OK
- State GDP YoY
- ▲ 1.55%
- F500 in state
- 6
Industry mix (Fortune 500 HQ in OK)
| Industry | F500 HQs | Revenue |
|---|---|---|
| Energy | 3 | $48B |
|
||
Price history
-3.1% since first listed2 events — show timeline
- 2026-05-05 Price Changed $155,000 MLSOK
- 2026-04-17 Listed $160,000 MLSOK
Property tax history
+14.7%/yrLatest (2025): $1,167 · +4.2% YoY. Source: county tax records.
Cash-flow waterfall
monthlySold comps — $/sqft
last 12 mo · ≤1 miLoading sold comps…