7339 Mcville Rd · Stanford, IN
Flood risk No data
- FEMA flood zone
- —
- Chance of flooding over 30 yrs
- —
- Est. flood insurance / yr
- —
Fire risk No data
- Est. fire insurance / yr
- —
Heat risk No data
- Hot days now (above threshold)
- —
- Hot days in 30 yrs
- —
Wind risk No data
- Chance of severe wind over 30 yrs
- —
Air-quality risk No data
- Unhealthy air days now
- —
- Unhealthy air days in 30 yrs
- —
Risk factors via First Street. Map © Google.
Why this score? — see what drove the B grade
The composite is a weighted blend of 9 inputs, each scored 0–100. Each bar is that input's sub-score; the figure is the points it added to the 100-point composite (weight × sub-score).
- Cash flow +30.0/30.0
- DSCR +10.0/10.0
- 1% rule +9.0/10.0
- ARV discount +7.5/15.0
- Appreciation +6.8/10.0
- Schools +2.9/10.0
- Rent growth +2.5/5.0
- Livability +2.5/5.0
- Condition / age +2.5/5.0
$99,000
🖨 Deal sheet 📄 Offer letter ✓ Due diligence
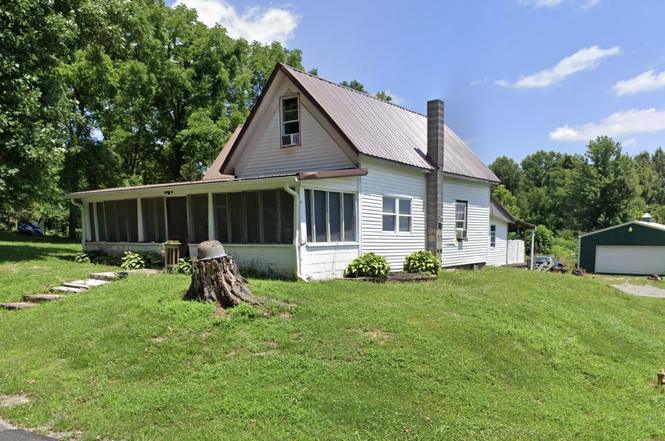
Listing remarks
Adorable Farmhouse in serene Solsberry, IN. Detached garage and lean-to provide ample work space for that hobby you’ve been thinking about taking up. And the quintessential country front porch, for sitting and sipping sweet tea when you decide to give up that hobby after a month. Two bedrooms, and 1 full bath with a half bath for your guests (you know, the one you actually have to clean) Large . 79 acre yard for frolicking, gardening, or frolicking while gardening. Don’t miss this opportunity live your best life in this storybook 1920 farmhouse.
Key facts
- Large yard
- Lean-to
- Detached garage
Tags
Property features AI
Exterior
- Parking: Detached 2-car garage
- Utilities: Public water; Septic tank sewer
- Home design: Single-family residence (site-built); 2 stories
- Construction: Vinyl siding; Block foundation
- Exterior features: Irregular-shaped lot; Lot includes other features
Interior
- Bathrooms: 1 full bathroom; 1 half bathroom; One main-level bathroom
- Heating & cooling: Window unit(s) for cooling
- Interior features: Partial basement; Total of 8 rooms
- Laundry & utility: Laundry on the main level
Neighborhood map
What this means for you Summary
Snapshot
- This is a 2-bed/1.5-bath single-family listed at $99k.
Deal economics
- At list price, monthly cash flow is $412 ($5k/yr) — positive.
- The deal already cash-flows at list — no discount required.
- Meets the 1% rule at list price ($1k rent vs $99k).
- Recommended offer: $87k (12.0% below list) — sets the bar for market timing.
Location & tenants
- Location reads: area grade B — affects rentability + tenant quality, not the cash-flow math above.
- Eastern Greene Schools (rural): math 31% / reading 37% proficiency, ranked #199 of 301 in IN (top 66%) — families likely to look elsewhere, expect single-tenant / working-renter base with shorter leases.
- Zoned schools: Eastern Greene Elementary School (math 32% / reading 27%, grade F, #697 of 994 statewide, top 73%, 433 students, 54% FRL); Eastern Greene Middle School (math 27% / reading 33%, grade F, #208 of 330 statewide, top 64%, 349 students, 51% FRL); Eastern Greene High School (math 42% / reading 77%, grade C+, #49 of 369 statewide, top 16%, 334 students, 43% FRL).
- Market conditions: 25 active listings in the ZIP.
Forward outlook
- In year one you build about $4k of equity ($684 loan paydown + $3k appreciation (3.5% local appreciation)).
- Greene County population projected at -22% by 2050 — secular population decline; favor cash flow + early exit over multi-decade hold.
- At projected returns (3.5% appreciation + 3.0% rent growth), your $28k cash investment doubles in ~3 years — after that, you're playing with house money.
- By year 8, paydown + projected appreciation supports a ~$31k cash-out refi (75% LTV) — recoverable capital for the next deal without selling this one.
Negotiation context
- It's been on market 297 days — a 12% lower offer ($87k) is reasonable based on typical stale-listing flexibility.
- 3 sale attempts since 3y ago; this cycle's ask has dropped $91k (48%) from the opening price — seller is motivated, your offer sets the floor, not the list.
Risks & watch-outs
- Watch-outs: built in 1920 — expect roof / HVAC / electrical / plumbing capex.
Questions for the listing agent
- It's been on market 297 days. Have you received any prior offers? Is the seller open to a 12% concession, seller financing, or rate buy-down credit?
- Built in 1920 — when were the roof, HVAC, electrical panel, plumbing, and water heater last replaced?
- Why hasn't it sold? Are there any deal-killer items the seller is aware of (foundation, flood, title, zoning, code violations)?
- Is there a deadline driving the sale (1031 exchange, divorce, estate, relocation)? That informs how much negotiation room exists.
- What's the average days-on-market for RENTAL listings here right now (not sales)? A rising rental-DOM trend means longer vacancies and softer asking-rent achievability than the comps imply.
- What's the recent tenant-quality profile in this submarket — average credit score on applications, eviction rate, late-payment / NSF rate, and stable-employment percentage? A property-management company in the area should have these aggregated.
- How much new for-sale + rental construction is in the pipeline within 1–3 miles? Heavy new supply typically softens prices + rents 12–24 months out; constrained supply supports both.
Investment metrics
- 1% rule
- 1.40% ✓
- Cap rate
- 11.29%
- Cash-on-cash
- 17.84%
- DSCR
- 1.79
- GRM
- 5.9
CMA / ARV
No comps found within radius.
Projected returns pro-forma
3.51% appreciation · 3.0% rent growth · sell at horizon
- IRR
- 25.3%
- Equity multiple
- 2.48×
- Total profit
- $40,897
- Equity at exit
- $47,391
- IRR
- 25.6%
- Equity multiple
- 4.81×
- Total profit
- $105,573
- Equity at exit
- $75,354
Cash invested: $27,720 (down + closing). Projections, not guarantees.
Landlord ↔ Tenant lean methodology
- Overall (STATE)
- 90 Strongly Landlord-Friendly
- State Indiana
- 90 Strongly Landlord-Friendly · R+11
- County
- — inherits STATE
- City
- — inherits STATE
ZIP-level market 47459
- Home prices YoY
- 1.8%
- Active inventory
- 25
- Price-to-rent
- 5.9×
Monthly cashflow live
- Estimated rent
- $1,388 medium interval (Pro) →
- Mortgage (P&I)
- −$519
- Tax est. 1.5%
- −$124 /mo · $1,485/yr
- Insurance
- −$41
- HOA
- −$0
- Vacancy / Maint / Mgmt
- −$291
- Net cashflow
- $412
Break-even live
UW: 25.0% down · 7.5% · 30yr · 1.5% tax · 5.0% vac · 8.0% maint · 8.0% mgmt
Financing live
Cash to close
- Down payment
- $24,750
- Closing costs
- $2,970
- Reserves months
- —
- Total cash needed
- —
Loan-product check · same deal, 3 products live
Conventional
25% down · 7.5% · 30yr
- Down + closing
- —
- Monthly P&I
- —
- Monthly cashflow
- —
- DSCR
- —
- Eligible?
- —
Personal DTI + credit; lowest rate.
DSCR
20% down · 8.5% · 30yr
- Down + closing
- —
- Monthly P&I
- —
- Monthly cashflow
- —
- DSCR
- —
- Eligible?
- —
No personal income docs; deal must DSCR.
Hard money
10% down · 12.0% · 12mo
- Down + closing
- —
- Monthly P&I
- —
- Monthly cashflow
- —
- DSCR
- —
- Eligible?
- —
Short-term bridge; refi at stabilization.
Listing history 21 events
-
2026-06-19days on market $99,000 Active 297 DOM
-
2026-06-18days on market $99,000 Active 296 DOM
-
2026-06-17days on market $99,000 Active 295 DOM
-
2026-06-16days on market $99,000 Active 294 DOM
-
2026-06-15days on market $99,000 Active 293 DOM
-
2026-06-14days on market $99,000 Active 291 DOM
-
2026-06-13days on market $99,000 Active 290 DOM
-
2026-06-10days on market $99,000 Active 288 DOM
-
2026-06-09days on market $99,000 Active 287 DOM
-
2026-06-08days on market $99,000 Active 286 DOM
-
2026-06-07days on market $99,000 Active 285 DOM
-
2026-06-02days on market $99,000 Active 280 DOM
-
2026-06-01days on market $99,000 Active 279 DOM
-
2026-05-31days on market $99,000 Active 278 DOM
-
2026-05-30days on market $99,000 Active 277 DOM
-
2026-04-23price $129,900
-
2025-08-26$189,900 Active
-
2024-10-22price $375,000
-
2024-08-17price $395,000
-
2024-05-07$425,000 Active
-
2023-06-12$499,000 Active
ⓘ Source: listings_history table (triggers on properties + properties_extension) + one-shot
backfill from property_details.listing_events for pre-trigger history.
Nearby sold comps map
Loading sold comps map…
Walkable amenities ~0.75 mi
Loading nearby amenities…
Taxation est. · year 1
- Rental income
- $16,652
- − Mortgage interest
- −$5,546
- − Property taxes
- −$1,485
- − Insurance
- −$495
- − Repairs & maintenance
- −$1,332
- − Management
- −$1,332
- − Depreciation
- −$2,880
- Taxable income
- $3,582
- Est. tax owed @ 24.0%
- −$860
- After-tax cash flow
- $4,085/yr
For passive investors: Depreciation is non-cash, so a rental often shows a tax loss while cash-flowing — sheltering income. Rental losses are passive: they offset passive income freely, and up to $25,000/yr can offset ordinary (W-2) income if you actively participate and your MAGI is under $100k (phasing out to $0 by $150k); unused losses carry forward. On sale, claimed depreciation is recaptured at up to 25%, and gains may owe capital-gains tax (a 1031 exchange can defer both). Figures are a year-1 estimate at your 24.0% rate — not tax advice; consult a CPA.
Schools (NCES district)
- District
- Eastern Greene Schools
- NCES district ID
- 1803090
- Math proficiency
- 31% ▼ -13.00%
- Reading proficiency
- 37% ▼ -11.00%
- Median HH income
- $47,226
- Composite
- 29.24/100
- National rank
- #6565
- State rank
- #199 of 301 in IN
Livability — Stanford
No livability data for this city. (Only ~50 U.S. cities are tracked.)
Census & demographics
- Population (ZIP)
- 3,904
Population outlook (Greene County) Hauer SSP2
- Today (2025)
- 30,724 people
- By 2030
- 29,506 · -4.0%
- By 2040
- 26,744 · -13.0%
- By 2050
- 23,879 · -22.3%
- By 2075
- 18,341 · -40.3%
- By 2100
- 13,976 · -54.5%
Race, ethnicity, and origin ACS 2023
- Neighborhood character
- Predominantly White (97%)
- Race & ethnicity
- White 97% Two or more races 2% Black 1%
- Common ancestry
- Lithuanian 2% Italian 2% Slovak 1%
Political lean MEDSL · Greene
- 2024 margin
- Solid R (+53.7) · D 22.4% · R 76.1% · Other 1.6%
- 2008→2024 swing
- -39.2pp toward R · 2008: -14.5pp · 2024: -53.7pp
- All cycles
- 2024: R+53.7 2020: R+52.2 2016: R+53.4 2012: R+31.4 2008: R+14.5
Not yet ingested
- Civics
- —
Market trends
- HPI YoY
- ▲ 3.51%
- Current HPI
- 198.8072
- Rent YoY
- —
- Metro
- —
- State GDP YoY
- ▲ 2.90%
- F500 in state
- 18
Industry mix (Fortune 500 HQ in IN)
| Industry | F500 HQs | Revenue |
|---|---|---|
| Industrial Machinery | 2 | $37B |
|
||
| Healthcare | 1 | $177B |
|
||
| Pharmaceuticals | 1 | $45B |
|
||
| Metals / Steel | 1 | $18B |
|
||
| Agriculture | 1 | $17B |
|
||
| Packaging | 1 | $12B |
|
||
Price history
-74.0% since first listed6 events — show timeline
- 2026-04-23 Price Changed $129,900 IRMLS
- 2025-08-26 Listed $189,900 IRMLS
- 2024-10-22 Price Changed $375,000 IRMLS
- 2024-08-17 Price Changed $395,000 IRMLS
- 2024-05-07 Listed $425,000 IRMLS
- 2023-06-12 Listed $499,000 IRMLS
Cash-flow waterfall
monthlySold comps — $/sqft
last 12 mo · ≤1 miLoading sold comps…