 Multi-family
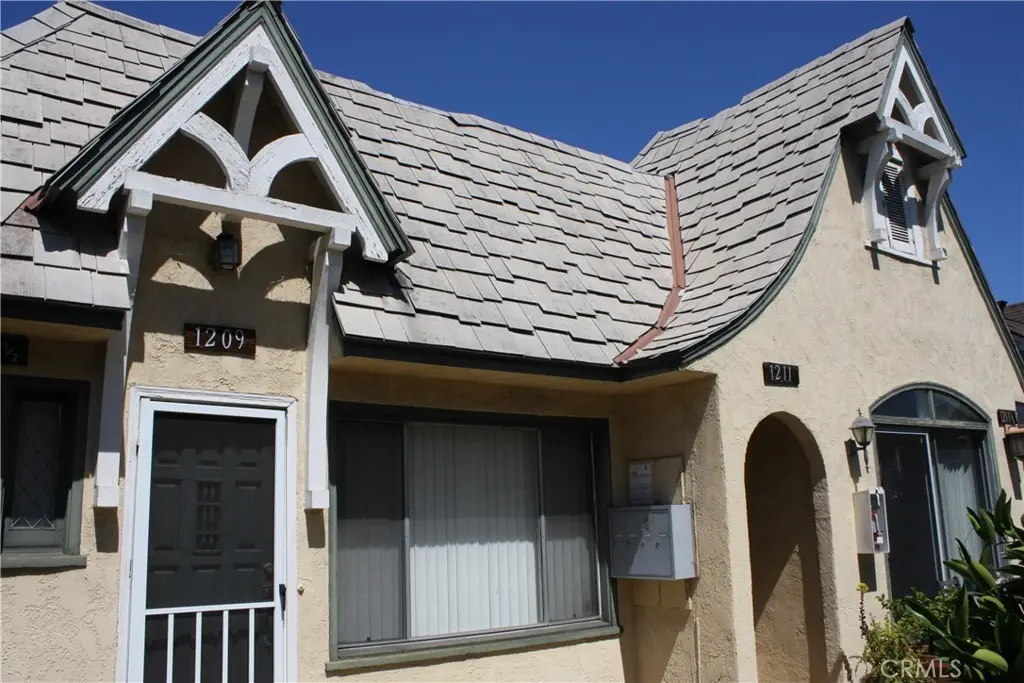
1209 Hyperion Ave · Los Angeles, CA
Flood risk 1/10 · Minimal
- FEMA flood zone
- X (unshaded)
- Chance of flooding over 30 yrs
- 0.0%
- Est. flood insurance / yr
- $507 – $1,088
Fire risk 1/10 · Minimal
- Est. fire insurance / yr
- $659 – $1,223
Heat risk 6/10 · Moderate
- Hot days now (above 92°F)
- 7 days/yr
- Hot days in 30 yrs
- 21 days/yr
Wind risk 1/10 · Minimal
- Chance of severe wind over 30 yrs
- —
Air-quality risk 5/10 · Moderate
- Unhealthy air days now
- 8 days/yr
- Unhealthy air days in 30 yrs
- 8 days/yr
Risk factors via First Street. Map © Google.
Why this score? — see what drove the D grade
The composite is a weighted blend of 9 inputs, each scored 0–100. Each bar is that input's sub-score; the figure is the points it added to the 100-point composite (weight × sub-score).
- ARV discount +15.0/15.0
- Cash flow +11.9/30.0
- Schools +3.6/10.0
- DSCR +3.5/10.0
- Livability +3.4/5.0
- Rent growth +2.5/5.0
- Condition / age +2.5/5.0
- 1% rule +2.4/10.0
- Appreciation +0.0/10.0
$1,129,000
🖨 Deal sheet 📄 Offer letter ✓ Due diligence
Multi-family units
County records classify this as Multi-Family (2-4 Unit). Listing-text estimate: 1 unit. estimate disagrees with records
Listing remarks
Charming Story Book Cottage sits in this Great Silver Lake location with Single Family Residential Homes all around the area. Quality properties like this come on the market so rarely as evident by the current Owners acquired this investment property in 1969 and held it in their portfolio ever since. The Property consists of four (4) large one (1) Bedroom one (1) Bath units. The upper units at 1209 and 1211 have some views off the back of the units. The property has off-street parking with one (1) parking spot for each unit and the potential for two (2) more off-street parking spots. The property features mature landscape with a large orange tree anchoring the front of the property producin
Key facts
- 4,800 sq ft lot
- 4 parking spots
- Built 1925
Property features AI
Finance
- Other: Parcel number 5429012022
- Financial info: Gross scheduled income / gross income: $80,438.80; Rent control applies; Tenant pays gas and electricity; Unit rents (current actual/total rent): $958.93; $1,486.29; $1,807.65; $2,450.37
Exterior
- Parking: Four uncovered parking spaces (total 4 parking spaces)
- Utilities: Public/District water; Sewer or septic (unknown)
- Home design: Multi-unit attached property; 4 total units; 2 total stories; Corner location (Hyperion & Effie); Urban community
- Construction: One building; Total building area 2,945; Year built source: Assessor
- Exterior features: No pool
Interior
- Bedrooms: Four 1-bedroom units (each unfurnished)
- Bathrooms: Each unit has 1 full bathroom
- Interior features: Entry on the first level; Has a view; Attached property with 2+ common walls
- Laundry & utility: No laundry features listed; One separate water meter for the property; Four separate gas meters; Four separate electric meters
Neighborhood map
What this means for you Summary
Snapshot
- This is a 4-bed/4.0-bath multifamily listed at $1.13M.
Deal economics
- At list price, monthly cash flow is $-288 ($-3k/yr) — negative.
- To cash-flow at today's rent, offer at most $1.08M (4.5% below list).
- To meet the 1% rule (rent ≥ 1% of price), the offer needs to be $836k (25.9% below list).
- Recommended offer: $836k (25.9% below list) — sets the bar for 1% rule.
- Cap rate 6.0% vs local median 2.1% in Los Angeles — top-decile yield for the area; either an underpriced asset or a hidden risk that comps aren't pricing in. Stress-test before assuming the spread holds.
Location & tenants
- Location reads 68/100 on livability (#273 in CA) — a middle-class / working-renter tenant base. Strengths: amenities A+, commute A+, employment B; Watch: health & safety C-, schools D+, crime F.
- Los Angeles Unified (urban): math 29% / reading 54% proficiency, ranked #223 of 517 in CA (top 43%) — families likely to look elsewhere, expect single-tenant / working-renter base with shorter leases; 67% free/reduced lunch — lower-income household profile, screen leases tightly.
- Market conditions: Rents flat; 76 active listings in the ZIP; 39 comparable units currently listed for rent nearby; rentals at typical pace (median 21d on market — plan ~3-4 weeks tenant-placement turnaround); 44% of comp listings sitting > 30 days — soft ceiling on asking rent; 19,697 units permitted in Los Angeles County in 2024 (9,426 in 5+ unit buildings).
- At $8,361/mo this rent would consume 166% of the median local household income ($60k/yr) (locally 3614% of renters already pay >50% of income on rent) — very limited rent-growth headroom before tenants either downsize or default.
Forward outlook
- Local home prices are declining (-3.0%/yr); year-one equity from $8k of loan paydown is wiped out by about $34k of value loss. Plan a longer hold.
- Los Angeles County population projected at +9% by 2050 — modest demand growth; plan on rents tracking national, not racing it.
Negotiation context
- It's been on market 50 days — a 3% lower offer ($1.10M) is reasonable based on typical stale-listing flexibility.
- Current owner paid $494k; list at $1.13M implies a 129% gain — meaningful room to come down on a strong offer.
Risks & watch-outs
- Watch-outs: built in 1925 — expect roof / HVAC / electrical / plumbing capex.
- Climate carrying-cost: extreme-heat days projected 7→21/yr by 2055 (HVAC capex compounding) — expect insurance premiums to compound above CPI over the hold.
Questions for the listing agent
- What do current leases actually rent for vs. the listed asking? Can we see a recent rent roll and the last 12 months of T-12 income?
- It's been on market 50 days. Have you received any prior offers? Is the seller open to a 26% concession, seller financing, or rate buy-down credit?
- Built in 1925 — when were the roof, HVAC, electrical panel, plumbing, and water heater last replaced?
- Is there a deadline driving the sale (1031 exchange, divorce, estate, relocation)? That informs how much negotiation room exists.
- Schools are D-rated, which usually means shorter tenancies and higher turnover. Who's the typical renter profile here, and what's been the actual vacancy rate?
- Crime grade is F in this area — have there been break-ins, vandalism, or insurance claims at this property in the last 3 years? What carrier currently insures it and at what premium?
- The area grade is low — what's the realistic commute time and amenity access for the typical tenant pool here? Any planned neighborhood developments (good or bad) we should know about?
- What's the average days-on-market for RENTAL listings here right now (not sales)? A rising rental-DOM trend means longer vacancies and softer asking-rent achievability than the comps imply.
- What's the recent tenant-quality profile in this submarket — average credit score on applications, eviction rate, late-payment / NSF rate, and stable-employment percentage? A property-management company in the area should have these aggregated.
- How much new apartment / multifamily construction is in the pipeline within 1–3 miles? Heavy new supply (>2% of stock underway) typically softens rents 12–24 months out; light construction supports rent growth.
Investment metrics
- 1% rule
- 0.74% ✗
- Cap rate
- 5.99%
- Cash-on-cash
- -1.09%
- DSCR
- 0.95
- GRM
- 11.3
CMA / ARV
- ARV (median comp)
- $1,425,434
- List price
- $1,129,000
- Delta
- -20.80%
- Verdict
- UNDERPRICED
- Comps
- 20 within 1.0 mi
Show comp detail 7 sales within ~0.75 mi
| Address | Dist | Beds/Ba | Sqft | Sold | Price | $/sf | Match |
|---|---|---|---|---|---|---|---|
| 1018 Manzanita St | 0.30mi | 5/5.0 (+1) | 3,108 (+6%) | 1mo | $2,450,000 | $788 | 67 |
| 1163 Hyperion Ave | 0.05mi | 5/5.0 (+1) | 2,677 (-9%) | 20mo | $1,200,000 | $448 | 56 |
| 1700 N Occidental Blvd | 0.69mi | 4/4.0 | 2,759 (-6%) | 4mo | $1,585,000 | $574 | 54 |
| 941 Robinson St | 0.67mi | 4/3.0 | 2,830 (-4%) | 19mo | $1,345,000 | $475 | 42 |
| 3303 Hamilton Way | 0.56mi | 4/4.0 | 2,626 (-11%) | 16mo | $1,000,000 | $381 | 42 |
| 1664 1666 Elevado St | 0.65mi | 4/3.0 | 3,157 (+7%) | 14mo | $1,650,000 | $523 | 42 |
| 3432 Larissa Dr | 0.47mi | 5/3.0 (+1) | 3,352 (+14%) | 7mo | $1,430,000 | $427 | 40 |
Match score weights: distance 35% · size 25% · config 20% · recency 20%. Top-matched comps best support the ARV.
Projected returns pro-forma
-3.0% appreciation · 0.19% rent growth · sell at horizon
- IRR
- -21.0%
- Equity multiple
- 0.29×
- Total profit
- $-224,687
- Equity at exit
- $168,338
- IRR
- -21.4%
- Equity multiple
- 0.02×
- Total profit
- $-310,189
- Equity at exit
- $97,615
Cash invested: $316,120 (down + closing). Projections, not guarantees.
Landlord ↔ Tenant lean methodology
- Overall (CITY)
- 0 Strongly Tenant-Friendly
- State California
- 18 Strongly Tenant-Friendly · D+13
- County
- — inherits STATE
- City Los Angeles
- 0 Strongly Tenant-Friendly · D+22
ZIP-level market 90029
- Rents YoY
- 0.2%
- Active inventory
- 76
- Price-to-rent
- 11.3×
Monthly cashflow live
- Estimated rent
- $8,361 high interval (Pro) →
- Mortgage (P&I)
- −$5,921
- Tax from tax record
- −$502 /mo · $6,020/yr
- Insurance
- −$470
- HOA
- −$0
- Vacancy / Maint / Mgmt
- −$1,756
- Net cashflow
- $-288
Break-even live
UW: 25.0% down · 7.5% · 30yr · 1.5% tax · 5.0% vac · 8.0% maint · 8.0% mgmt
Financing live
Cash to close
- Down payment
- $282,250
- Closing costs
- $33,870
- Reserves months
- —
- Total cash needed
- —
Loan-product check · same deal, 3 products live
Conventional
25% down · 7.5% · 30yr
- Down + closing
- —
- Monthly P&I
- —
- Monthly cashflow
- —
- DSCR
- —
- Eligible?
- —
Personal DTI + credit; lowest rate.
DSCR
20% down · 8.5% · 30yr
- Down + closing
- —
- Monthly P&I
- —
- Monthly cashflow
- —
- DSCR
- —
- Eligible?
- —
No personal income docs; deal must DSCR.
Hard money
10% down · 12.0% · 12mo
- Down + closing
- —
- Monthly P&I
- —
- Monthly cashflow
- —
- DSCR
- —
- Eligible?
- —
Short-term bridge; refi at stabilization.
Rent comps 39 comps
| Address | Beds | Baths | Sqft | Rent | $/sqft | DOM | Units | Dist |
|---|---|---|---|---|---|---|---|---|
| 1221 Myra Ave Los Angeles, CA | 1.0–6.0 | 1.0–5.0 | 1248 | $5,305 | $4.25 | 1d | 6 | 0.20mi |
| 1045 Manzanita St Los Angeles, CA | 3.0 | 3.5 | 1938 | $6,600 | $3.41 | 19d | 1 | 0.29mi |
| 1937 Cedar Lodge Ter Los Angeles, CA | 3.0 | 2.0 | 2279 | $15,000 | $6.58 | 43d | 1 | 0.34mi |
| 1307 Lucile Ave Los Angeles, CA | 4.0 | 2.0 | 2001 | $10,500 | $5.25 | 20d | 1 | 0.49mi |
| 1307 Lucile Ave Los Angeles, CA | 4.0 | 2.0 | 2001 | $10,500 | $5.25 | 24d | 1 | 0.49mi |
| 1307 Lucile Ave Los Angeles, CA | 4.0 | 2.0 | 2001 | $10,500 | $5.25 | 43d | 1 | 0.49mi |
| 2224 Ronda Vista Dr Los Angeles, CA | 3.0 | 3.0 | 2281 | $9,200 | $4.03 | 43d | 1 | 0.53mi |
| 2151 Kenilworth Ave Los Angeles, CA | 3.0 | 2.0 | 2156 | $9,100 | $4.22 | 10d | 1 | 0.61mi |
| 2300 Ronda Vista Dr Los Angeles, CA | 3.0 | 4.0 | 2719 | $11,995 | $4.41 | 13d | 1 | 0.67mi |
| 2300 Ronda Vista Dr Los Angeles, CA | 3.0 | 4.0 | 2719 | $12,495 | $4.60 | 43d | 1 | 0.67mi |
| 2383 Panorama Ter Los Angeles, CA | 5.0 | 3.0 | 3200 | $15,000 | $4.69 | 2d | 1 | 0.71mi |
| 4418 Kingswell Ave Los Angeles, CA | 3.0 | 3.0 | 2180 | $6,500 | $2.98 | 5d | 1 | 0.74mi |
| 2258 Moreno Dr Los Angeles, CA | 3.0 | 3.0 | 2214 | $7,500 | $3.39 | 43d | 1 | 0.75mi |
| 1856 Silverwood Ter Los Angeles, CA | 3.0 | 2.5 | 2000 | $6,500 | $3.25 | 43d | 1 | 0.78mi |
| 1781 N Benton Way Los Angeles, CA | 5.0 | 3.0 | 2904 | $7,500 | $2.58 | 43d | 1 | 0.85mi |
| 1301 Angelus Ave Los Angeles, CA | 5.0 | 3.0 | 3003 | $10,300 | $3.43 | 43d | 1 | 0.88mi |
| 3024 Angus St Los Angeles, CA | 3.0 | 3.0 | 2846 | $11,000 | $3.87 | 43d | 1 | 0.95mi |
| 2512 Berkeley Ave Los Angeles, CA | 4.0 | 4.0 | 3150 | $10,395 | $3.30 | 43d | 1 | 0.95mi |
| 2512 Berkeley Ave Los Angeles, CA | 4.0 | 4.0 | 3150 | $10,475 | $3.33 | 17d | 1 | 0.95mi |
| 2240 Ewing St Los Angeles, CA | 4.0 | 3.5 | 3345 | $14,500 | $4.33 | 43d | 1 | 1.04mi |
| 2030 Talmadge St Los Angeles, CA | 4.0 | 4.5 | 4035 | $22,000 | $5.45 | 43d | 1 | 1.05mi |
| 1427 Waterloo St Los Angeles, CA | 3.0 | 3.5 | 2184 | $6,500 | $2.98 | 1d | 1 | 1.08mi |
| 2926 Rowena Ave Los Angeles, CA | 3.0 | 3.5 | 1962 | $6,400 | $3.26 | 20d | 1 | 1.12mi |
| 2926 Rowena Ave #2 Los Angeles, CA | 3.0 | 3.5 | 1962 | $6,400 | $3.26 | 5d | 1 | 1.12mi |
| 2820 Rowena Ave Unit 1 Los Angeles, CA | 4.0 | 3.0 | 2321 | $6,783 | $2.92 | 2d | 1 | 1.17mi |
| 2820 Rowena Ave Unit 3 Los Angeles, CA | 3.0 | 2.5 | 2348 | $6,875 | $2.93 | 2d | 1 | 1.17mi |
| 2822 Avenel St Los Angeles, CA | 3.0 | 3.5 | 2071 | $8,500 | $4.10 | 43d | 1 | 1.18mi |
| 2824 1/2 Avenel St Los Angeles, CA | 3.0 | 3.5 | 2071 | $8,500 | $4.10 | 43d | 1 | 1.18mi |
| 2824 Rowena Ave Unit C Los Angeles, CA | 3.0 | 2.5 | 2348 | $6,875 | $2.93 | 3d | 1 | 1.18mi |
| 2824 Rowena Ave Unit A Los Angeles, CA | 4.0 | 3.0 | 2321 | $6,783 | $2.92 | 3d | 1 | 1.18mi |
| 4606 Greenwood Pl Los Angeles, CA | 4.0 | 3.0 | 2400 | $6,950 | $2.90 | 3d | 1 | 1.22mi |
| 2216 Bancroft Ave Los Angeles, CA | 3.0 | 3.5 | 2616 | $8,000 | $3.06 | 15d | 1 | 1.25mi |
| 2625 Ivan Hill Ter Los Angeles, CA | 3.0 | 2.5 | 2100 | $7,500 | $3.57 | 43d | 1 | 1.26mi |
| 1935 N Catalina St Los Angeles, CA | 4.0 | 3.0 | 2427 | $14,500 | $5.97 | 15d | 1 | 1.31mi |
| 1015 Rosemont Ave Unit 1015 1/2 Rosemont Los Angeles, CA | 5.0 | 4.0 | 2100 | $6,795 | $3.24 | 7d | 1 | 1.32mi |
| 3084 St George St Los Angeles, CA | 3.0 | 3.0 | 2113 | $7,795 | $3.69 | 5d | 1 | 1.34mi |
| 3365 Ley Dr Los Angeles, CA | 4.0 | 3.0 | 2436 | $10,000 | $4.11 | 43d | 1 | 1.40mi |
| 1933 Lemoyne St Los Angeles, CA | 3.0 | 2.0 | 2000 | $8,495 | $4.25 | 10d | 1 | 1.40mi |
| 4053 Cromwell Ave Los Angeles, CA | 3.0 | 3.0 | 2515 | $10,500 | $4.17 | 43d | 1 | 1.49mi |
Listing history 15 events
-
2026-06-18days on market $1,129,000 Active 50 DOM
-
2026-06-17days on market $1,129,000 Active 49 DOM
-
2026-06-16days on market $1,129,000 Active 48 DOM
-
2026-06-15days on market $1,129,000 Active 47 DOM
-
2026-06-13days on market $1,129,000 Active 45 DOM
-
2026-06-09days on market $1,129,000 Active 41 DOM
-
2026-06-08days on market $1,129,000 Active 40 DOM
-
2026-06-07days on market $1,129,000 Active 39 DOM
-
2026-06-04days on market $1,129,000 Active 36 DOM
-
2026-06-03days on market $1,129,000 Active 35 DOM
-
2026-06-02days on market $1,129,000 Active 34 DOM
-
2026-06-01days on market $1,129,000 Active 33 DOM
-
2026-05-31days on market $1,129,000 Active 32 DOM
-
2026-04-29$1,129,000 Active 943-char remark
-
1983-11-18soldstatus $493,540
ⓘ Source: listings_history table (triggers on properties + properties_extension) + one-shot
backfill from property_details.listing_events for pre-trigger history.
Tax reassessment forecast CA · Resets to sale price
- Current annual tax
- $6,020 · $502/mo
- Projected year-2 tax
- $8,580 · $715/mo
- Expected delta
- +$2,560/yr (+$213/mo · 42.5%)
ⓘ Screening estimate from a state-policy table — verify with the county assessor before closing.
Climate risk First Street
- Flood 1/10 Low FEMA zone X (unshaded) · 0% chance over 30 yrs
- Wildfire 1/10 Low
- Heat 6/10 Major 7 d/yr ≥92°F today · 21 d/yr by 30 yrs out
- Wind 1/10 Low
- Air quality 5/10 Major 8 unhealthy d/yr today · 8 by 30 yrs out
Nearby sold comps map
Loading sold comps map…
Walkable amenities ~0.75 mi
Loading nearby amenities…
Taxation est. · year 1
- Rental income
- $100,332
- − Mortgage interest
- −$63,242
- − Property taxes
- −$6,020
- − Insurance
- −$5,645
- − Repairs & maintenance
- −$8,027
- − Management
- −$8,027
- − Depreciation
- −$32,844
- Taxable loss
- −$23,472
- Est. tax savings @ 24.0%
- +$5,633
- After-tax cash flow
- $2,183/yr
For passive investors: Depreciation is non-cash, so a rental often shows a tax loss while cash-flowing — sheltering income. Rental losses are passive: they offset passive income freely, and up to $25,000/yr can offset ordinary (W-2) income if you actively participate and your MAGI is under $100k (phasing out to $0 by $150k); unused losses carry forward. On sale, claimed depreciation is recaptured at up to 25%, and gains may owe capital-gains tax (a 1031 exchange can defer both). Figures are a year-1 estimate at your 24.0% rate — not tax advice; consult a CPA.
Schools (NCES district)
- District
- Los Angeles Unified
- NCES district ID
- 0622710
- Math proficiency
- 29% ▼ -4.00%
- Reading proficiency
- 54% ▲ 10.00%
- Median HH income
- $50,403
- Composite
- 35.67/100
- National rank
- #4875
- State rank
- #223 of 517 in CA
Livability — Los Angeles
- Score
- 68/100
- State rank
- #273
- US rank
- #9237
Category grades
Schools grade is shown separately in the Schools card above.
Census & demographics
- Census place
- Los Angeles, CA
- County
- Los Angeles County · 9,444,647 people
- City population
- 3,838,149
- Metro
- Los Angeles-Long Beach-Anaheim, CA
- Population (ZIP)
- 33,303
- Household income
- $60,440
- Rent vs Own
- Severe rent burden
- 3614.0
Population outlook (Los Angeles County) Hauer SSP2
- Today (2025)
- 10,940,515 people
- By 2030
- 11,256,481 · +2.9%
- By 2040
- 11,729,929 · +7.2%
- By 2050
- 11,948,407 · +9.2%
- By 2075
- 11,818,114 · +8.0%
- By 2100
- 10,842,928 · -0.9%
Race, ethnicity, and origin ACS 2023
- Neighborhood character
- Diverse neighborhood (Simpson 0.66)
- Race & ethnicity
- Hispanic / Latino 49% White 27% Asian 17% Two or more races 10% Black 4% Native American 1%
- Hispanic origin (detail)
- Mexican 19%
- Common ancestry
- Scotch-Irish 1% Romanian 1% Slovak 1%
- Foreign-born
- 49% · Canada, China, South Korea
- Languages at home
- 33% English-only · Spanish 45% Tagalog/Filipino 9% Other Indo-European 6%
Political lean MEDSL · Los Angeles
- 2024 margin
- Solid D (+32.9) · D 64.8% · R 31.9% · Other 3.3%
- 2008→2024 swing
- -7.4pp toward R · 2008: 40.4pp · 2024: 32.9pp
- All cycles
- 2024: D+32.9 2020: D+44.2 2016: D+48.0 2012: D+40.0 2008: D+40.4
Not yet ingested
- Civics
- —
Market trends
- HPI YoY
- ▼ -292.27%
- Current HPI
- 451.0593
- Rent YoY
- ▲ 0.19%
- Metro
- Los Angeles-Long Beach-Anaheim, CA
- State GDP YoY
- ▲ 3.21%
- F500 in state
- 116
Industry mix (Fortune 500 HQ in CA)
| Industry | F500 HQs | Revenue |
|---|---|---|
| Technology | 27 | $1,492B |
|
||
| Financial Services | 3 | $174B |
|
||
| Retail | 3 | $44B |
|
||
| Insurance | 3 | $26B |
|
||
| Media / Entertainment | 2 | $115B |
|
||
| Pharmaceuticals / Biotech | 2 | $62B |
|
||
Price history
+128.8% since first listed2 events — show timeline
- 2026-04-29 Listed $1,129,000 CRMLS
- 1983-11-18 Sold (Public Records) $493,540 Public Records
Property tax history
+11.2%/yrLatest (2025): $6,020 · +1.7% YoY. Source: county tax records.
Cash-flow waterfall
monthlySold comps — $/sqft
last 12 mo · ≤1 miLoading sold comps…