128 W 8th St · Beaver Dam, KY
Flood risk 1/10 · Minimal
- FEMA flood zone
- X (unshaded)
- Chance of flooding over 30 yrs
- 0.0%
- Est. flood insurance / yr
- $507 – $1,088
Fire risk 4/10 · Minor
- Est. fire insurance / yr
- $839 – $1,559
Heat risk 5/10 · Moderate
- Hot days now (above 107°F)
- 7 days/yr
- Hot days in 30 yrs
- 19 days/yr
Wind risk 3/10 · Minor
- Chance of severe wind over 30 yrs
- 6.0%
Air-quality risk 1/10 · Minimal
- Unhealthy air days now
- 0 days/yr
- Unhealthy air days in 30 yrs
- 0 days/yr
Risk factors via First Street. Map © Google.
Why this score? — see what drove the B- grade
The composite is a weighted blend of 9 inputs, each scored 0–100. Each bar is that input's sub-score; the figure is the points it added to the 100-point composite (weight × sub-score).
- Cash flow +29.5/30.0
- DSCR +10.0/10.0
- ARV discount +7.5/15.0
- 1% rule +7.3/10.0
- Livability +3.1/5.0
- Schools +3.0/10.0
- Rent growth +2.5/5.0
- Condition / age +2.5/5.0
- Appreciation +0.0/10.0
$81,900
🖨 Deal sheet (PDF) 📄 Offer letter ✓ Due diligence
Listing remarks MLS
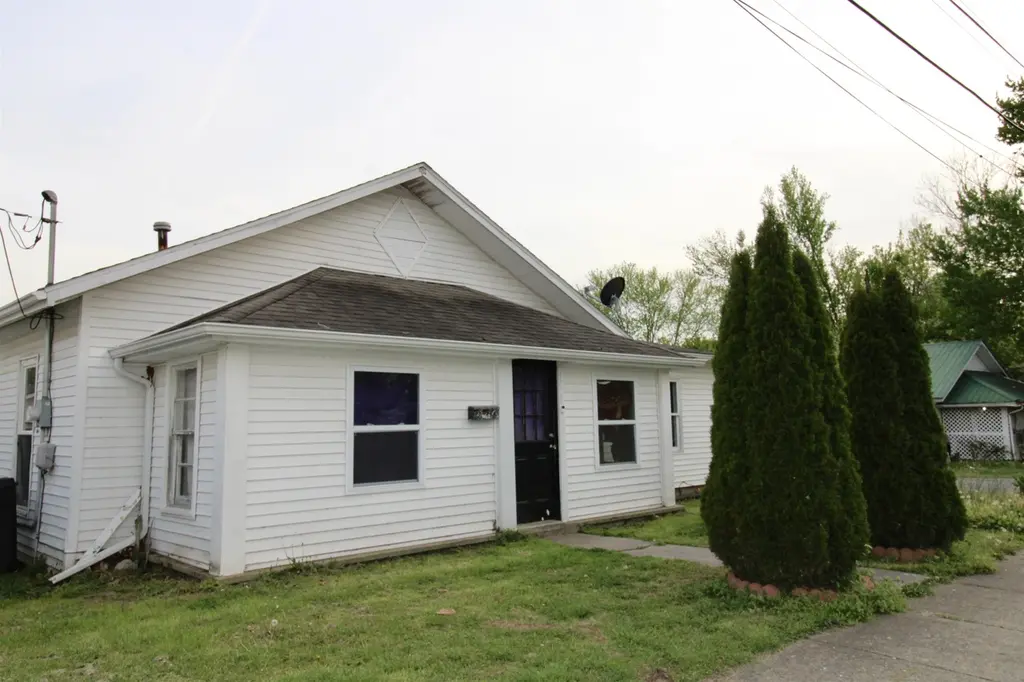
Great opportunity at just $84,900! This 3-bedroom, 1-bath home offers over 1,100 sq ft and is full of potential for the right buyer. Featuring a screened-in front porch, a spacious yard, and charming curb appeal with mature trees and inviting landscaping. Inside, the home offers a functional layout ready for your updates and vision. Perfect for investors, first-time buyers, or anyone looking to build equity with a little work. Located in the heart of town, just minutes from shopping, dining, and everyday conveniences. Affordable, well-located, and full of potential! Don’t miss this one!
Key facts
- Spacious yard
- Inviting landscaping
- Functional layout
Tags
Neighborhood map
What this means for you Summary
Snapshot
- This is a 3-bed/1.0-bath other listed at $82k.
Deal economics
- At list price, monthly cash flow is $292 ($4k/yr) — positive.
- The deal already cash-flows at list — no discount required.
- Meets the 1% rule at list price ($1k rent vs $82k).
- Recommended offer: $79k (3.0% below list) — sets the bar for market timing.
Location & tenants
- Location reads 62/100 on livability (#361 in KY) — a middle-class / working-renter tenant base. Strengths: crime A+, cost of living A+, housing A+; Watch: employment D+, schools F, amenities F.
- Ohio County (rural): math 29% / reading 44% proficiency, ranked #58 of 165 in KY (top 35%) — families likely to look elsewhere, expect single-tenant / working-renter base with shorter leases.
- Market conditions: 17 active listings in the ZIP; 17 units permitted in Ohio County in 2024 (0 in 5+ unit buildings).
Forward outlook
- Local home prices are declining (-3.0%/yr); year-one equity from $566 of loan paydown is wiped out by about $2k of value loss. Plan a longer hold.
- At projected returns (-3.0% appreciation + 3.0% rent growth), your $23k cash investment doubles in ~8 years — after that, you're playing with house money.
Negotiation context
- It's been on market 37 days — a 3% lower offer ($79k) is reasonable based on typical stale-listing flexibility.
- Current owner paid $47k; list at $82k implies a 74% gain — meaningful room to come down on a strong offer.
Risks & watch-outs
- Watch-outs: built in 1920 — expect roof / HVAC / electrical / plumbing capex.
- Climate carrying-cost: extreme-heat days projected 7→19/yr by 2055 (HVAC capex compounding) — expect insurance premiums to compound above CPI over the hold.
Questions for the listing agent
- It's been on market 37 days. Have you received any prior offers? Is the seller open to a 3% concession, seller financing, or rate buy-down credit?
- Built in 1920 — when were the roof, HVAC, electrical panel, plumbing, and water heater last replaced?
- Is there a deadline driving the sale (1031 exchange, divorce, estate, relocation)? That informs how much negotiation room exists.
- Schools are F-rated, which usually means shorter tenancies and higher turnover. Who's the typical renter profile here, and what's been the actual vacancy rate?
- What's the average days-on-market for RENTAL listings here right now (not sales)? A rising rental-DOM trend means longer vacancies and softer asking-rent achievability than the comps imply.
- What's the recent tenant-quality profile in this submarket — average credit score on applications, eviction rate, late-payment / NSF rate, and stable-employment percentage? A property-management company in the area should have these aggregated.
- How much new for-sale + rental construction is in the pipeline within 1–3 miles? Heavy new supply typically softens prices + rents 12–24 months out; constrained supply supports both.
Investment metrics
- 1% rule
- 1.23% ✓
- Cap rate
- 10.57%
- Cash-on-cash
- 15.27%
- DSCR
- 1.68
- GRM
- 6.8
CMA / ARV
- ARV (median comp)
- $167,988
- List price
- $81,900
- Delta
- -51.25%
- Verdict
- UNDERPRICED
- Comps
- 20 within 1.0 mi
Projected returns pro-forma
-3.0% appreciation · 3.0% rent growth · sell at horizon
- IRR
- 5.9%
- Equity multiple
- 1.23×
- Total profit
- $5,291
- Equity at exit
- $12,212
- IRR
- 15.3%
- Equity multiple
- 2.24×
- Total profit
- $28,442
- Equity at exit
- $7,081
Cash invested: $22,932 (down + closing). Projections, not guarantees.
Landlord ↔ Tenant lean methodology
- Overall (STATE)
- 83 Strongly Landlord-Friendly
- State Kentucky
- 83 Strongly Landlord-Friendly · R+16
- County
- — inherits STATE
- City
- — inherits STATE
ZIP-level market 42320
- Home prices YoY
- -20.1%
- Active inventory
- 17
- Price-to-rent
- 6.8×
Monthly cashflow live
- Estimated rent
- $1,004 medium interval (Pro) →
- Mortgage (P&I)
- −$429
- Tax from tax record
- −$38 /mo · $452/yr
- Insurance
- −$34
- HOA
- −$0
- Vacancy / Maint / Mgmt
- −$211
- Net cashflow
- $292
Break-even live
Sensitivity live
| Price | -10% $338 | -5% $315 | +0% $292 | +5% $269 | +10% $245 |
|---|---|---|---|---|---|
| Rent | -10% $213 | -5% $252 | +0% $292 | +5% $331 | +10% $371 |
| Rate | -1.0pp $333 | -0.5pp $313 | base $292 | +0.5pp $271 | +1.0pp $249 |
UW: 25.0% down · 7.5% · 30yr · 1.5% tax · 5.0% vac · 8.0% maint · 8.0% mgmt
Financing live
Cash to close
- Down payment
- $20,475
- Closing costs
- $2,457
- Reserves months
- —
- Total cash needed
- —
Loan-product check · same deal, 3 products live
Conventional
25% down · 7.5% · 30yr
- Down + closing
- —
- Monthly P&I
- —
- Monthly cashflow
- —
- DSCR
- —
- Eligible?
- —
Personal DTI + credit; lowest rate.
DSCR
20% down · 8.5% · 30yr
- Down + closing
- —
- Monthly P&I
- —
- Monthly cashflow
- —
- DSCR
- —
- Eligible?
- —
No personal income docs; deal must DSCR.
Hard money
10% down · 12.0% · 12mo
- Down + closing
- —
- Monthly P&I
- —
- Monthly cashflow
- —
- DSCR
- —
- Eligible?
- —
Short-term bridge; refi at stabilization.
Listing history 3 events
-
2026-05-18price $81,900 599-char remark
Show marketing remark (599 chars)
Great opportunity at just $84,900! This 3-bedroom, 1-bath home offers over 1,100 sq ft and is full of potential for the right buyer. Featuring a screened-in front porch, a spacious yard, and charming curb appeal with mature trees and inviting landscaping. Inside, the home offers a functional layout ready for your updates and vision. Perfect for investors, first-time buyers, or anyone looking to build equity with a little work. Located in the heart of town, just minutes from shopping, dining, and everyday conveniences. Affordable, well-located, and full of potential! Don’t miss this one!
-
2026-04-20$84,900 Active 599-char remark
Show marketing remark (599 chars)
Great opportunity at just $84,900! This 3-bedroom, 1-bath home offers over 1,100 sq ft and is full of potential for the right buyer. Featuring a screened-in front porch, a spacious yard, and charming curb appeal with mature trees and inviting landscaping. Inside, the home offers a functional layout ready for your updates and vision. Perfect for investors, first-time buyers, or anyone looking to build equity with a little work. Located in the heart of town, just minutes from shopping, dining, and everyday conveniences. Affordable, well-located, and full of potential! Don’t miss this one!
-
2021-02-04soldstatus $47,000
ⓘ Source: listings_history table (triggers on properties + properties_extension) + one-shot
backfill from property_details.listing_events for pre-trigger history.
Tax reassessment forecast KY · Resets to sale price
- Current annual tax
- $452 · $38/mo
- Projected year-2 tax
- $704 · $59/mo
- Expected delta
- +$253/yr (+$21/mo · 55.9%)
ⓘ Screening estimate from a state-policy table — verify with the county assessor before closing.
Climate risk First Street
- Flood 1/10 Low FEMA zone X (unshaded) · 0% chance over 30 yrs
- Wildfire 4/10 Moderate
- Heat 5/10 Major 7 d/yr ≥107°F today · 19 d/yr by 30 yrs out
- Wind 3/10 Moderate 6% chance of damaging wind over 30 yrs
- Air quality 1/10 Low 0 unhealthy d/yr today · 0 by 30 yrs out
Nearby sold comps map
Loading sold comps map…
Walkable amenities ~0.75 mi
Loading nearby amenities…
Taxation est. · year 1
- Rental income
- $12,047
- − Mortgage interest
- −$4,588
- − Property taxes
- −$452
- − Insurance
- −$410
- − Repairs & maintenance
- −$964
- − Management
- −$964
- − Depreciation
- −$2,383
- Taxable income
- $2,288
- Est. tax owed @ 24.0%
- −$549
- After-tax cash flow
- $2,953/yr
For passive investors: Depreciation is non-cash, so a rental often shows a tax loss while cash-flowing — sheltering income. Rental losses are passive: they offset passive income freely, and up to $25,000/yr can offset ordinary (W-2) income if you actively participate and your MAGI is under $100k (phasing out to $0 by $150k); unused losses carry forward. On sale, claimed depreciation is recaptured at up to 25%, and gains may owe capital-gains tax (a 1031 exchange can defer both). Figures are a year-1 estimate at your 24.0% rate — not tax advice; consult a CPA.
Schools (NCES district)
- District
- Ohio County
- NCES district ID
- 2104500
- Math proficiency
- 29% ▼ -15.00%
- Reading proficiency
- 44% ▼ -13.00%
- Median HH income
- $39,068
- Composite
- 30.49/100
- National rank
- #6219
- State rank
- #58 of 165 in KY
Livability — Beaver Dam
- Score
- 62/100
- State rank
- #361
- US rank
- #17225
Category grades
Schools grade is shown separately in the Schools card above.
Census & demographics
- Census place
- Beaver Dam, KY
- Population (ZIP)
- 8,630
Population outlook (Ohio County) Hauer SSP2
- Today (2025)
- 24,945 people
- By 2030
- 25,153 · +0.8%
- By 2040
- 25,267 · +1.3%
- By 2050
- 25,019 · +0.3%
- By 2075
- 23,435 · -6.1%
- By 2100
- 19,314 · -22.6%
Race, ethnicity, and origin ACS 2023
- Neighborhood character
- Predominantly White (86%)
- Race & ethnicity
- White 86% Hispanic / Latino 11% Two or more races 8%
- Hispanic origin (detail)
- Mexican 6%
- Common ancestry
- Iranian 1% Serbian 1% Italian 1%
- Foreign-born
- 6% · Canada
- Languages at home
- 92% English-only · Spanish 8%
Political lean MEDSL · Ohio
- 2024 margin
- Solid R (+60.2) · D 19.1% · R 79.4% · Other 1.5%
- 2008→2024 swing
- -43.8pp toward R · 2008: -16.4pp · 2024: -60.2pp
- All cycles
- 2024: R+60.2 2020: R+55.5 2016: R+56.4 2012: R+36.1 2008: R+16.4
Not yet ingested
- Civics
- —
Market trends
- HPI YoY
- ▼ -43.26%
- Current HPI
- 171.8186
- Rent YoY
- —
- Metro
- —
- State GDP YoY
- ▲ 1.81%
- F500 in state
- 4
Industry mix (Fortune 500 HQ in KY)
| Industry | F500 HQs | Revenue |
|---|---|---|
| Healthcare | 1 | $118B |
|
||
| Food / Beverage | 1 | $7B |
|
||
Price history
+74.3% since first listed3 events — show timeline
- 2026-05-18 Price Changed $81,900 GORAMLS
- 2026-04-20 Listed $84,900 GORAMLS
- 2021-02-04 Sold (Public Records) $47,000 Public Records
Property tax history
+2.9%/yrLatest (2025): $452 · -0.3% YoY. Source: county tax records.
Cash-flow waterfall
monthlySold comps — $/sqft
last 12 mo · ≤1 miLoading sold comps…