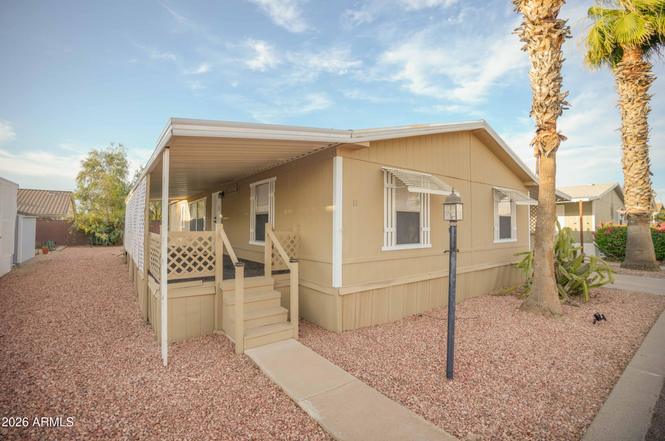
19802 N 32nd St #11 · Phoenix, AZ
Flood risk 1/10 · Minimal
- FEMA flood zone
- X (shaded)
- Chance of flooding over 30 yrs
- 0.0%
- Est. flood insurance / yr
- $507 – $1,088
Fire risk 4/10 · Minor
- Est. fire insurance / yr
- $610 – $1,132
Heat risk 8/10 · Major
- Hot days now (above 111°F)
- 6 days/yr
- Hot days in 30 yrs
- 17 days/yr
Wind risk 1/10 · Minimal
- Chance of severe wind over 30 yrs
- —
Air-quality risk 3/10 · Minor
- Unhealthy air days now
- 3 days/yr
- Unhealthy air days in 30 yrs
- 5 days/yr
Risk factors via First Street. Map © Google.
Why this score? — see what drove the B grade
The composite is a weighted blend of 9 inputs, each scored 0–100. Each bar is that input's sub-score; the figure is the points it added to the 100-point composite (weight × sub-score).
- Cash flow +30.0/30.0
- 1% rule +10.0/10.0
- DSCR +10.0/10.0
- ARV discount +7.5/15.0
- Schools +3.8/10.0
- Livability +3.8/5.0
- Rent growth +3.0/5.0
- Condition / age +2.5/5.0
- Appreciation +0.0/10.0
$119,900
🖨 Deal sheet 📄 Offer letter ✓ Due diligence
Listing remarks
Welcome to Desert Skies, a 55+ age-qualified active and vibrant community, where you can find yourself in your dream home. We have a beautiful fully renovated 3-bed, 2-bath home for sale featuring 1,456 sq ft of beautifully designed living space with lvp vinyl flooring throughout and brand new cabinets, quartz countertops stainless steel appliances and a lot more. Located near Scottsdale , this property offers the perfect blend of modern amenities and timeless charm. You will have access to a range of premium amenities, including amenities such as a resort-style pool, fitness center, and clubhouse. Conveniently situated near highways 51 and the 101, as well as shopping, dining, parks, and p
Key facts
- Fully renovated
- Quartz countertops
- Resort-style pool
Tags
Property features AI
Finance
- HOA & community: Land lease community — $979 monthly land lease; No association fees listed; Community amenities: pool, gated community, community spa (heated), fitness center, near bus stop
Exterior
- Parking: 2 covered parking spaces; 2-car carport
- Utilities: City water; Public sewer; 220 volts available in kitchen
- Home design: Manufactured/mobile home (attached); Leasehold ownership; Desert view
- Construction: Wood frame construction; Painted exterior; Composition roof
- Exterior features: Storage; Block fencing; Gravel/stone front and back yard
Interior
- Kitchen: Built-in microwave; Refrigerator; Dishwasher; Garbage disposal; 220-volt outlet in kitchen
- Bedrooms: Up to 3 bedrooms
- Flooring: Vinyl flooring
- Bathrooms: 2 full bathrooms
- Heating & cooling: Electric heating; Central air; Ceiling fans
- Interior features: Double vanity; Storage
Neighborhood map
What this means for you Summary
Snapshot
- This is a 3-bed/2.0-bath manufactured listed at $120k.
Deal economics
- At list price, monthly cash flow is $1k ($15k/yr) — positive.
- The deal already cash-flows at list — no discount required.
- Meets the 1% rule at list price ($3k rent vs $120k).
- Cap rate 18.5% vs local median 3.3% in Phoenix — top-decile yield for the area; either an underpriced asset or a hidden risk that comps aren't pricing in. Stress-test before assuming the spread holds.
Location & tenants
- Location reads 75/100 on livability (#16 in AZ, #3,924 nationally) — a middle-class / working-renter tenant base. Strengths: amenities A+, commute A+, housing A+; Watch: health & safety C-, crime F.
- Paradise Valley Unified District (4241) (urban): math 39% / reading 46% proficiency, ranked #56 of 249 in AZ (top 22%) — families likely to look elsewhere, expect single-tenant / working-renter base with shorter leases.
- Market conditions: Rents rising (+2.0%/yr); 218 active listings in the ZIP; 40 comparable units currently listed for rent nearby; rentals at typical pace (median 17d on market — plan ~3-4 weeks tenant-placement turnaround); high-income renter base; 36,011 units permitted in Maricopa County in 2024 (12,801 in 5+ unit buildings).
Forward outlook
- Local home prices are declining (-3.0%/yr); year-one equity from $829 of loan paydown is wiped out by about $4k of value loss. Plan a longer hold.
- Maricopa County population projected at +38% by 2050 — long-run rental-demand tailwind backs the buy-and-hold thesis.
- At projected returns (-3.0% appreciation + 2.0% rent growth), your $34k cash investment doubles in ~3 years — after that, you're playing with house money.
Negotiation context
- Only 2 days on market — expect competitive offers; lowballing is unlikely to land.
- 2 sale attempts since 2y ago with the ask held roughly flat each time — persistent listings suggest the price (not the market) is what's stuck; bring a comps-based counter.
Risks & watch-outs
- Climate carrying-cost: extreme-heat days projected 6→17/yr by 2055 (HVAC capex compounding) — expect insurance premiums to compound above CPI over the hold.
Questions for the listing agent
- Is there a deadline driving the sale (1031 exchange, divorce, estate, relocation)? That informs how much negotiation room exists.
- Crime grade is F in this area — have there been break-ins, vandalism, or insurance claims at this property in the last 3 years? What carrier currently insures it and at what premium?
- What's the average days-on-market for RENTAL listings here right now (not sales)? A rising rental-DOM trend means longer vacancies and softer asking-rent achievability than the comps imply.
- What's the recent tenant-quality profile in this submarket — average credit score on applications, eviction rate, late-payment / NSF rate, and stable-employment percentage? A property-management company in the area should have these aggregated.
- How much new for-sale + rental construction is in the pipeline within 1–3 miles? Heavy new supply typically softens prices + rents 12–24 months out; constrained supply supports both.
Investment metrics
- 1% rule
- 2.17% ✓
- Cap rate
- 18.55%
- Cash-on-cash
- 43.76%
- DSCR
- 2.95
- GRM
- 3.8
CMA / ARV
- ARV (on-the-fly)
- $270,816
- Comps found
- 12
Show comp detail 12 sales within ~0.75 mi
| Address | Dist | Beds/Ba | Sqft | Sold | Price | $/sf | Match |
|---|---|---|---|---|---|---|---|
| 19802 N 32nd St #76 | 0.00mi | 2/2.0 (-1) | 1,344 (-8%) | 4mo | $124,900 | $93 | 79 |
| 19802 N 32nd St #98 | 0.00mi | 3/2.0 | 1,614 (+11%) | 5mo | $65,000 | $40 | 78 |
| 2955 E Piute Ave | 0.31mi | 3/2.0 | 1,456 (0%) | 14mo | $320,000 | $220 | 74 |
| 2801 E Wahalla Ln | 0.49mi | 3/2.0 | 1,456 (0%) | 5mo | $327,500 | $225 | 73 |
| 2938 E Tonto Ln | 0.30mi | 3/2.0 | 1,362 (-6%) | 4mo | $300,000 | $220 | 72 |
| 19602 N 32nd St #35 | 0.14mi | 3/2.0 | 1,586 (+9%) | 9mo | $105,000 | $66 | 71 |
| 2952 E Wahalla Ln | 0.30mi | 4/2.0 (+1) | 1,441 (-1%) | 14mo | $178,000 | $124 | 68 |
| 19802 N 32nd St #144 | 0.16mi | 2/2.0 (-1) | 1,617 (+11%) | 3mo | $80,000 | $49 | 67 |
| 2701 E Utopia Rd #208 | 0.59mi | 2/2.0 (-1) | 1,440 (-1%) | 1mo | $85,000 | $59 | 65 |
| 2853 E Marco Polo Rd | 0.42mi | 3/2.0 | 1,353 (-7%) | 13mo | $335,000 | $248 | 58 |
| 2610 E Tonto Ln | 0.65mi | 3/2.0 | 1,344 (-8%) | 6mo | $250,000 | $186 | 51 |
| 2913 E Piute Ave | 0.40mi | 2/2.0 (-1) | 1,248 (-14%) | 3mo | $295,000 | $236 | 50 |
Match score weights: distance 35% · size 25% · config 20% · recency 20%. Top-matched comps best support the ARV.
Projected returns pro-forma
-3.0% appreciation · 1.98% rent growth · sell at horizon
- IRR
- 39.5%
- Equity multiple
- 2.67×
- Total profit
- $55,943
- Equity at exit
- $17,877
- IRR
- 45.4%
- Equity multiple
- 5.13×
- Total profit
- $138,662
- Equity at exit
- $10,367
Cash invested: $33,572 (down + closing). Projections, not guarantees.
Landlord ↔ Tenant lean methodology
- Overall (STATE)
- 87 Strongly Landlord-Friendly
- State Arizona
- 87 Strongly Landlord-Friendly · R+3
- County
- — inherits STATE
- City
- — inherits STATE
ZIP-level market 85050
- Home prices YoY
- -21.9%
- Rents YoY
- 2.0%
- Active inventory
- 218
- Price-to-rent
- 3.8×
Monthly cashflow live
- Estimated rent
- $2,599 high interval (Pro) →
- Mortgage (P&I)
- −$629
- Tax est. 1.5%
- −$150 /mo · $1,798/yr
- Insurance
- −$50
- HOA
- −$0
- Vacancy / Maint / Mgmt
- −$546
- Net cashflow
- $1,224
Break-even live
UW: 25.0% down · 7.5% · 30yr · 1.5% tax · 5.0% vac · 8.0% maint · 8.0% mgmt
Financing live
Cash to close
- Down payment
- $29,975
- Closing costs
- $3,597
- Reserves months
- —
- Total cash needed
- —
Loan-product check · same deal, 3 products live
Conventional
25% down · 7.5% · 30yr
- Down + closing
- —
- Monthly P&I
- —
- Monthly cashflow
- —
- DSCR
- —
- Eligible?
- —
Personal DTI + credit; lowest rate.
DSCR
20% down · 8.5% · 30yr
- Down + closing
- —
- Monthly P&I
- —
- Monthly cashflow
- —
- DSCR
- —
- Eligible?
- —
No personal income docs; deal must DSCR.
Hard money
10% down · 12.0% · 12mo
- Down + closing
- —
- Monthly P&I
- —
- Monthly cashflow
- —
- DSCR
- —
- Eligible?
- —
Short-term bridge; refi at stabilization.
Rent comps 40 comps
| Address | Beds | Baths | Sqft | Rent | $/sqft | DOM | Units | Dist |
|---|---|---|---|---|---|---|---|---|
| 19246 N 31st St Phoenix, AZ | 4.0 | 2.0 | 1370 | $2,375 | $1.73 | 7d | 1 | 0.27mi |
| 3133 E Kristal Way Phoenix, AZ | 3.0 | 2.5 | 1602 | $2,600 | $1.62 | 1d | 1 | 0.30mi |
| 3220 E Kerry Ln Phoenix, AZ | 3.0 | 2.0 | 1370 | $2,299 | $1.68 | 14d | 1 | 0.36mi |
| 3220 E Kerry Ln Phoenix, AZ | 3.0 | 2.0 | 1370 | $2,299 | $1.68 | 24d | 1 | 0.36mi |
| 3122 E Topeka Dr Phoenix, AZ | 3.0 | 2.0 | 1272 | $2,100 | $1.65 | 21d | 1 | 0.37mi |
| 20223 N 30th St Phoenix, AZ | 3.0 | 2.0 | 1467 | $2,300 | $1.57 | 1d | 1 | 0.38mi |
| 3321 E Blackhawk Dr Phoenix, AZ | 3.0 | 2.0 | 1564 | $2,495 | $1.60 | 3d | 1 | 0.38mi |
| 3039 E Hononegh Dr Phoenix, AZ | 3.0 | 2.0 | 1520 | $2,075 | $1.37 | 14d | 1 | 0.38mi |
| 3002 E Jeanette Ct Phoenix, AZ | 3.0 | 2.0 | 1748 | $2,700 | $1.54 | 17d | 1 | 0.42mi |
| 3415 E Menadota Dr Phoenix, AZ | 3.0 | 2.5 | 1814 | $2,550 | $1.41 | 14d | 1 | 0.42mi |
| 2934 E Blackhawk Dr Phoenix, AZ | 3.0 | 2.0 | 1467 | $2,280 | $1.55 | 1d | 1 | 0.43mi |
| 3056 E Siesta Ln Phoenix, AZ | 3.0 | 2.0 | 1476 | $2,375 | $1.61 | 12d | 1 | 0.46mi |
| 3214 E Siesta Ln Phoenix, AZ | 2.0 | 2.0 | 1228 | $2,200 | $1.79 | 24d | 1 | 0.52mi |
| 19460 N 27th Pl Phoenix, AZ | 4.0 | 2.0 | 1598 | $3,300 | $2.07 | 43d | 1 | 0.54mi |
| 19654 N 36th St Phoenix, AZ | 3.0 | 2.0 | 1638 | $2,600 | $1.59 | 17d | 1 | 0.54mi |
| 2636 E Tonto Ln Phoenix, AZ | 3.0 | 2.0 | 1850 | $2,800 | $1.51 | 24d | 1 | 0.58mi |
| 3301 E Wescott Dr Phoenix, AZ | 3.0 | 2.0 | 1101 | $1,995 | $1.81 | 24d | 1 | 0.59mi |
| 18626 N 29th Pl Phoenix, AZ | 4.0 | 2.0 | 1600 | $2,995 | $1.87 | 7d | 1 | 0.73mi |
| 3708 E Kerry Ln Phoenix, AZ | 3.0 | 2.5 | 1819 | $3,100 | $1.70 | 24d | 1 | 0.79mi |
| 19635 N Cave Creek Rd Phoenix, AZ | 3.0 | 1.0–2.0 | 999 | $1,933 | $1.93 | 1d | 22 | 0.80mi |
| 2500 E Marco Polo Rd Phoenix, AZ | 2.0 | 1.0–2.0 | 918 | $2,390 | $2.60 | 2d | 16 | 0.81mi |
| 18617 N 35th St Phoenix, AZ | 3.0 | 2.5 | 1425 | $2,400 | $1.68 | 10d | 1 | 0.82mi |
| 3745 E Kerry Ln Phoenix, AZ | 3.0 | 2.5 | 1818 | $2,250 | $1.24 | 17d | 1 | 0.85mi |
| 3771 E Kristal Way Phoenix, AZ | 4.0 | 2.5 | 1821 | $2,995 | $1.64 | 24d | 1 | 0.86mi |
| 3706 E Potter Dr Phoenix, AZ | 4.0 | 2.0 | 1782 | $2,550 | $1.43 | 24d | 1 | 0.95mi |
| 3706 E Potter Dr Phoenix, AZ | 4.0 | 2.0 | 1782 | $2,550 | $1.43 | 21d | 1 | 0.95mi |
| 3626 E Potter Dr Phoenix, AZ | 3.0 | 2.0 | 1519 | $2,500 | $1.65 | 24d | 1 | 0.95mi |
| 2336 E Utopia Rd Phoenix, AZ | 2.0–3.0 | 2.5 | 1327 | $2,395 | $1.80 | 5d | 1 | 0.98mi |
| 20729 N 37th Way Phoenix, AZ | 3.0 | 2.0 | 1670 | $3,000 | $1.80 | 14d | 1 | 0.98mi |
| 2335 E Utopia Rd Unit 16 Phoenix, AZ | 3.0 | 2.5 | 1426 | $2,550 | $1.79 | 18d | 1 | 0.98mi |
| 20050 N Cave Creek Rd Phoenix, AZ | 1.0–2.0 | 1.0–2.0 | 909 | $1,770 | $1.95 | 1d | 10 | 0.98mi |
| 20660 N 40th St #2137 Phoenix, AZ | 2.0 | 2.0 | 1131 | $3,500 | $3.09 | 43d | 1 | 1.08mi |
| 2755 E Michigan Ave Phoenix, AZ | 3.0 | 2.0 | 1316 | $2,700 | $2.05 | 17d | 1 | 1.09mi |
| 3916 E Morrow Dr Phoenix, AZ | 3.0 | 2.0 | 1350 | $2,425 | $1.80 | 11d | 1 | 1.12mi |
| 20660 N 40th St Phoenix, AZ | 2.0–3.0 | 2.0 | 1325 | $3,500 | $2.64 | 17d | 4 | 1.13mi |
| 2220 E Beardsley Rd Phoenix, AZ | 4.0 | 1.0–2.0 | 855 | $1,964 | $2.30 | 2d | 62 | 1.13mi |
| 2239 E Morrow Dr Phoenix, AZ | 3.0 | 3.0 | 1545 | $2,199 | $1.42 | 2d | 1 | 1.17mi |
| 18660 N Cave Creek Rd Phoenix, AZ | 1.0–3.0 | 1.0–2.0 | 961 | $1,955 | $2.03 | 1d | 11 | 1.18mi |
| 20053 N 21st Pl Phoenix, AZ | 4.0 | 2.0 | 1754 | $3,300 | $1.88 | 24d | 1 | 1.22mi |
| 2719 E Charleston Ave Phoenix, AZ | 3.0 | 1.5 | 1670 | $1,891 | $1.13 | 21d | 1 | 1.25mi |
Listing history 3 events
-
2026-06-18days on market $119,900 Active 2 DOM
-
2026-06-17remarks 699-char remark
-
2026-06-17$119,900 Active 1 DOM
ⓘ Source: listings_history table (triggers on properties + properties_extension) + one-shot
backfill from property_details.listing_events for pre-trigger history.
Climate risk First Street
- Flood 1/10 Low FEMA zone X (shaded) · 0% chance over 30 yrs
- Wildfire 4/10 Moderate
- Heat 8/10 Severe 6 d/yr ≥111°F today · 17 d/yr by 30 yrs out
- Wind 1/10 Low
- Air quality 3/10 Moderate 3 unhealthy d/yr today · 5 by 30 yrs out
Nearby sold comps map
Loading sold comps map…
Walkable amenities ~0.75 mi
Loading nearby amenities…
Taxation est. · year 1
- Rental income
- $31,182
- − Mortgage interest
- −$6,716
- − Property taxes
- −$1,798
- − Insurance
- −$600
- − Repairs & maintenance
- −$2,495
- − Management
- −$2,495
- − Depreciation
- −$3,488
- Taxable income
- $13,591
- Est. tax owed @ 24.0%
- −$3,262
- After-tax cash flow
- $11,429/yr
For passive investors: Depreciation is non-cash, so a rental often shows a tax loss while cash-flowing — sheltering income. Rental losses are passive: they offset passive income freely, and up to $25,000/yr can offset ordinary (W-2) income if you actively participate and your MAGI is under $100k (phasing out to $0 by $150k); unused losses carry forward. On sale, claimed depreciation is recaptured at up to 25%, and gains may owe capital-gains tax (a 1031 exchange can defer both). Figures are a year-1 estimate at your 24.0% rate — not tax advice; consult a CPA.
Schools (NCES district)
- District
- Paradise Valley Unified District (4241)
- NCES district ID
- 0405930
- Math proficiency
- 39% ▼ -11.00%
- Reading proficiency
- 46% ▼ -7.00%
- Median HH income
- $64,106
- Composite
- 37.89/100
- National rank
- #4316
- State rank
- #56 of 249 in AZ
Livability — Phoenix
- Score
- 75/100
- State rank
- #16
- US rank
- #3924
Category grades
Schools grade is shown separately in the Schools card above.
Census & demographics
- Census place
- Phoenix, AZ
- County
- Maricopa County · 4,537,380 people
- City population
- 1,500,198
- Metro
- Phoenix-Mesa-Chandler, AZ
- Population (ZIP)
- 33,118
- Household income
- $139,836
- Rent vs Own
- Severe rent burden
- 432.0
Population outlook (Maricopa County) Hauer SSP2
- Today (2025)
- 4,979,203 people
- By 2030
- 5,378,229 · +8.0%
- By 2040
- 6,156,598 · +23.6%
- By 2050
- 6,872,376 · +38.0%
- By 2075
- 8,401,270 · +68.7%
- By 2100
- 9,247,439 · +85.7%
Race, ethnicity, and origin ACS 2023
- Neighborhood character
- Predominantly White (71%)
- Race & ethnicity
- White 71% Hispanic / Latino 11% Two or more races 11% Asian 9% Black 2%
- Hispanic origin (detail)
- Mexican 8%
- Common ancestry
- Romanian 5% Italian 4% Lithuanian 3%
- Foreign-born
- 15% · Canada, China, Vietnam
- Languages at home
- 82% English-only · Spanish 6% Other Indo-European 5% Other Asian/Pacific 2%
Political lean MEDSL · Maricopa
- 2024 margin
- Toss-up / Even · D 47.7% · R 51.2% · Other 1.1%
- 2008→2024 swing
- +7.1pp toward D · 2008: -10.6pp · 2024: -3.5pp
- All cycles
- 2024: R+3.5 2020: D+2.2 2016: R+3.5 2012: R+12.0 2008: R+10.6
Not yet ingested
- Civics
- —
Market trends
- HPI YoY
- ▼ -86.38%
- Current HPI
- 308.7483
- Rent YoY
- ▲ 1.98%
- Metro
- Phoenix-Mesa-Chandler, AZ
- State GDP YoY
- ▲ 4.54%
- F500 in state
- 20
Industry mix (Fortune 500 HQ in AZ)
| Industry | F500 HQs | Revenue |
|---|---|---|
| Technology | 2 | $13B |
|
||
| Mining / Metals | 1 | $23B |
|
||
| Environmental Services | 1 | $16B |
|
||
| Metals / Steel | 1 | $14B |
|
||
| Technology Distribution | 1 | $9B |
|
||
| Homebuilding | 1 | $8B |
|
||
Price history
+19.9% since first listed7 events — show timeline
- 2026-06-16 Listed $119,900 ARMLS
- 2025-07-21 Listing Removed — ARMLS
- 2025-06-09 Price Changed $60,000 ARMLS
- 2025-04-22 Price Changed $65,000 ARMLS
- 2025-01-04 Price Changed $79,500 ARMLS
- 2024-11-14 Price Changed $95,000 ARMLS
- 2024-09-24 Listed $100,000 ARMLS
Cash-flow waterfall
monthlySold comps — $/sqft
last 12 mo · ≤1 miLoading sold comps…