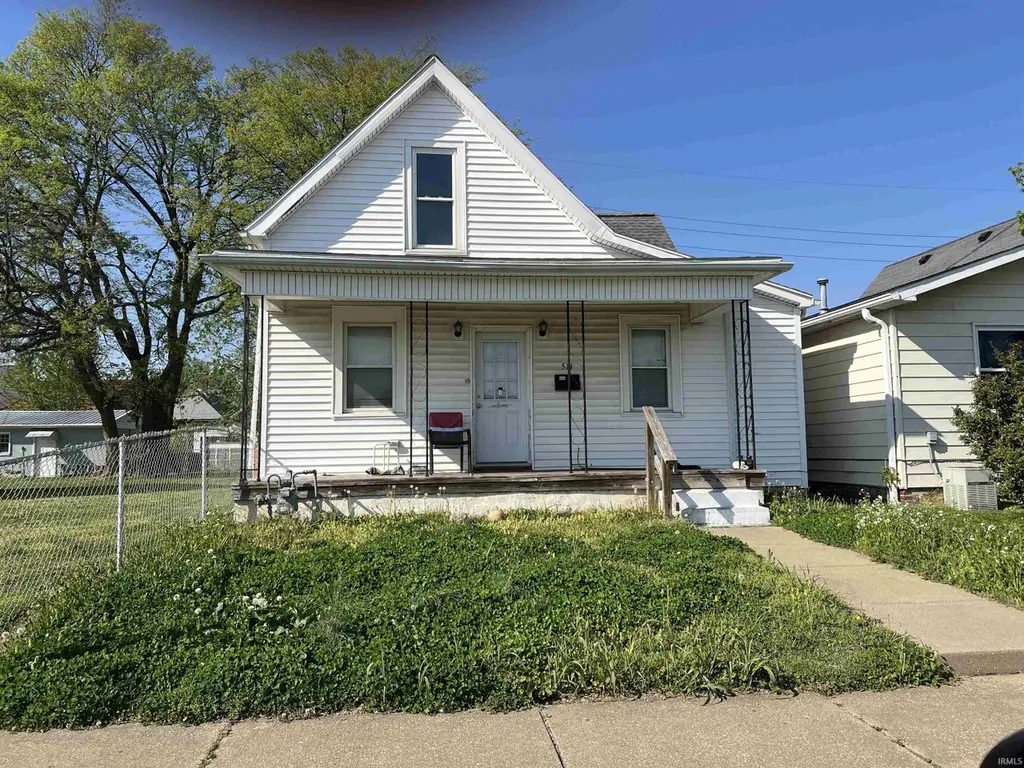
514 E Illinois St · Evansville, IN
Flood risk 1/10 · Minimal
- FEMA flood zone
- X (unshaded)
- Chance of flooding over 30 yrs
- 0.0%
- Est. flood insurance / yr
- $473 – $860
Fire risk 1/10 · Minimal
- Est. fire insurance / yr
- $717 – $1,331
Heat risk 5/10 · Moderate
- Hot days now (above 107°F)
- 7 days/yr
- Hot days in 30 yrs
- 19 days/yr
Wind risk 2/10 · Minimal
- Chance of severe wind over 30 yrs
- 4.0%
Air-quality risk 4/10 · Minor
- Unhealthy air days now
- 3 days/yr
- Unhealthy air days in 30 yrs
- 5 days/yr
Risk factors via First Street. Map © Google.
Why this score? — see what drove the B+ grade
The composite is a weighted blend of 9 inputs, each scored 0–100. Each bar is that input's sub-score; the figure is the points it added to the 100-point composite (weight × sub-score).
- Cash flow +30.0/30.0
- ARV discount +15.0/15.0
- DSCR +10.0/10.0
- 1% rule +9.9/10.0
- Rent growth +4.2/5.0
- Schools +3.3/10.0
- Livability +3.2/5.0
- Condition / age +2.5/5.0
- Appreciation +0.0/10.0
$76,900
🖨 Deal sheet (PDF) 📄 Offer letter ✓ Due diligence
Listing remarks
Must have at least 48 Hours' notice. Must have accepted offer Subject to Buyers Walk-Thru Attention Investors this is a package of 15 Properties. See the list on Addendum. 1011 Cherry St rents for $875.00. 1023 Cherry St rents for $973.00. 1105 E Gum St rents for $990.00. 1106/1108/1110 Rents for $2038.00. 1114 Cherry rents for $1050.00. 1130 S Grand rents for $983.00. 1219 S Linwood 2 units Rents for $1,720.00. 1301 & 1303 E Sycamore St Rents for $500.00 & 778.00 1712 Culverson rents for $990.00. 1829 Marshall rents for $801.00. 202 Waggoner Ave Rents for $788.00. 514 E Illinois Rents for $1,265.00. 764 Cross rents for $974.00. Total for package is 1,500.000
Key facts
- 3,088 sq ft lot
- Built 1919
- Listed 46 days
Property features AI
Exterior
- Utilities: Public water; Public sewer
- Home design: Single-family site-built home; One story
- Construction: Wood siding; Slab foundation; Built as site-built construction
- Exterior features: Level lot; Lot dimensions approximately 30 x 127
Interior
- Bathrooms: 1 full bathroom (main level)
- Heating & cooling: Natural gas forced-air heating; Window unit cooling
- Interior features: Basement present; 7 total rooms
- Laundry & utility: Main-level laundry
Neighborhood map
What this means for you Summary
Snapshot
- This is a 3-bed/1.0-bath single-family listed at $77k.
Deal economics
- At list price, monthly cash flow is $397 ($5k/yr) — positive.
- The deal already cash-flows at list — no discount required.
- Meets the 1% rule at list price ($1k rent vs $77k).
- Recommended offer: $75k (3.0% below list) — sets the bar for market timing.
- Cap rate 12.5% vs local median 4.6% in Evansville — top-decile yield for the area; either an underpriced asset or a hidden risk that comps aren't pricing in. Stress-test before assuming the spread holds.
Location & tenants
- Location reads 63/100 on livability (#416 in IN) — a middle-class / working-renter tenant base. Strengths: cost of living A+, housing A+, health & safety A+; Watch: crime F, commute F, employment D-.
- Evansville Vanderburgh School Corporation (urban): math 36% / reading 43% proficiency, ranked #153 of 301 in IN (top 51%) — families likely to look elsewhere, expect single-tenant / working-renter base with shorter leases.
- Zoned schools: Glenwood Leadership Academy (math 10% / reading 12%, grade F, #909 of 994 statewide, top 92%, 416 students, 88% FRL); Central High School (math 38% / reading 74%, grade C, #73 of 369 statewide, top 20%, 1,090 students, 52% FRL) — zoned schools average 70% FRL vs 50% district-wide (20 pts higher); higher-poverty schools than district average — tighter screening recommended.
- Market conditions: Rents rising fast (+6.7%/yr); 234 active listings in the ZIP; 4 comparable units currently listed for rent nearby; rentals at typical pace (median 23d on market — plan ~3-4 weeks tenant-placement turnaround); 508 units permitted in Vanderburgh County in 2024 (32 in 5+ unit buildings).
Forward outlook
- Local home prices are declining (-3.0%/yr); year-one equity from $532 of loan paydown is wiped out by about $2k of value loss. Plan a longer hold.
- At projected returns (-3.0% appreciation + 6.7% rent growth), your $22k cash investment doubles in ~5 years — after that, you're playing with house money.
Negotiation context
- It's been on market 46 days — a 3% lower offer ($75k) is reasonable based on typical stale-listing flexibility.
Risks & watch-outs
- Watch-outs: built in 1919 — expect roof / HVAC / electrical / plumbing capex.
- Climate carrying-cost: extreme-heat days projected 7→19/yr by 2055 (HVAC capex compounding) — expect insurance premiums to compound above CPI over the hold.
Questions for the listing agent
- It's been on market 46 days. Have you received any prior offers? Is the seller open to a 3% concession, seller financing, or rate buy-down credit?
- Built in 1919 — when were the roof, HVAC, electrical panel, plumbing, and water heater last replaced?
- Is there a deadline driving the sale (1031 exchange, divorce, estate, relocation)? That informs how much negotiation room exists.
- Schools are D-rated, which usually means shorter tenancies and higher turnover. Who's the typical renter profile here, and what's been the actual vacancy rate?
- Crime grade is F in this area — have there been break-ins, vandalism, or insurance claims at this property in the last 3 years? What carrier currently insures it and at what premium?
- What's the average days-on-market for RENTAL listings here right now (not sales)? A rising rental-DOM trend means longer vacancies and softer asking-rent achievability than the comps imply.
- What's the recent tenant-quality profile in this submarket — average credit score on applications, eviction rate, late-payment / NSF rate, and stable-employment percentage? A property-management company in the area should have these aggregated.
- How much new for-sale + rental construction is in the pipeline within 1–3 miles? Heavy new supply typically softens prices + rents 12–24 months out; constrained supply supports both.
Investment metrics
- 1% rule
- 1.49% ✓
- Cap rate
- 12.49%
- Cash-on-cash
- 22.12%
- DSCR
- 1.98
- GRM
- 5.6
CMA / ARV
- ARV (on-the-fly)
- $110,240
- Comps found
- 12
Show comp detail 12 sales within ~0.75 mi
| Address | Dist | Beds/Ba | Sqft | Sold | Price | $/sf | Match |
|---|---|---|---|---|---|---|---|
| 751 E Virginia St | 0.29mi | 4/2.0 (+1) | 2,084 (+0%) | 4mo | $147,000 | $71 | 74 |
| 116 E Virginia St | 0.32mi | 3/1.0 | 1,949 (-6%) | 12mo | $60,000 | $31 | 64 |
| 216 E Delaware St | 0.37mi | 3/2.0 | 2,184 (+5%) | 12mo | $215,000 | $98 | 60 |
| 656 E Oregon St | 0.54mi | 4/1.0 (+1) | 1,954 (-6%) | 4mo | $65,000 | $33 | 57 |
| 41 W Maryland St | 0.65mi | 3/2.0 | 1,960 (-6%) | 3mo | $85,000 | $43 | 54 |
| 401 E Iowa St | 0.25mi | 2/1.0 (-1) | 1,868 (-10%) | 17mo | $98,500 | $53 | 52 |
| 839 Lincoln Ave | 0.73mi | 4/2.0 (+1) | 2,059 (-1%) | 8mo | $148,000 | $72 | 49 |
| 109 W Indiana St | 0.51mi | 4/1.5 (+1) | 1,939 (-7%) | 12mo | $92,000 | $47 | 47 |
| 116 E Missouri St | 0.63mi | 3/1.0 | 1,944 (-6%) | 15mo | $45,000 | $23 | 47 |
| 1115 N Elliott St | 0.61mi | 3/1.0 | 1,816 (-13%) | 13mo | $99,000 | $55 | 40 |
| 409 S New York Ave | 0.72mi | 2/2.0 (-1) | 1,872 (-10%) | 7mo | $131,700 | $70 | 35 |
| 27 W Missouri St | 0.73mi | 3/2.0 | 2,288 (+10%) | 15mo | $35,000 | $15 | 33 |
Match score weights: distance 35% · size 25% · config 20% · recency 20%. Top-matched comps best support the ARV.
Projected returns pro-forma
-3.0% appreciation · 6.72% rent growth · sell at horizon
- IRR
- 18.9%
- Equity multiple
- 1.80×
- Total profit
- $17,276
- Equity at exit
- $11,466
- IRR
- 29.7%
- Equity multiple
- 4.13×
- Total profit
- $67,350
- Equity at exit
- $6,649
Cash invested: $21,532 (down + closing). Projections, not guarantees.
Landlord ↔ Tenant lean methodology
- Overall (STATE)
- 90 Strongly Landlord-Friendly
- State Indiana
- 90 Strongly Landlord-Friendly · R+11
- County
- — inherits STATE
- City
- — inherits STATE
ZIP-level market 47711
- Home prices YoY
- -32.3%
- Rents YoY
- 6.7%
- Active inventory
- 234
- Price-to-rent
- 5.6×
Monthly cashflow live
- Estimated rent
- $1,148 medium interval (Pro) →
- Mortgage (P&I)
- −$403
- Tax from tax record
- −$74 /mo · $893/yr
- Insurance
- −$32
- HOA
- −$0
- Vacancy / Maint / Mgmt
- −$241
- Net cashflow
- $397
Break-even live
Sensitivity live
| Price | -10% $440 | -5% $419 | +0% $397 | +5% $375 | +10% $353 |
|---|---|---|---|---|---|
| Rent | -10% $306 | -5% $352 | +0% $397 | +5% $442 | +10% $488 |
| Rate | -1.0pp $436 | -0.5pp $416 | base $397 | +0.5pp $377 | +1.0pp $357 |
UW: 25.0% down · 7.5% · 30yr · 1.5% tax · 5.0% vac · 8.0% maint · 8.0% mgmt
Financing live
Cash to close
- Down payment
- $19,225
- Closing costs
- $2,307
- Reserves months
- —
- Total cash needed
- —
Loan-product check · same deal, 3 products live
Conventional
25% down · 7.5% · 30yr
- Down + closing
- —
- Monthly P&I
- —
- Monthly cashflow
- —
- DSCR
- —
- Eligible?
- —
Personal DTI + credit; lowest rate.
DSCR
20% down · 8.5% · 30yr
- Down + closing
- —
- Monthly P&I
- —
- Monthly cashflow
- —
- DSCR
- —
- Eligible?
- —
No personal income docs; deal must DSCR.
Hard money
10% down · 12.0% · 12mo
- Down + closing
- —
- Monthly P&I
- —
- Monthly cashflow
- —
- DSCR
- —
- Eligible?
- —
Short-term bridge; refi at stabilization.
Rent comps 4 comps
| Address | Beds | Baths | Sqft | Rent | $/sqft | DOM | Units | Dist |
|---|---|---|---|---|---|---|---|---|
| 27 W Franklin St Evansville, IN | 4.0 | 2.5 | 2500 | $1,100 | $0.44 | 22d | 1 | 0.45mi |
| 121 E Florida St Evansville, IN | 4.0 | 2.0 | 1702 | $100 | $0.06 | 22d | 1 | 0.74mi |
| 1317 Harriet St Evansville, IN | 3.0 | 2.0 | 2000 | $995 | $0.50 | 15d | 1 | 1.02mi |
| 1213 Washington Ave Evansville, IN | 4.0 | 1.0 | 1984 | $1,595 | $0.80 | 22d | 1 | 1.38mi |
Listing history 16 events
-
2026-06-22days on market $76,900 Active 46 DOM
-
2026-06-18days on market $76,900 Active 43 DOM
-
2026-06-17days on market $76,900 Active 42 DOM
-
2026-06-16days on market $76,900 Active 41 DOM
-
2026-06-15days on market $76,900 Active 40 DOM
-
2026-06-14days on market $76,900 Active 38 DOM
-
2026-06-13days on market $76,900 Active 37 DOM
-
2026-06-10days on market $76,900 Active 35 DOM
-
2026-06-09days on market $76,900 Active 34 DOM
-
2026-06-08days on market $76,900 Active 33 DOM
-
2026-06-07days on market $76,900 Active 32 DOM
-
2026-06-02days on market $76,900 Active 27 DOM
-
2026-06-01days on market $76,900 Active 26 DOM
-
2026-05-31days on market $76,900 Active 25 DOM
-
2026-05-30days on market $76,900 Active 24 DOM
-
2026-05-05$76,900 Active
ⓘ Source: listings_history table (triggers on properties + properties_extension) + one-shot
backfill from property_details.listing_events for pre-trigger history.
Tax reassessment forecast IN · Partial reset (capped growth)
- Current annual tax
- $893 · $74/mo
- Projected year-2 tax
- $893 · $74/mo
- Expected delta
- $0/yr ($0/mo · 0.0%)
ⓘ Screening estimate from a state-policy table — verify with the county assessor before closing.
Climate risk First Street
- Flood 1/10 Low FEMA zone X (unshaded) · 0% chance over 30 yrs
- Wildfire 1/10 Low
- Heat 5/10 Major 7 d/yr ≥107°F today · 19 d/yr by 30 yrs out
- Wind 2/10 Low 4% chance of damaging wind over 30 yrs
- Air quality 4/10 Moderate 3 unhealthy d/yr today · 5 by 30 yrs out
Nearby sold comps map
Loading sold comps map…
Walkable amenities ~0.75 mi
Loading nearby amenities…
Taxation est. · year 1
- Rental income
- $13,771
- − Mortgage interest
- −$4,308
- − Property taxes
- −$893
- − Insurance
- −$384
- − Repairs & maintenance
- −$1,102
- − Management
- −$1,102
- − Depreciation
- −$2,237
- Taxable income
- $3,746
- Est. tax owed @ 24.0%
- −$899
- After-tax cash flow
- $3,864/yr
For passive investors: Depreciation is non-cash, so a rental often shows a tax loss while cash-flowing — sheltering income. Rental losses are passive: they offset passive income freely, and up to $25,000/yr can offset ordinary (W-2) income if you actively participate and your MAGI is under $100k (phasing out to $0 by $150k); unused losses carry forward. On sale, claimed depreciation is recaptured at up to 25%, and gains may owe capital-gains tax (a 1031 exchange can defer both). Figures are a year-1 estimate at your 24.0% rate — not tax advice; consult a CPA.
Schools (NCES district)
- District
- Evansville Vanderburgh School Corporation
- NCES district ID
- 1803450
- Math proficiency
- 36% ▼ -7.00%
- Reading proficiency
- 43% ▼ -3.00%
- Median HH income
- $43,270
- Composite
- 33.41/100
- National rank
- #5471
- State rank
- #153 of 301 in IN
Livability — Evansville
- Score
- 63/100
- State rank
- #416
- US rank
- #15047
Category grades
Schools grade is shown separately in the Schools card above.
Census & demographics
- Census place
- Evansville, IN
- County
- Vanderburgh County · 146,793 people
- City population
- 146,793
- Metro
- Evansville, IN-KY
- Population (ZIP)
- 30,944
- Household income
- $66,320
- Rent vs Own
- Severe rent burden
- 659.0
Population outlook (Vanderburgh County) Hauer SSP2
- Today (2025)
- 187,038 people
- By 2030
- 188,907 · +1.0%
- By 2040
- 190,272 · +1.7%
- By 2050
- 188,871 · +1.0%
- By 2075
- 180,751 · -3.4%
- By 2100
- 163,015 · -12.8%
Race, ethnicity, and origin ACS 2023
- Neighborhood character
- Predominantly White (85%)
- Race & ethnicity
- White 85% Black 8% Two or more races 5% Hispanic / Latino 2%
- Common ancestry
- Lithuanian 2% Romanian 2% Slovak 1%
- Foreign-born
- 2% · Canada
- Languages at home
- 97% English-only · Spanish 2%
Political lean MEDSL · Vanderburgh
- 2024 margin
- R (+12.7) · D 43.0% · R 55.6% · Other 1.4%
- 2008→2024 swing
- -15.1pp toward R · 2008: 2.5pp · 2024: -12.7pp
- All cycles
- 2024: R+12.7 2020: R+9.6 2016: R+16.9 2012: R+10.8 2008: D+2.5
Not yet ingested
- Civics
- —
Market trends
- HPI YoY
- ▼ -97.98%
- Current HPI
- 205.62
- Rent YoY
- ▲ 6.72%
- Metro
- Evansville, IN-KY
- State GDP YoY
- ▲ 2.90%
- F500 in state
- 18
Industry mix (Fortune 500 HQ in IN)
| Industry | F500 HQs | Revenue |
|---|---|---|
| Industrial Machinery | 2 | $37B |
|
||
| Healthcare | 1 | $177B |
|
||
| Pharmaceuticals | 1 | $45B |
|
||
| Metals / Steel | 1 | $18B |
|
||
| Agriculture | 1 | $17B |
|
||
| Packaging | 1 | $12B |
|
||
Price history
1 event — show timeline
- 2026-05-05 Listed $76,900 IRMLS
Cash-flow waterfall
monthlySold comps — $/sqft
last 12 mo · ≤1 miLoading sold comps…