1058 NE 1st St · Bearden, AR
Flood risk No data
- FEMA flood zone
- —
- Chance of flooding over 30 yrs
- —
- Est. flood insurance / yr
- —
Fire risk No data
- Est. fire insurance / yr
- —
Heat risk No data
- Hot days now (above threshold)
- —
- Hot days in 30 yrs
- —
Wind risk No data
- Chance of severe wind over 30 yrs
- —
Air-quality risk No data
- Unhealthy air days now
- —
- Unhealthy air days in 30 yrs
- —
Risk factors via First Street. Map © Google.
Why this score? — see what drove the C grade
The composite is a weighted blend of 9 inputs, each scored 0–100. Each bar is that input's sub-score; the figure is the points it added to the 100-point composite (weight × sub-score).
- Cash flow +21.2/30.0
- Appreciation +10.0/10.0
- DSCR +6.7/10.0
- ARV discount +6.4/15.0
- 1% rule +5.6/10.0
- Livability +3.1/5.0
- Rent growth +2.5/5.0
- Condition / age +2.5/5.0
- Schools +1.7/10.0
$119,900
🖨 Deal sheet 📄 Offer letter ✓ Due diligence
Listing remarks
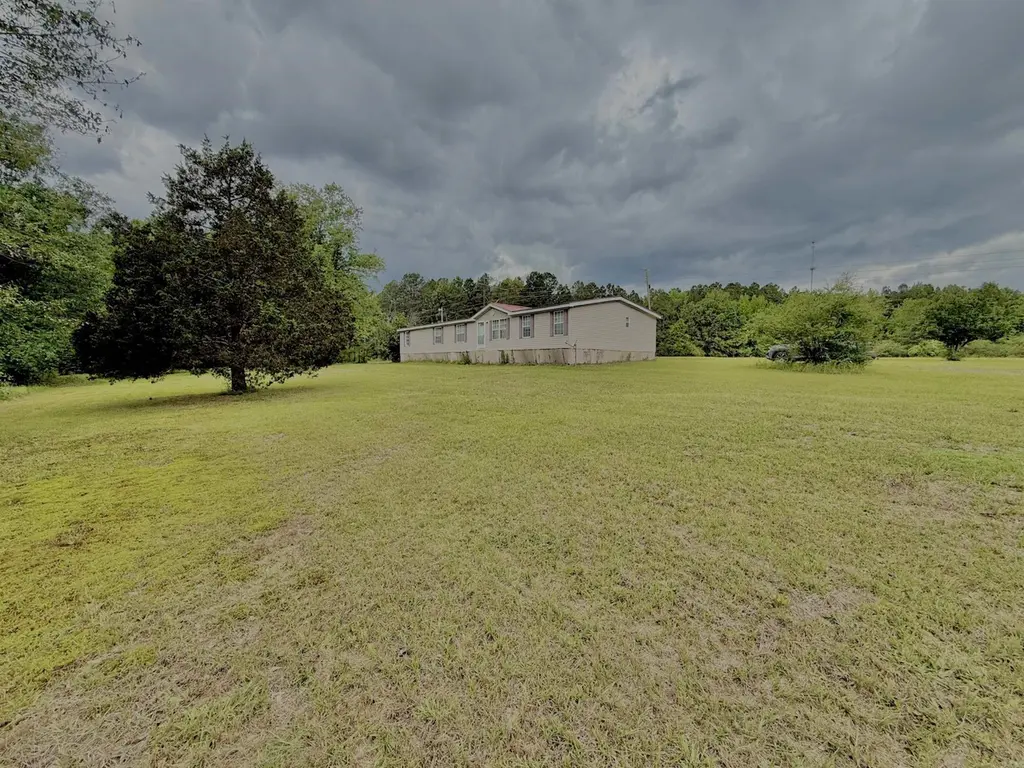
Fixer upper with room to grow! Sitting on 9.5 acres, this 2010 double wide offers space, potential, and the opportunity to create your dream homestead without breaking the budget. Featuring 5 bedrooms and 3 baths, this home has a spacious layout with an open dining and kitchen area, large living room, and generously sized bedrooms throughout. The primary suite includes a long walk-in closet and walk-in shower. Whether you’re looking to start a small farm, need room for animals, or simply want peaceful country living with space inside and out, this property is packed with possibilities!
Key facts
- 9.5 acres
- Double wide
- Walk-in closet
Tags
Property features AI
Finance
- Financial info: Financing available: conventional loan, cash, or in-house financing
Exterior
- Utilities: Septic system; Public water; Electric via cooperative
- Home design: Double-wide mobile home
- Construction: Metal/vinyl siding; Metal roof; Pier foundation; Built on plans & specs (acreage source)
- Exterior features: Rural property with cleared areas; Not in a subdivision; Livestock allowed; Paved road access
Interior
- Kitchen: Free-standing stove; Dishwasher; Refrigerator included
- Flooring: Carpet; Vinyl
- Bathrooms: 3 full bathrooms
- Heating & cooling: Central heating; Central cooling
- Interior features: Washer connection; Dryer connection (electric); Window treatments; Ceiling fans; Walk-in shower; Wood-burning prefabricated fireplace
- Laundry & utility: Laundry room; Washer connection; Dryer connection (electric)
Neighborhood map
What this means for you Summary
Snapshot
- This is a 5-bed/3.0-bath manufactured listed at $120k.
Deal economics
- At list price, monthly cash flow is $173 ($2k/yr) — positive.
- The deal already cash-flows at list — no discount required.
- Meets the 1% rule at list price ($1k rent vs $120k).
Location & tenants
- Location reads 62/100 on livability (#219 in AR) — a middle-class / working-renter tenant base. Strengths: cost of living A+, housing A+, health & safety A+; Watch: schools D-, crime F, amenities F.
- Bearden School District (rural): math 20% / reading 22% proficiency, ranked #209 of 238 in AR (top 88%) — low school quality limits family demand, transient renter base, plan for 1-2y turnover; 62% free/reduced lunch — lower-income household profile, screen leases tightly.
- Market conditions: 3 active listings in the ZIP.
Forward outlook
- In year one you build about $13k of equity ($829 loan paydown + $12k appreciation (10.0% local appreciation)).
- Calhoun County population projected at -20% by 2050 — secular population decline; favor cash flow + early exit over multi-decade hold.
- At projected returns (10.0% appreciation + 3.0% rent growth), your $34k cash investment doubles in ~3 years — after that, you're playing with house money.
- By year 3, paydown + projected appreciation supports a ~$32k cash-out refi (75% LTV) — recoverable capital for the next deal without selling this one.
Negotiation context
- Only 14 days on market — expect competitive offers; lowballing is unlikely to land.
- 2 sale attempts with the ask held roughly flat each time — persistent listings suggest the price (not the market) is what's stuck; bring a comps-based counter.
Questions for the listing agent
- Is there a deadline driving the sale (1031 exchange, divorce, estate, relocation)? That informs how much negotiation room exists.
- Schools are D-rated, which usually means shorter tenancies and higher turnover. Who's the typical renter profile here, and what's been the actual vacancy rate?
- Crime grade is F in this area — have there been break-ins, vandalism, or insurance claims at this property in the last 3 years? What carrier currently insures it and at what premium?
- What's the average days-on-market for RENTAL listings here right now (not sales)? A rising rental-DOM trend means longer vacancies and softer asking-rent achievability than the comps imply.
- What's the recent tenant-quality profile in this submarket — average credit score on applications, eviction rate, late-payment / NSF rate, and stable-employment percentage? A property-management company in the area should have these aggregated.
- How much new for-sale + rental construction is in the pipeline within 1–3 miles? Heavy new supply typically softens prices + rents 12–24 months out; constrained supply supports both.
Investment metrics
- 1% rule
- 1.06% ✓
- Cap rate
- 8.02%
- Cash-on-cash
- 6.17%
- DSCR
- 1.27
- GRM
- 7.9
CMA / ARV
- ARV (median comp)
- $117,000
- List price
- $119,900
- Delta
- 2.48%
- Verdict
- FAIR
- Comps
- 1 within 2.0 mi
Show comp detail 1 sale within ~0.75 mi
| Address | Dist | Beds/Ba | Sqft | Sold | Price | $/sf | Match |
|---|---|---|---|---|---|---|---|
| 1058 NE 1st St | 0.25mi | 5/3.0 | 2,128 (0%) | 0mo | $117,000 | $55 | 88 |
Match score weights: distance 35% · size 25% · config 20% · recency 20%. Top-matched comps best support the ARV.
Projected returns pro-forma
10.0% appreciation · 3.0% rent growth · sell at horizon
- IRR
- 28.8%
- Equity multiple
- 3.27×
- Total profit
- $76,317
- Equity at exit
- $108,015
- IRR
- 25.0%
- Equity multiple
- 7.44×
- Total profit
- $216,131
- Equity at exit
- $232,939
Cash invested: $33,572 (down + closing). Projections, not guarantees.
Landlord ↔ Tenant lean methodology
- Overall (STATE)
- 92 Strongly Landlord-Friendly
- State Arkansas
- 92 Strongly Landlord-Friendly · R+14
- County
- — inherits STATE
- City
- — inherits STATE
ZIP-level market 71720
- Home prices YoY
- 9.2%
- Active inventory
- 3
- Price-to-rent
- 7.9×
Monthly cashflow live
- Estimated rent
- $1,267 medium interval (Pro) →
- Mortgage (P&I)
- −$629
- Tax est. 1.5%
- −$150 /mo · $1,798/yr
- Insurance
- −$50
- HOA
- −$0
- Vacancy / Maint / Mgmt
- −$266
- Net cashflow
- $173
Break-even live
UW: 25.0% down · 7.5% · 30yr · 1.5% tax · 5.0% vac · 8.0% maint · 8.0% mgmt
Financing live
Cash to close
- Down payment
- $29,975
- Closing costs
- $3,597
- Reserves months
- —
- Total cash needed
- —
Loan-product check · same deal, 3 products live
Conventional
25% down · 7.5% · 30yr
- Down + closing
- —
- Monthly P&I
- —
- Monthly cashflow
- —
- DSCR
- —
- Eligible?
- —
Personal DTI + credit; lowest rate.
DSCR
20% down · 8.5% · 30yr
- Down + closing
- —
- Monthly P&I
- —
- Monthly cashflow
- —
- DSCR
- —
- Eligible?
- —
No personal income docs; deal must DSCR.
Hard money
10% down · 12.0% · 12mo
- Down + closing
- —
- Monthly P&I
- —
- Monthly cashflow
- —
- DSCR
- —
- Eligible?
- —
Short-term bridge; refi at stabilization.
Listing history 1 events
-
2026-05-10$119,900 New Listing 598-char remark
ⓘ Source: listings_history table (triggers on properties + properties_extension) + one-shot
backfill from property_details.listing_events for pre-trigger history.
Nearby sold comps map
Loading sold comps map…
Walkable amenities ~0.75 mi
Loading nearby amenities…
Taxation est. · year 1
- Rental income
- $15,209
- − Mortgage interest
- −$6,716
- − Property taxes
- −$1,798
- − Insurance
- −$600
- − Repairs & maintenance
- −$1,217
- − Management
- −$1,217
- − Depreciation
- −$3,488
- Taxable income
- $173
- Est. tax owed @ 24.0%
- −$42
- After-tax cash flow
- $2,030/yr
For passive investors: Depreciation is non-cash, so a rental often shows a tax loss while cash-flowing — sheltering income. Rental losses are passive: they offset passive income freely, and up to $25,000/yr can offset ordinary (W-2) income if you actively participate and your MAGI is under $100k (phasing out to $0 by $150k); unused losses carry forward. On sale, claimed depreciation is recaptured at up to 25%, and gains may owe capital-gains tax (a 1031 exchange can defer both). Figures are a year-1 estimate at your 24.0% rate — not tax advice; consult a CPA.
Schools (NCES district)
- District
- Bearden School District
- NCES district ID
- 0500032
- Math proficiency
- 20% ▼ -19.00%
- Reading proficiency
- 22% ▼ -9.00%
- Median HH income
- $34,779
- Composite
- 17.28/100
- National rank
- #9087
- State rank
- #209 of 238 in AR
Livability — Bearden
- Score
- 62/100
- State rank
- #219
- US rank
- #16756
Category grades
Schools grade is shown separately in the Schools card above.
Census & demographics
- Population (ZIP)
- 2,306
Population outlook (Calhoun County) Hauer SSP2
- Today (2025)
- 4,921 people
- By 2030
- 4,726 · -4.0%
- By 2040
- 4,314 · -12.3%
- By 2050
- 3,912 · -20.5%
- By 2075
- 3,300 · -32.9%
- By 2100
- 2,891 · -41.3%
Race, ethnicity, and origin ACS 2023
- Neighborhood character
- Majority White (60%)
- Race & ethnicity
- White 60% Black 37% Hispanic / Latino 2% Two or more races 1%
- Common ancestry
- Lithuanian 3% Serbian 1% Slovak 1%
- Foreign-born
- 1% · Canada
- Languages at home
- 99% English-only · Spanish 1%
Political lean MEDSL · Calhoun
- 2024 margin
- Solid R (+61.9) · D 18.1% · R 80.0% · Other 1.9%
- 2008→2024 swing
- -27.1pp toward R · 2008: -34.8pp · 2024: -61.9pp
- All cycles
- 2024: R+61.9 2020: R+53.0 2016: R+40.8 2012: R+36.7 2008: R+34.8
Not yet ingested
- Civics
- —
Market trends
- HPI YoY
- ▲ 15.73%
- Current HPI
- 186.2166
- Rent YoY
- —
- Metro
- —
- State GDP YoY
- ▲ 3.80%
- F500 in state
- 10
Industry mix (Fortune 500 HQ in AR)
| Industry | F500 HQs | Revenue |
|---|---|---|
| Retail | 1 | $681B |
|
||
| Food / Agriculture | 1 | $53B |
|
||
| Retail / Energy | 1 | $22B |
|
||
| Transportation / Logistics | 1 | $12B |
|
||
| Energy | 1 | $4B |
|
||
Price history
-2.4% since first listed5 events — show timeline
- 2026-06-15 Sold (MLS) $117,000 CARMLS
- 2026-05-25 Pending — CARMLS
- 2026-05-23 Relisted — CARMLS
- 2026-05-23 Pending — CARMLS
- 2026-05-10 Listed $119,900 CARMLS
Property tax history
+4.7%/yrLatest (2025): $10 · +0.0% YoY. Source: county tax records.
Cash-flow waterfall
monthlySold comps — $/sqft
last 12 mo · ≤1 miLoading sold comps…