2083 Derby Way · Memphis, IN
Flood risk 1/10 · Minimal
- FEMA flood zone
- X (unshaded)
- Chance of flooding over 30 yrs
- 0.0%
- Est. flood insurance / yr
- $507 – $1,088
Fire risk 1/10 · Minimal
- Est. fire insurance / yr
- $717 – $1,331
Heat risk 4/10 · Minor
- Hot days now (above 105°F)
- 7 days/yr
- Hot days in 30 yrs
- 19 days/yr
Wind risk 2/10 · Minimal
- Chance of severe wind over 30 yrs
- 2.0%
Air-quality risk 2/10 · Minimal
- Unhealthy air days now
- 1 days/yr
- Unhealthy air days in 30 yrs
- 1 days/yr
Risk factors via First Street. Map © Google.
Why this score? — see what drove the D grade
The composite is a weighted blend of 9 inputs, each scored 0–100. Each bar is that input's sub-score; the figure is the points it added to the 100-point composite (weight × sub-score).
- Cash flow +12.4/30.0
- ARV discount +9.6/15.0
- Schools +5.0/10.0
- 1% rule +3.7/10.0
- DSCR +3.7/10.0
- Livability +3.5/5.0
- Rent growth +2.5/5.0
- Condition / age +2.2/5.0
- Appreciation +0.0/10.0
$268,990
🖨 Deal sheet (PDF) 📄 Offer letter ✓ Due diligence
Listing remarks
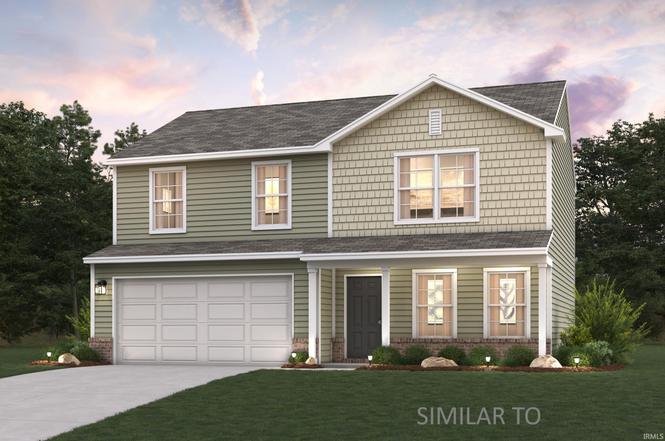
Discover Your Dream Home in the Champions Run Community! The Dupont Plan is a new 2-story home with an open layout that seamlessly connects the Living, Dining, and Kitchen areas, perfect for modern living. The chef’s kitchen features cabinetry, granite countertops and stainless steel appliances, including a smooth-top range, microwave hood, and dishwasher. This thoughtful layout offers a spacious bedroom and full bathroom on the first floor. The second floor houses the serene primary suite with a ensuite bath, dual vanity sinks, and an expansive walk-in closet. Two additional bedrooms share a stylish full bathroom with a Loft Space ideal for a home office or relaxation area. A walk-i
Key facts
- Spacious bedroom
- Ensuite bath
- Open layout
Tags
Property features AI
Finance
- Other: Tax information available
- HOA & community: Homeowners association with an annual fee of $350 (about $29.17/month)
Exterior
- Parking: Attached garage with 2 spaces; Garage with opener
- Security: Smoke detectors; Carbon monoxide detectors
- Utilities: Public water; Public sewer
- Home design: Single-family residential site-built home; 2 stories; Built by Century Complete
- Construction: Vinyl siding; Slab foundation
- Exterior features: Shingle roof; Lot dimensions approximately 69 x 128; Lot roughly 0.21 acres; Lot features: Other
Interior
- Kitchen: Dishwasher; Microwave
- Bedrooms: 4 total rooms (bedroom count not specified)
- Flooring: Vinyl
- Bathrooms: 3 full bathrooms; 1 main-level bathroom
- Heating & cooling: Central air conditioning; Forced air heating
- Interior features: Dishwasher; Microwave; Vinyl flooring; Upper-level laundry
- Laundry & utility: Laundry located on upper level
Neighborhood map
What this means for you Summary
Snapshot
- This is a 4-bed/3.0-bath single-family listed at $269k. Condition is rated fair.
Deal economics
- At list price, monthly cash flow is $-46 ($-553/yr) — negative.
- To cash-flow at today's rent, offer at most $262k (2.5% below list).
- To meet the 1% rule (rent ≥ 1% of price), the offer needs to be $233k (13.3% below list).
- Recommended offer: $233k (13.3% below list) — sets the bar for 1% rule.
- Cap rate 6.1% vs local median 5.0% in Memphis — meaningfully above typical; check what's discounted (condition, days-on-market, listing class) to confirm the premium yield is real.
Location & tenants
- Location reads 70/100 on livability (#164 in IN) — a middle-class / working-renter tenant base. Strengths: employment A+, cost of living A+, housing A+; Watch: amenities F, commute F, health & safety F.
- Zoned schools: Henryville Elementary School (math 30% / reading 33%, grade F, #678 of 994 statewide, top 68%, 647 students, 43% FRL); Henryville Jr & Sr High School (math 29% / reading 45%, grade F, #247 of 369 statewide, top 70%, 461 students, 32% FRL).
- Market conditions: 94 active listings in the ZIP; 911 units permitted in Clark County in 2024 (133 in 5+ unit buildings).
Forward outlook
- Local home prices are declining (-3.0%/yr); year-one equity from $2k of loan paydown is wiped out by about $8k of value loss. Plan a longer hold.
- Clark County population projected at +17% by 2050 — long-run rental-demand tailwind backs the buy-and-hold thesis.
Negotiation context
- It's been on market 56 days — a 3% lower offer ($261k) is reasonable based on typical stale-listing flexibility.
Questions for the listing agent
- What do current leases actually rent for vs. the listed asking? Can we see a recent rent roll and the last 12 months of T-12 income?
- It's been on market 56 days. Have you received any prior offers? Is the seller open to a 13% concession, seller financing, or rate buy-down credit?
- Have any recent inspections been done? Can we get a copy of the seller's disclosures and any deferred-maintenance estimates?
- What does the HOA fee cover, when was the last increase, and are there any pending special assessments or reserve-fund shortfalls?
- Is there a deadline driving the sale (1031 exchange, divorce, estate, relocation)? That informs how much negotiation room exists.
- Schools are F-rated, which usually means shorter tenancies and higher turnover. Who's the typical renter profile here, and what's been the actual vacancy rate?
- The area grade is low — what's the realistic commute time and amenity access for the typical tenant pool here? Any planned neighborhood developments (good or bad) we should know about?
- What's the average days-on-market for RENTAL listings here right now (not sales)? A rising rental-DOM trend means longer vacancies and softer asking-rent achievability than the comps imply.
- What's the recent tenant-quality profile in this submarket — average credit score on applications, eviction rate, late-payment / NSF rate, and stable-employment percentage? A property-management company in the area should have these aggregated.
- How much new for-sale + rental construction is in the pipeline within 1–3 miles? Heavy new supply typically softens prices + rents 12–24 months out; constrained supply supports both.
Investment metrics
- 1% rule
- 0.87% ✗
- Cap rate
- 6.09%
- Cash-on-cash
- -0.73%
- DSCR
- 0.97
- GRM
- 9.6
CMA / ARV
- ARV (on-the-fly)
- $282,066
- Comps found
- 12
Show comp detail 12 sales within ~0.75 mi
| Address | Dist | Beds/Ba | Sqft | Sold | Price | $/sf | Match |
|---|---|---|---|---|---|---|---|
| 1010 Legend Ct | 0.14mi | 4/3.0 | 1,774 (0%) | 7mo | $249,991 | $141 | 88 |
| 2019 Derby Way | 0.17mi | 4/2.0 | 1,771 (-0%) | 5mo | $278,975 | $158 | 84 |
| 2014 Derby Way | 0.12mi | 4/2.5 | 1,953 (+10%) | 3mo | $279,900 | $143 | 73 |
| 2061 Derby Way | 0.17mi | 4/2.5 | 2,014 (+14%) | 1mo | $277,990 | $138 | 66 |
| 1008 Legend Ct | 0.15mi | 4/2.5 | 2,014 (+14%) | 3mo | $259,990 | $129 | 65 |
| 1201 Sir Barton Ct | 0.14mi | 3/2.0 (-1) | 1,621 (-9%) | 6mo | $266,590 | $164 | 65 |
| 2068 Derby Way | 0.12mi | 4/2.5 | 2,014 (+14%) | 6mo | $264,991 | $132 | 65 |
| 13969 Deerfield Xing | 0.55mi | 3/2.0 (-1) | 1,648 (-7%) | 2mo | $309,900 | $188 | 51 |
| 13803 Station Ct | 0.44mi | 3/2.0 (-1) | 1,511 (-15%) | 2mo | $240,000 | $159 | 44 |
| 13838 Deerfield Xing | 0.56mi | 3/2.0 (-1) | 1,601 (-10%) | 6mo | $287,000 | $179 | 44 |
| 13951 Deer Run Trce Lot 406 | 0.62mi | 3/2.0 (-1) | 1,553 (-12%) | 3mo | $338,900 | $218 | 39 |
| 13952 Deer Run Trce Lot 424 | 0.62mi | 3/2.0 (-1) | 1,553 (-12%) | 7mo | $314,900 | $203 | 36 |
Match score weights: distance 35% · size 25% · config 20% · recency 20%. Top-matched comps best support the ARV.
Projected returns pro-forma
-3.0% appreciation · 3.0% rent growth · sell at horizon
- IRR
- -17.5%
- Equity multiple
- 0.38×
- Total profit
- $-46,469
- Equity at exit
- $40,107
- IRR
- -9.5%
- Equity multiple
- 0.42×
- Total profit
- $-44,027
- Equity at exit
- $23,257
Cash invested: $75,317 (down + closing). Projections, not guarantees.
Landlord ↔ Tenant lean methodology
- Overall (STATE)
- 90 Strongly Landlord-Friendly
- State Indiana
- 90 Strongly Landlord-Friendly · R+11
- County
- — inherits STATE
- City
- — inherits STATE
ZIP-level market 47143
- Home prices YoY
- -30.4%
- Active inventory
- 94
- Price-to-rent
- 9.6×
Monthly cashflow live
- Estimated rent
- $2,331 medium interval (Pro) →
- Mortgage (P&I)
- −$1,411
- Tax est. 1.5%
- −$336 /mo · $4,035/yr
- Insurance
- −$112
- HOA
- −$29
- Vacancy / Maint / Mgmt
- −$490
- Net cashflow
- $-46
Break-even live
Sensitivity live
| Price | -10% $140 | -5% $47 | +0% $-46 | +5% $-139 | +10% $-232 |
|---|---|---|---|---|---|
| Rent | -10% $-230 | -5% $-138 | +0% $-46 | +5% $46 | +10% $138 |
| Rate | -1.0pp $89 | -0.5pp $22 | base $-46 | +0.5pp $-116 | +1.0pp $-187 |
UW: 25.0% down · 7.5% · 30yr · 1.5% tax · 5.0% vac · 8.0% maint · 8.0% mgmt
Financing live
Cash to close
- Down payment
- $67,248
- Closing costs
- $8,070
- Reserves months
- —
- Total cash needed
- —
Loan-product check · same deal, 3 products live
Conventional
25% down · 7.5% · 30yr
- Down + closing
- —
- Monthly P&I
- —
- Monthly cashflow
- —
- DSCR
- —
- Eligible?
- —
Personal DTI + credit; lowest rate.
DSCR
20% down · 8.5% · 30yr
- Down + closing
- —
- Monthly P&I
- —
- Monthly cashflow
- —
- DSCR
- —
- Eligible?
- —
No personal income docs; deal must DSCR.
Hard money
10% down · 12.0% · 12mo
- Down + closing
- —
- Monthly P&I
- —
- Monthly cashflow
- —
- DSCR
- —
- Eligible?
- —
Short-term bridge; refi at stabilization.
HOA detail
- Monthly dues
- $29 · $348/yr
Listing history 3 events
-
2026-05-06status Pending
-
2026-04-23price $268,990
-
2026-03-11$273,990 Active
ⓘ Source: listings_history table (triggers on properties + properties_extension) + one-shot
backfill from property_details.listing_events for pre-trigger history.
Climate risk First Street
- Flood 1/10 Low FEMA zone X (unshaded) · 0% chance over 30 yrs
- Wildfire 1/10 Low
- Heat 4/10 Moderate 7 d/yr ≥105°F today · 19 d/yr by 30 yrs out
- Wind 2/10 Low 2% chance of damaging wind over 30 yrs
- Air quality 2/10 Low 1 unhealthy d/yr today · 1 by 30 yrs out
Nearby sold comps map
Loading sold comps map…
Walkable amenities ~0.75 mi
Loading nearby amenities…
Taxation est. · year 1
- Rental income
- $27,978
- − Mortgage interest
- −$15,068
- − Property taxes
- −$4,035
- − Insurance
- −$1,345
- − Repairs & maintenance
- −$2,238
- − Management
- −$2,238
- − HOA
- −$348
- − Depreciation
- −$7,825
- Taxable loss
- −$5,119
- Est. tax savings @ 24.0%
- +$1,229
- After-tax cash flow
- $676/yr
For passive investors: Depreciation is non-cash, so a rental often shows a tax loss while cash-flowing — sheltering income. Rental losses are passive: they offset passive income freely, and up to $25,000/yr can offset ordinary (W-2) income if you actively participate and your MAGI is under $100k (phasing out to $0 by $150k); unused losses carry forward. On sale, claimed depreciation is recaptured at up to 25%, and gains may owe capital-gains tax (a 1031 exchange can defer both). Figures are a year-1 estimate at your 24.0% rate — not tax advice; consult a CPA.
Condition & rehab AI · 4 photos
The home requires significant exterior repairs, particularly to the foundation, and has average interior conditions. Landscaping and drainage improvements would significantly enhance its value.
Repairs flagged
- Major Foundation — Vegetation growth around the foundation suggests potential water intrusion or poor drainage.
Value-add opportunities
- Both Landscaping and drainage improvements — Improving the landscaping and addressing drainage issues will enhance the curb appeal and potentially reduce water damage risks.
- Resale Interior paint and flooring — Updating the interior paint and flooring will make the home more appealing to potential buyers.
Renovation cost estimate screening
| Repair item | Severity | Est. cost |
|---|---|---|
| Foundation · Vegetation growth around the foundation suggests potential water intrusion or poor drainage. | Major | $15,000–50,000 |
| Total estimated repair cost · 1 items | $15,000–50,000 |
Value-add ROI direction
- Both Landscaping and drainage improvements — Improving the landscaping and addressing drainage issues will enhance the curb appeal and potentially reduce water damage risks. ↑
- Resale Interior paint and flooring — Updating the interior paint and flooring will make the home more appealing to potential buyers. ↑
ⓘ Cost ranges are severity-bucket heuristics (US national rule-of-thumb). Get contractor quotes + a written scope before underwriting a rehab budget.
Schools (NCES district)
No district data.
Livability — Memphis
- Score
- 70/100
- State rank
- #164
- US rank
- #7848
Category grades
Schools grade is shown separately in the Schools card above.
Census & demographics
- Census place
- Memphis, IN
- Population (ZIP)
- 3,775
Population outlook (Clark County) Hauer SSP2
- Today (2025)
- 126,401 people
- By 2030
- 131,455 · +4.0%
- By 2040
- 140,471 · +11.1%
- By 2050
- 147,677 · +16.8%
- By 2075
- 161,702 · +27.9%
- By 2100
- 164,078 · +29.8%
Race, ethnicity, and origin ACS 2023
- Neighborhood character
- Predominantly White (93%)
- Race & ethnicity
- White 93% Two or more races 6% Hispanic / Latino 2% Black 1%
- Common ancestry
- Italian 5% American 3% Iranian 2%
- Foreign-born
- 1% · Canada
- Languages at home
- 98% English-only · Spanish 2%
Political lean MEDSL · Clark
- 2024 margin
- Strong R (+20.4) · D 38.9% · R 59.3% · Other 1.8%
- 2008→2024 swing
- -13.3pp toward R · 2008: -7.1pp · 2024: -20.4pp
- All cycles
- 2024: R+20.4 2020: R+18.3 2016: R+22.0 2012: R+9.9 2008: R+7.1
Not yet ingested
- Civics
- —
Market trends
- HPI YoY
- ▼ -80.60%
- Current HPI
- 184.1286
- Rent YoY
- —
- Metro
- —
- State GDP YoY
- ▲ 2.90%
- F500 in state
- 18
Industry mix (Fortune 500 HQ in IN)
| Industry | F500 HQs | Revenue |
|---|---|---|
| Industrial Machinery | 2 | $37B |
|
||
| Healthcare | 1 | $177B |
|
||
| Pharmaceuticals | 1 | $45B |
|
||
| Metals / Steel | 1 | $18B |
|
||
| Agriculture | 1 | $17B |
|
||
| Packaging | 1 | $12B |
|
||
Price history
-1.8% since first listed3 events — show timeline
- 2026-05-06 Pending — IRMLS
- 2026-04-23 Price Changed $268,990 IRMLS
- 2026-03-11 Listed $273,990 IRMLS
Cash-flow waterfall
monthlySold comps — $/sqft
last 12 mo · ≤1 miLoading sold comps…