106 Lowry St · Meadowood, PA
Flood risk 1/10 · Minimal
- FEMA flood zone
- X (unshaded)
- Chance of flooding over 30 yrs
- 0.0%
- Est. flood insurance / yr
- $473 – $860
Fire risk 1/10 · Minimal
- Est. fire insurance / yr
- $511 – $949
Heat risk 3/10 · Minor
- Hot days now (above 94°F)
- 7 days/yr
- Hot days in 30 yrs
- 17 days/yr
Wind risk 1/10 · Minimal
- Chance of severe wind over 30 yrs
- 0.0%
Air-quality risk 3/10 · Minor
- Unhealthy air days now
- 3 days/yr
- Unhealthy air days in 30 yrs
- 5 days/yr
Risk factors via First Street. Map © Google.
Why this score? — see what drove the B+ grade
The composite is a weighted blend of 9 inputs, each scored 0–100. Each bar is that input's sub-score; the figure is the points it added to the 100-point composite (weight × sub-score).
- Cash flow +30.0/30.0
- 1% rule +10.0/10.0
- DSCR +10.0/10.0
- ARV discount +6.3/15.0
- Appreciation +6.1/10.0
- Schools +4.3/10.0
- Livability +3.5/5.0
- Rent growth +2.5/5.0
- Condition / age +2.5/5.0
$54,800
🖨 Deal sheet 📄 Offer letter ✓ Due diligence
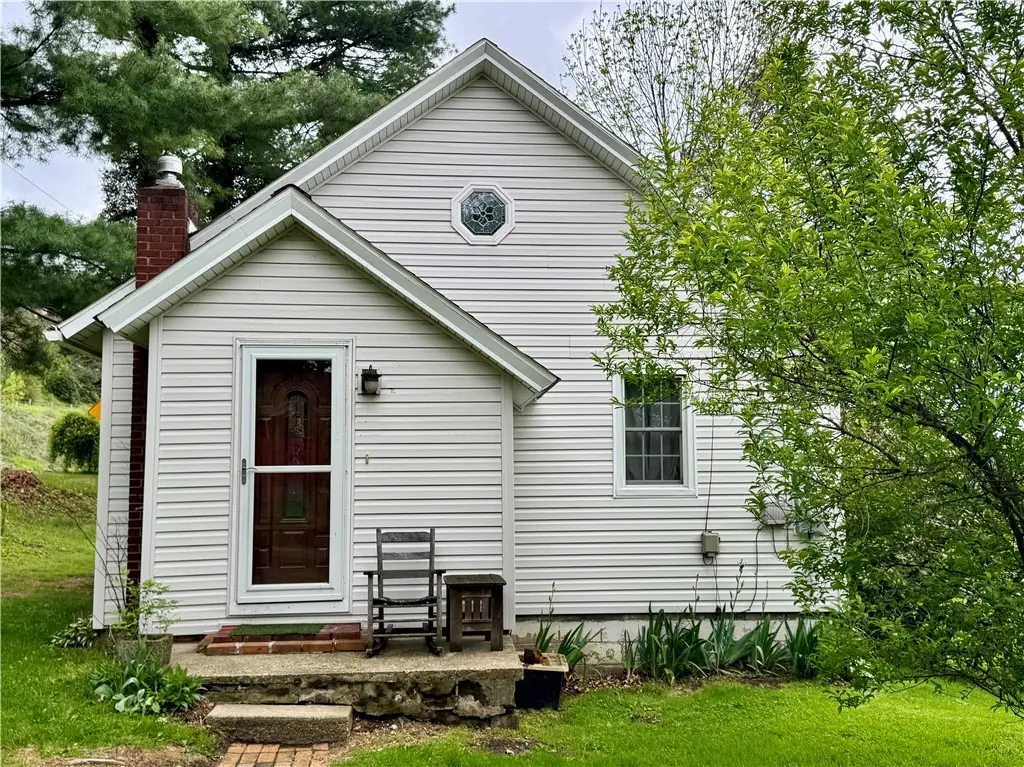
Listing remarks
This adorable 1-bedroom, 1-bath property offers a great opportunity for investors or buyers looking to build equity. Featuring a full basement, off-street parking, and a storage shed, the exterior updates have already been taken care of with a newer roof and siding along with updated wiring. Zoned C2, this property offers added flexibility for future use. The interior does need work, but with some vision and effort, there’s strong potential to improve and add value. A solid opportunity for your next project!
Key facts
- Updated wiring
- Newer roof
- Full basement
Tags
Property features AI
Exterior
- Parking: Off-street parking for 2 cars
- Utilities: Public water; Public sewer
- Home design: Single-story home; Resale property
- Construction: Vinyl siding construction; Asphalt roof
- Exterior features: 54 x 80 lot dimensions
Interior
- Kitchen: Refrigerator; Stove
- Flooring: Hardwood
- Bathrooms: 1 full bathroom
- Heating & cooling: Forced air heating (gas)
- Interior features: Hardwood flooring; Full basement with walk-out access
- Laundry & utility: Some gas appliances
Neighborhood map
What this means for you Summary
Snapshot
- This is a 2-bed/1.0-bath single-family listed at $55k.
Deal economics
- At list price, monthly cash flow is $365 ($4k/yr) — positive.
- The deal already cash-flows at list — no discount required.
- Meets the 1% rule at list price ($909 rent vs $55k).
Location & tenants
- Location reads 69/100 on livability (#830 in PA) — a middle-class / working-renter tenant base. Strengths: crime A+, cost of living A+, housing A+; Watch: health & safety C-, schools D+, amenities F.
- Butler Area SD (town): math 41% / reading 59% proficiency, ranked #181 of 539 in PA (top 34%) — acceptable for families but not a draw, mixed tenant base, ~2y average lease.
- Market conditions: 11 active listings in the ZIP; 2 comparable units currently listed for rent nearby; 987 units permitted in Butler County in 2024 (0 in 5+ unit buildings).
Forward outlook
- In year one you build about $2k of equity ($379 loan paydown + $1k appreciation (2.1% local appreciation)).
- Butler County population projected to shrink 5% by 2050 — rents likely to lag national; underwrite the cash flow, not the appreciation.
- At projected returns (2.1% appreciation + 3.0% rent growth), your $15k cash investment doubles in ~3 years — after that, you're playing with house money.
Negotiation context
- Only 9 days on market — expect competitive offers; lowballing is unlikely to land.
Risks & watch-outs
- Watch-outs: built in 1930 — expect roof / HVAC / electrical / plumbing capex.
Questions for the listing agent
- Built in 1930 — when were the roof, HVAC, electrical panel, plumbing, and water heater last replaced?
- Is there a deadline driving the sale (1031 exchange, divorce, estate, relocation)? That informs how much negotiation room exists.
- Schools are D-rated, which usually means shorter tenancies and higher turnover. Who's the typical renter profile here, and what's been the actual vacancy rate?
- What's the average days-on-market for RENTAL listings here right now (not sales)? A rising rental-DOM trend means longer vacancies and softer asking-rent achievability than the comps imply.
- What's the recent tenant-quality profile in this submarket — average credit score on applications, eviction rate, late-payment / NSF rate, and stable-employment percentage? A property-management company in the area should have these aggregated.
- How much new for-sale + rental construction is in the pipeline within 1–3 miles? Heavy new supply typically softens prices + rents 12–24 months out; constrained supply supports both.
Investment metrics
- 1% rule
- 1.66% ✓
- Cap rate
- 14.28%
- Cash-on-cash
- 28.52%
- DSCR
- 2.27
- GRM
- 5.0
CMA / ARV
- ARV (median comp)
- $53,353
- List price
- $54,800
- Delta
- 2.71%
- Verdict
- FAIR
- Comps
- 5 within 1.0 mi
Show comp detail 2 sales within ~0.75 mi
| Address | Dist | Beds/Ba | Sqft | Sold | Price | $/sf | Match |
|---|---|---|---|---|---|---|---|
| 106 Lowry St | 0.00mi | 1/1.0 (-1) | 629 (0%) | 0mo | $48,500 | $77 | 95 |
| 103 Whitestown Rd | 0.31mi | 2/2.0 | 722 (+15%) | 8mo | $82,250 | $114 | 50 |
Match score weights: distance 35% · size 25% · config 20% · recency 20%. Top-matched comps best support the ARV.
Projected returns pro-forma
2.12% appreciation · 3.0% rent growth · sell at horizon
- IRR
- 32.9%
- Equity multiple
- 2.78×
- Total profit
- $27,327
- Equity at exit
- $21,986
- IRR
- 34.0%
- Equity multiple
- 5.43×
- Total profit
- $67,960
- Equity at exit
- $31,948
Cash invested: $15,344 (down + closing). Projections, not guarantees.
Landlord ↔ Tenant lean methodology
- Overall (STATE)
- 62 Landlord-Friendly
- State Pennsylvania
- 62 Landlord-Friendly · EVEN
- County
- — inherits STATE
- City
- — inherits STATE
ZIP-level market 16045
- Home prices YoY
- 2.0%
- Active inventory
- 11
- Price-to-rent
- 5.0×
Monthly cashflow live
- Estimated rent
- $909 medium interval (Pro) →
- Mortgage (P&I)
- −$287
- Tax from tax record
- −$43 /mo · $517/yr
- Insurance
- −$23
- HOA
- −$0
- Vacancy / Maint / Mgmt
- −$191
- Net cashflow
- $365
Break-even live
UW: 25.0% down · 7.5% · 30yr · 1.5% tax · 5.0% vac · 8.0% maint · 8.0% mgmt
Financing live
Cash to close
- Down payment
- $13,700
- Closing costs
- $1,644
- Reserves months
- —
- Total cash needed
- —
Loan-product check · same deal, 3 products live
Conventional
25% down · 7.5% · 30yr
- Down + closing
- —
- Monthly P&I
- —
- Monthly cashflow
- —
- DSCR
- —
- Eligible?
- —
Personal DTI + credit; lowest rate.
DSCR
20% down · 8.5% · 30yr
- Down + closing
- —
- Monthly P&I
- —
- Monthly cashflow
- —
- DSCR
- —
- Eligible?
- —
No personal income docs; deal must DSCR.
Hard money
10% down · 12.0% · 12mo
- Down + closing
- —
- Monthly P&I
- —
- Monthly cashflow
- —
- DSCR
- —
- Eligible?
- —
Short-term bridge; refi at stabilization.
Rent comps 2 comps
| Address | Beds | Baths | Sqft | Rent | $/sqft | DOM | Units | Dist |
|---|---|---|---|---|---|---|---|---|
| 17 Bessemer Ave Apt 10 Lyndora, PA | 1.0 | 1.0 | 525 | $750 | $1.43 | 4d | 1 | 0.24mi |
| 206 Litman Rd Butler, PA | 1.0–2.0 | 1.0 | 800 | $1,170 | $1.46 | 1d | 3 | 0.37mi |
Listing history 2 events
-
2026-05-11status Pending 519-char remark
-
2026-04-30$54,800 Active 519-char remark
ⓘ Source: listings_history table (triggers on properties + properties_extension) + one-shot
backfill from property_details.listing_events for pre-trigger history.
Tax reassessment forecast PA · Partial reset (capped growth)
- Current annual tax
- $517 · $43/mo
- Projected year-2 tax
- $691 · $58/mo
- Expected delta
- +$174/yr (+$15/mo · 33.8%)
ⓘ Screening estimate from a state-policy table — verify with the county assessor before closing.
Climate risk First Street
- Flood 1/10 Low FEMA zone X (unshaded) · 0% chance over 30 yrs
- Wildfire 1/10 Low
- Heat 3/10 Moderate 7 d/yr ≥94°F today · 17 d/yr by 30 yrs out
- Wind 1/10 Low 0% chance of damaging wind over 30 yrs
- Air quality 3/10 Moderate 3 unhealthy d/yr today · 5 by 30 yrs out
Nearby sold comps map
Loading sold comps map…
Walkable amenities ~0.75 mi
Loading nearby amenities…
Taxation est. · year 1
- Rental income
- $10,905
- − Mortgage interest
- −$3,070
- − Property taxes
- −$517
- − Insurance
- −$274
- − Repairs & maintenance
- −$872
- − Management
- −$872
- − Depreciation
- −$1,594
- Taxable income
- $3,705
- Est. tax owed @ 24.0%
- −$889
- After-tax cash flow
- $3,486/yr
For passive investors: Depreciation is non-cash, so a rental often shows a tax loss while cash-flowing — sheltering income. Rental losses are passive: they offset passive income freely, and up to $25,000/yr can offset ordinary (W-2) income if you actively participate and your MAGI is under $100k (phasing out to $0 by $150k); unused losses carry forward. On sale, claimed depreciation is recaptured at up to 25%, and gains may owe capital-gains tax (a 1031 exchange can defer both). Figures are a year-1 estimate at your 24.0% rate — not tax advice; consult a CPA.
Schools (NCES district)
- District
- Butler Area SD
- NCES district ID
- 4204590
- Math proficiency
- 41% ▼ -11.00%
- Reading proficiency
- 59% ▼ -10.00%
- Median HH income
- $49,348
- Composite
- 42.65/100
- National rank
- #3180
- State rank
- #181 of 539 in PA
Livability — Meadowood
- Score
- 69/100
- State rank
- #830
- US rank
- #8622
Category grades
Schools grade is shown separately in the Schools card above.
Census & demographics
- Census place
- Meadowood, PA
- Population (ZIP)
- 1,109
Population outlook (Butler County) Hauer SSP2
- Today (2025)
- 190,777 people
- By 2030
- 191,476 · +0.4%
- By 2040
- 189,474 · -0.7%
- By 2050
- 182,050 · -4.6%
- By 2075
- 159,526 · -16.4%
- By 2100
- 129,028 · -32.4%
Race, ethnicity, and origin ACS 2023
- Neighborhood character
- Predominantly White (95%)
- Race & ethnicity
- White 95% Black 4% Two or more races 1%
- Common ancestry
- Romanian 25% Lithuanian 10% Italian 4%
Political lean MEDSL · Butler
- 2024 margin
- Solid R (+32.2) · D 33.5% · R 65.7%
- 2008→2024 swing
- -4.8pp toward R · 2008: -27.4pp · 2024: -32.2pp
- All cycles
- 2024: R+32.2 2020: R+32.5 2016: R+37.5 2012: R+34.9 2008: R+27.4
Not yet ingested
- Civics
- —
Market trends
- HPI YoY
- ▲ 2.12%
- Current HPI
- 108.3087
- Rent YoY
- —
- Metro
- —
- State GDP YoY
- ▲ 1.68%
- F500 in state
- 34
Industry mix (Fortune 500 HQ in PA)
| Industry | F500 HQs | Revenue |
|---|---|---|
| Healthcare | 2 | $309B |
|
||
| Insurance | 2 | $27B |
|
||
| Telecommunications / Media | 1 | $124B |
|
||
| Industrial Distribution | 1 | $22B |
|
||
| Financial Services | 1 | $20B |
|
||
| Chemicals / Materials | 1 | $18B |
|
||
Price history
-11.5% since first listed3 events — show timeline
- 2026-06-05 Sold (MLS) $48,500 West Penn MLS
- 2026-05-11 Pending — West Penn MLS
- 2026-04-30 Listed $54,800 West Penn MLS
Property tax history
+1.3%/yrLatest (2026): $517 · +0.0% YoY. Source: county tax records.
Cash-flow waterfall
monthlySold comps — $/sqft
last 12 mo · ≤1 miLoading sold comps…