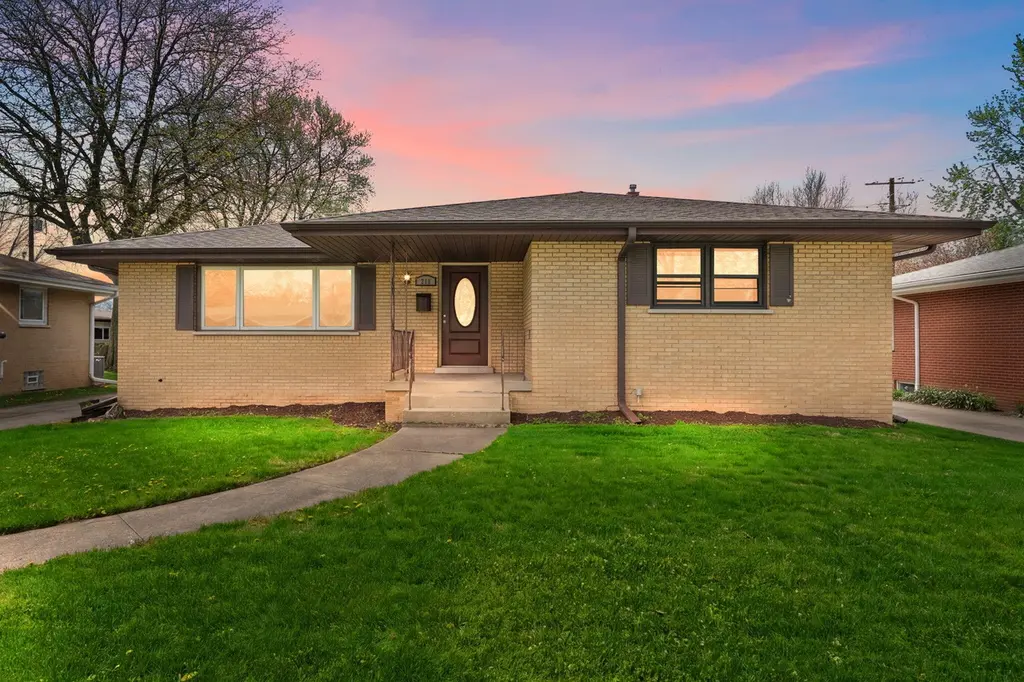
218 Lawndale Dr · Munster, IN
Flood risk 1/10 · Minimal
- FEMA flood zone
- X (unshaded)
- Chance of flooding over 30 yrs
- 0.0%
- Est. flood insurance / yr
- $473 – $860
Fire risk 1/10 · Minimal
- Est. fire insurance / yr
- $717 – $1,331
Heat risk 3/10 · Minor
- Hot days now (above 102°F)
- 7 days/yr
- Hot days in 30 yrs
- 15 days/yr
Wind risk 2/10 · Minimal
- Chance of severe wind over 30 yrs
- 0.0%
Air-quality risk 4/10 · Minor
- Unhealthy air days now
- 5 days/yr
- Unhealthy air days in 30 yrs
- 6 days/yr
Risk factors via First Street. Map © Google.
Why this score? — see what drove the D- grade
The composite is a weighted blend of 9 inputs, each scored 0–100. Each bar is that input's sub-score; the figure is the points it added to the 100-point composite (weight × sub-score).
- Cash flow +13.3/30.0
- Schools +5.7/10.0
- DSCR +4.0/10.0
- Livability +4.0/5.0
- 1% rule +3.3/10.0
- Rent growth +2.5/5.0
- Condition / age +2.5/5.0
- ARV discount +0.0/15.0
- Appreciation +0.0/10.0
$350,000
🖨 Deal sheet 📄 Offer letter ✓ Due diligence
Listing remarks
Welcome to 218 Lawndale Drive--a beautifully updated ranch home located in the desirable Knickerbocker Manor subdivision of Munster. Offering 4 bedrooms, 2 full bathrooms, and over 2,500 square feet of finished living space, this home delivers the ideal combination of functionality, modern updates, and everyday comfort. Step inside to a bright and inviting main level featuring a spacious living area and an updated eat-in kitchen, renovated with modern finishes, stone countertops, and stainless steel appliances--perfect for both daily living and entertaining. The main floor includes three generously sized bedrooms and a full bathroom, offering a practical and efficient layout. The near fully
Key facts
- 8,400 sq ft lot
- 2 garage spots
- Built 1961
Neighborhood map
What this means for you Summary
Snapshot
- This is a 3-bed/1.5-bath single-family listed at $350k.
Deal economics
- At list price, monthly cash flow is $0 ($4/yr) — positive.
- The deal already cash-flows at list — no discount required.
- To meet the 1% rule (rent ≥ 1% of price), the offer needs to be $291k (16.8% below list).
- Recommended offer: $291k (16.8% below list) — sets the bar for 1% rule.
- Cap rate 6.3% vs local median 5.0% in Munster — meaningfully above typical; check what's discounted (condition, days-on-market, listing class) to confirm the premium yield is real.
Location & tenants
- Location reads 81/100 on livability (#17 in IN, #1,427 nationally) — a professional / high-income tenant draw. Strengths: schools A+, crime A+, employment A+; Watch: amenities F, commute F.
- School Town Of Munster (suburban): math 65% / reading 64% proficiency, ranked #6 of 301 in IN (top 2%) — acceptable for families but not a draw, mixed tenant base, ~2y average lease; only 14% free/reduced lunch — higher-income household profile.
- Market conditions: 112 active listings in the ZIP; 7 comparable units currently listed for rent nearby; rentals leasing fast (median 1d on market — plan ~1-2 weeks tenant-placement turnaround); high-income renter base; 1,642 units permitted in Lake County in 2024 (14 in 5+ unit buildings).
- This rent runs 32% of the median local income ($110k/yr) — at the standard rent-burdened threshold; future hikes will face affordability resistance.
Forward outlook
- Local home prices are declining (-3.0%/yr); year-one equity from $2k of loan paydown is wiped out by about $10k of value loss. Plan a longer hold.
- Lake County population projected to shrink 7% by 2050 — rents likely to lag national; underwrite the cash flow, not the appreciation.
Negotiation context
- Only 5 days on market — expect competitive offers; lowballing is unlikely to land.
- 4 sale attempts with the ask held roughly flat each time — persistent listings suggest the price (not the market) is what's stuck; bring a comps-based counter.
Questions for the listing agent
- Built in 1961 — when were the roof, HVAC, electrical panel, plumbing, and water heater last replaced?
- Is there a deadline driving the sale (1031 exchange, divorce, estate, relocation)? That informs how much negotiation room exists.
- Schools are A-rated — typically a magnet for longer-tenancy family renters. What's the average tenant stay here, and is there a school-zone premium baked into asking?
- The area grade is low — what's the realistic commute time and amenity access for the typical tenant pool here? Any planned neighborhood developments (good or bad) we should know about?
- What's the average days-on-market for RENTAL listings here right now (not sales)? A rising rental-DOM trend means longer vacancies and softer asking-rent achievability than the comps imply.
- What's the recent tenant-quality profile in this submarket — average credit score on applications, eviction rate, late-payment / NSF rate, and stable-employment percentage? A property-management company in the area should have these aggregated.
- How much new for-sale + rental construction is in the pipeline within 1–3 miles? Heavy new supply typically softens prices + rents 12–24 months out; constrained supply supports both.
Investment metrics
- 1% rule
- 0.83% ✗
- Cap rate
- 6.29%
- Cash-on-cash
- 0.00%
- DSCR
- 1.00
- GRM
- 10.0
CMA / ARV
- ARV (on-the-fly)
- $258,552
- Comps found
- 12
Show comp detail 12 sales within ~0.75 mi
| Address | Dist | Beds/Ba | Sqft | Sold | Price | $/sf | Match |
|---|---|---|---|---|---|---|---|
| 8130 Meadow Ln | 0.52mi | 3/1.5 | 1,514 (+11%) | 5mo | $187,000 | $124 | 54 |
| 18814 Bernadine St | 0.60mi | 3/1.5 | 1,295 (-5%) | 13mo | $269,000 | $208 | 52 |
| 18434 Wentworth Ave | 0.45mi | 3/2.0 | 1,253 (-8%) | 13mo | $270,000 | $215 | 52 |
| 8767 Jefferson Ave | 0.65mi | 3/2.5 | 1,453 (+6%) | 6mo | $283,000 | $195 | 50 |
| 18280 Sherman St | 0.68mi | 2/1.5 (-1) | 1,346 (-2%) | 15mo | $176,000 | $131 | 48 |
| 8132 Harrison Ave | 0.57mi | 3/1.0 | 1,265 (-8%) | 16mo | $250,000 | $198 | 46 |
| 18727 Sherman St | 0.63mi | 4/1.5 (+1) | 1,264 (-8%) | 9mo | $239,000 | $189 | 46 |
| 18341 West St | 0.57mi | 3/2.0 | 1,500 (+10%) | 15mo | $260,000 | $173 | 43 |
| 3328 N Schultz Dr | 0.74mi | 4/2.0 (+1) | 1,309 (-4%) | 10mo | $199,500 | $152 | 43 |
| 8820 Calumet Ave | 0.71mi | 3/2.0 | 1,232 (-10%) | 8mo | $269,900 | $219 | 42 |
| 3518 S Manor Dr | 0.72mi | 4/2.0 (+1) | 1,548 (+13%) | 2mo | $283,000 | $183 | 36 |
| 3609 Randolph St | 0.69mi | 4/2.0 (+1) | 1,500 (+10%) | 16mo | $228,000 | $152 | 31 |
Match score weights: distance 35% · size 25% · config 20% · recency 20%. Top-matched comps best support the ARV.
Projected returns pro-forma
-3.0% appreciation · 3.0% rent growth · sell at horizon
- IRR
- -16.3%
- Equity multiple
- 0.42×
- Total profit
- $-56,721
- Equity at exit
- $52,186
- IRR
- -8.0%
- Equity multiple
- 0.50×
- Total profit
- $-49,480
- Equity at exit
- $30,262
Cash invested: $98,000 (down + closing). Projections, not guarantees.
Landlord ↔ Tenant lean methodology
- Overall (STATE)
- 90 Strongly Landlord-Friendly
- State Indiana
- 90 Strongly Landlord-Friendly · R+11
- County
- — inherits STATE
- City
- — inherits STATE
ZIP-level market 46321
- Active inventory
- 112
- Price-to-rent
- 10.0×
Monthly cashflow live
- Estimated rent
- $2,912 high interval (Pro) →
- Mortgage (P&I)
- −$1,835
- Tax from tax record
- −$319 /mo · $3,826/yr
- Insurance
- −$146
- HOA
- −$0
- Vacancy / Maint / Mgmt
- −$612
- Net cashflow
- $0
Break-even live
UW: 25.0% down · 7.5% · 30yr · 1.5% tax · 5.0% vac · 8.0% maint · 8.0% mgmt
Financing live
Cash to close
- Down payment
- $87,500
- Closing costs
- $10,500
- Reserves months
- —
- Total cash needed
- —
Loan-product check · same deal, 3 products live
Conventional
25% down · 7.5% · 30yr
- Down + closing
- —
- Monthly P&I
- —
- Monthly cashflow
- —
- DSCR
- —
- Eligible?
- —
Personal DTI + credit; lowest rate.
DSCR
20% down · 8.5% · 30yr
- Down + closing
- —
- Monthly P&I
- —
- Monthly cashflow
- —
- DSCR
- —
- Eligible?
- —
No personal income docs; deal must DSCR.
Hard money
10% down · 12.0% · 12mo
- Down + closing
- —
- Monthly P&I
- —
- Monthly cashflow
- —
- DSCR
- —
- Eligible?
- —
Short-term bridge; refi at stabilization.
Rent comps 7 comps
| Address | Beds | Baths | Sqft | Rent | $/sqft | DOM | Units | Dist |
|---|---|---|---|---|---|---|---|---|
| 18335 Sherman St Unit 3 Lansing, IL | 3.0 | 1.0 | 1000 | $1,700 | $1.70 | 1d | 1 | 0.63mi |
| 3341 S Schultz Dr Lansing, IL | 4.0 | 2.0 | 1452 | $2,250 | $1.55 | 10d | 1 | 0.72mi |
| 232 Gregory Ave Munster, IN | 3.0 | 1.5 | 1600 | $2,450 | $1.53 | 1d | 1 | 1.01mi |
| 7610 Manor Ave Munster, IN | 3.0 | 2.0 | 1700 | $4,750 | $2.79 | 1d | 1 | 1.18mi |
| 7611 Kinsley Pl Munster, IN | 3.0 | 2.0 | 1700 | $4,700 | $2.76 | 1d | 1 | 1.19mi |
| 18343 Oakwood Ave Lansing, IL | 4.0 | 2.0 | 1700 | $2,700 | $1.59 | 1d | 1 | 1.34mi |
| 2824 186th St Lansing, IL | 3.0 | 2.0 | 1400 | $2,900 | $2.07 | 10d | 1 | 1.37mi |
Listing history 13 events
-
2026-04-28status Pending
-
2026-04-23$350,000 Active
-
2025-10-03status Active
-
2025-10-03historical
-
2025-10-03historical
-
2025-09-09price $339,900
-
2025-07-29price $349,900
-
2025-07-15price $360,000
-
2025-06-17price $370,000
-
2025-05-19price $375,000
-
2025-05-06status Active
-
2025-04-21status Pending
-
2025-04-10$385,000 Active
ⓘ Source: listings_history table (triggers on properties + properties_extension) + one-shot
backfill from property_details.listing_events for pre-trigger history.
Tax reassessment forecast IN · Partial reset (capped growth)
- Current annual tax
- $3,826 · $319/mo
- Projected year-2 tax
- $3,826 · $319/mo
- Expected delta
- $0/yr ($0/mo · 0.0%)
ⓘ Screening estimate from a state-policy table — verify with the county assessor before closing.
Climate risk First Street
- Flood 1/10 Low FEMA zone X (unshaded) · 0% chance over 30 yrs
- Wildfire 1/10 Low
- Heat 3/10 Moderate 7 d/yr ≥102°F today · 15 d/yr by 30 yrs out
- Wind 2/10 Low 0% chance of damaging wind over 30 yrs
- Air quality 4/10 Moderate 5 unhealthy d/yr today · 6 by 30 yrs out
Nearby sold comps map
Loading sold comps map…
Walkable amenities ~0.75 mi
Loading nearby amenities…
Taxation est. · year 1
- Rental income
- $34,944
- − Mortgage interest
- −$19,605
- − Property taxes
- −$3,826
- − Insurance
- −$1,750
- − Repairs & maintenance
- −$2,795
- − Management
- −$2,795
- − Depreciation
- −$10,182
- Taxable loss
- −$6,011
- Est. tax savings @ 24.0%
- +$1,443
- After-tax cash flow
- $1,447/yr
For passive investors: Depreciation is non-cash, so a rental often shows a tax loss while cash-flowing — sheltering income. Rental losses are passive: they offset passive income freely, and up to $25,000/yr can offset ordinary (W-2) income if you actively participate and your MAGI is under $100k (phasing out to $0 by $150k); unused losses carry forward. On sale, claimed depreciation is recaptured at up to 25%, and gains may owe capital-gains tax (a 1031 exchange can defer both). Figures are a year-1 estimate at your 24.0% rate — not tax advice; consult a CPA.
Schools (NCES district)
- District
- School Town Of Munster
- NCES district ID
- 1807350
- Math proficiency
- 65% ▼ -1.00%
- Reading proficiency
- 64% ▼ -4.00%
- Median HH income
- $71,901
- Composite
- 56.91/100
- National rank
- #1115
- State rank
- #6 of 301 in IN
Livability — Munster
- Score
- 81/100
- State rank
- #17
- US rank
- #1427
Category grades
Schools grade is shown separately in the Schools card above.
Census & demographics
- Census place
- Munster, IN
- County
- Lake County · 422,878 people
- City population
- 23,733
- Metro
- Chicago-Naperville-Elgin, IL-IN-WI
- Population (ZIP)
- 23,733
- Household income
- $110,187
- Rent vs Own
- Severe rent burden
- 338.0
Population outlook (Lake County) Hauer SSP2
- Today (2025)
- 484,026 people
- By 2030
- 478,091 · -1.2%
- By 2040
- 462,974 · -4.3%
- By 2050
- 449,894 · -7.1%
- By 2075
- 436,169 · -9.9%
- By 2100
- 426,607 · -11.9%
Race, ethnicity, and origin ACS 2023
- Neighborhood character
- Predominantly White (71%)
- Race & ethnicity
- White 71% Hispanic / Latino 14% Two or more races 8% Black 7% Asian 6%
- Hispanic origin (detail)
- Mexican 11% Puerto Rican 2%
- Common ancestry
- Romanian 16% Iranian 4% Lithuanian 1%
- Foreign-born
- 9% · Canada, South Korea, China
- Languages at home
- 86% English-only · Spanish 6% Russian/Polish/Slavic 3% Other Indo-European 2%
Political lean MEDSL · Lake
- 2024 margin
- Lean D (+5.6) · D 52.1% · R 46.5% · Other 1.5%
- 2008→2024 swing
- -28.6pp toward R · 2008: 34.3pp · 2024: 5.6pp
- All cycles
- 2024: D+5.6 2020: D+15.1 2016: D+20.6 2012: D+31.0 2008: D+34.3
Not yet ingested
- Civics
- —
Market trends
- HPI YoY
- ▼ -213.34%
- Current HPI
- 232.4818
- Rent YoY
- —
- Metro
- Chicago-Naperville-Elgin, IL-IN-WI
- State GDP YoY
- ▲ 2.90%
- F500 in state
- 18
Industry mix (Fortune 500 HQ in IN)
| Industry | F500 HQs | Revenue |
|---|---|---|
| Industrial Machinery | 2 | $37B |
|
||
| Healthcare | 1 | $177B |
|
||
| Pharmaceuticals | 1 | $45B |
|
||
| Metals / Steel | 1 | $18B |
|
||
| Agriculture | 1 | $17B |
|
||
| Packaging | 1 | $12B |
|
||
Price history
-9.1% since first listed13 events — show timeline
- 2026-04-28 Pending — NIRA MLS as Distributed by MLS Grid
- 2026-04-23 Listed $350,000 NIRA MLS as Distributed by MLS Grid
- 2025-10-03 Relisted — NIRA MLS as Distributed by MLS Grid
- 2025-10-03 Listing Removed — NIRA MLS as Distributed by MLS Grid
- 2025-10-03 Listing Removed — NIRA MLS as Distributed by MLS Grid
- 2025-09-09 Price Changed $339,900 NIRA MLS as Distributed by MLS Grid
- 2025-07-29 Price Changed $349,900 NIRA MLS as Distributed by MLS Grid
- 2025-07-15 Price Changed $360,000 NIRA MLS as Distributed by MLS Grid
- 2025-06-17 Price Changed $370,000 NIRA MLS as Distributed by MLS Grid
- 2025-05-19 Price Changed $375,000 NIRA MLS as Distributed by MLS Grid
- 2025-05-06 Relisted — NIRA MLS as Distributed by MLS Grid
- 2025-04-21 Pending — NIRA MLS as Distributed by MLS Grid
- 2025-04-10 Listed $385,000 NIRA MLS as Distributed by MLS Grid
Property tax history
+2.9%/yrLatest (2024): $3,826 · +15.6% YoY. Source: county tax records.
Cash-flow waterfall
monthlySold comps — $/sqft
last 12 mo · ≤1 miLoading sold comps…