ST RD 158 Rd · Bedford, IN
Flood risk 10/10 · Severe
- FEMA flood zone
- X (unshaded)
- Chance of flooding over 30 yrs
- 0.99%
- Est. flood insurance / yr
- $507 – $1,088
Fire risk 3/10 · Minor
- Est. fire insurance / yr
- $717 – $1,331
Heat risk 4/10 · Minor
- Hot days now (above 104°F)
- 7 days/yr
- Hot days in 30 yrs
- 19 days/yr
Wind risk 2/10 · Minimal
- Chance of severe wind over 30 yrs
- 1.0%
Air-quality risk 2/10 · Minimal
- Unhealthy air days now
- 1 days/yr
- Unhealthy air days in 30 yrs
- 1 days/yr
Risk factors via First Street. Map © Google.
Why this score? — see what drove the D+ grade
The composite is a weighted blend of 9 inputs, each scored 0–100. Each bar is that input's sub-score; the figure is the points it added to the 100-point composite (weight × sub-score).
- Cash flow +18.0/30.0
- ARV discount +7.5/15.0
- DSCR +5.6/10.0
- 1% rule +4.8/10.0
- Livability +4.0/5.0
- Schools +3.2/10.0
- Rent growth +2.5/5.0
- Condition / age +2.2/5.0
- Appreciation +0.0/10.0
$99,900
🖨 Deal sheet (PDF) 📄 Offer letter ✓ Due diligence
Listing remarks MLS
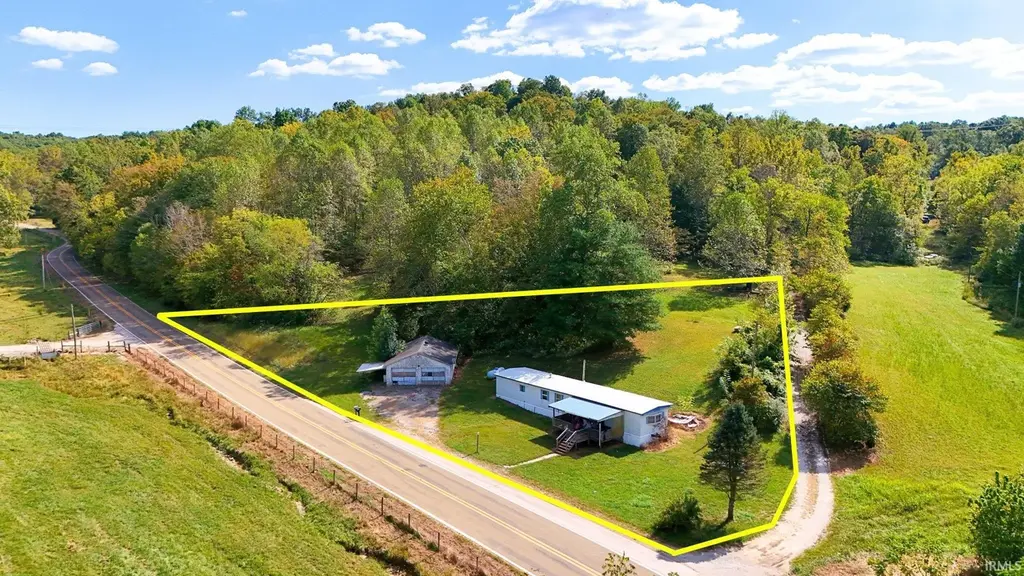
Country charm on a paved road! This cozy 2-bedroom, 1-bath mobile home offers peaceful country living on a 1.25-acre lot. Enjoy the covered lean-to front porch overlooking the open yard, perfect for relaxing evenings. The home includes all appliances and sits on a nice property featuring a large 24’x30’ detached shop—ideal for storage, hobbies, or a small workspace. With plenty of potential and a quiet rural setting, this property is being sold " AS IS " and is ready for its next owner to make it a home.
Key facts
- Large detached shop
- Open yard
- 1.25 acre lot
Tags
Neighborhood map
What this means for you Summary
Snapshot
- This is a 2-bed/1.0-bath manufactured listed at $100k. Condition is rated fair.
Deal economics
- At list price, monthly cash flow is $20 ($236/yr) — positive.
- The deal already cash-flows at list — no discount required.
- To meet the 1% rule (rent ≥ 1% of price), the offer needs to be $98k (1.6% below list).
- Recommended offer: $88k (12.0% below list) — sets the bar for market timing.
- Cap rate 7.3% vs local median 4.2% in Bedford — top-decile yield for the area; either an underpriced asset or a hidden risk that comps aren't pricing in. Stress-test before assuming the spread holds.
Location & tenants
- Location reads 80/100 on livability (#23 in IN, #1,958 nationally) — a professional / high-income tenant draw. Strengths: crime A+, cost of living A+, housing A+; Watch: schools C-, employment D, commute F.
- North Lawrence Community Schools (rural): math 35% / reading 40% proficiency, ranked #170 of 301 in IN (top 56%) — families likely to look elsewhere, expect single-tenant / working-renter base with shorter leases.
- Market conditions: 159 active listings in the ZIP; 8 units permitted in Lawrence County in 2024 (0 in 5+ unit buildings).
- This rent is only 17% of the median local income ($68k/yr) — well below the 30% rent-burden line; pricing power to push rent on renewal without tenant pushback.
Forward outlook
- Local home prices are declining (-3.0%/yr); year-one equity from $691 of loan paydown is wiped out by about $3k of value loss. Plan a longer hold.
- Lawrence County population projected at -14% by 2050 — secular population decline; favor cash flow + early exit over multi-decade hold.
Negotiation context
- It's been on market 265 days — a 12% lower offer ($88k) is reasonable based on typical stale-listing flexibility.
Risks & watch-outs
- Watch-outs: flood insurance adds $66/mo.
- Climate carrying-cost: severe flood risk — expect insurance premiums to compound above CPI over the hold.
Questions for the listing agent
- It's been on market 265 days. Have you received any prior offers? Is the seller open to a 12% concession, seller financing, or rate buy-down credit?
- Have any recent inspections been done? Can we get a copy of the seller's disclosures and any deferred-maintenance estimates?
- What's the actual annual flood-insurance premium (NFIP or private), and is the property in a SFHA with mandatory coverage?
- Why hasn't it sold? Are there any deal-killer items the seller is aware of (foundation, flood, title, zoning, code violations)?
- Is there a deadline driving the sale (1031 exchange, divorce, estate, relocation)? That informs how much negotiation room exists.
- The area grade is low — what's the realistic commute time and amenity access for the typical tenant pool here? Any planned neighborhood developments (good or bad) we should know about?
- What's the average days-on-market for RENTAL listings here right now (not sales)? A rising rental-DOM trend means longer vacancies and softer asking-rent achievability than the comps imply.
- What's the recent tenant-quality profile in this submarket — average credit score on applications, eviction rate, late-payment / NSF rate, and stable-employment percentage? A property-management company in the area should have these aggregated.
- How much new for-sale + rental construction is in the pipeline within 1–3 miles? Heavy new supply typically softens prices + rents 12–24 months out; constrained supply supports both.
Investment metrics
- 1% rule
- 0.98% ✗
- Cap rate
- 7.33%
- Cash-on-cash
- 3.69%
- DSCR
- 1.16
- GRM
- 8.5
CMA / ARV
No comps found within radius.
Projected returns pro-forma
-3.0% appreciation · 3.0% rent growth · sell at horizon
- IRR
- -14.9%
- Equity multiple
- 0.47×
- Total profit
- $-14,881
- Equity at exit
- $14,895
- IRR
- -6.2%
- Equity multiple
- 0.60×
- Total profit
- $-11,121
- Equity at exit
- $8,638
Cash invested: $27,972 (down + closing). Projections, not guarantees.
Landlord ↔ Tenant lean methodology
- Overall (STATE)
- 90 Strongly Landlord-Friendly
- State Indiana
- 90 Strongly Landlord-Friendly · R+11
- County
- — inherits STATE
- City
- — inherits STATE
ZIP-level market 47421
- Home prices YoY
- -25.2%
- Active inventory
- 159
- Price-to-rent
- 8.5×
Monthly cashflow live
- Estimated rent
- $983 medium interval (Pro) →
- Mortgage (P&I)
- −$524
- Tax est. 1.5%
- −$125 /mo · $1,498/yr
- Insurance
- −$42
- Flood insurance flood zone
- −$66 /mo · $798/yr
- HOA
- −$0
- Vacancy / Maint / Mgmt
- −$206
- Net cashflow
- $20
Break-even live
Sensitivity live
| Price | -10% $89 | -5% $54 | +0% $20 | +5% $-15 | +10% $-49 |
|---|---|---|---|---|---|
| Rent | -10% $-58 | -5% $-19 | +0% $20 | +5% $58 | +10% $97 |
| Rate | -1.0pp $70 | -0.5pp $45 | base $20 | +0.5pp $-6 | +1.0pp $-33 |
UW: 25.0% down · 7.5% · 30yr · 1.5% tax · 5.0% vac · 8.0% maint · 8.0% mgmt
Financing live
Cash to close
- Down payment
- $24,975
- Closing costs
- $2,997
- Reserves months
- —
- Total cash needed
- —
Loan-product check · same deal, 3 products live
Conventional
25% down · 7.5% · 30yr
- Down + closing
- —
- Monthly P&I
- —
- Monthly cashflow
- —
- DSCR
- —
- Eligible?
- —
Personal DTI + credit; lowest rate.
DSCR
20% down · 8.5% · 30yr
- Down + closing
- —
- Monthly P&I
- —
- Monthly cashflow
- —
- DSCR
- —
- Eligible?
- —
No personal income docs; deal must DSCR.
Hard money
10% down · 12.0% · 12mo
- Down + closing
- —
- Monthly P&I
- —
- Monthly cashflow
- —
- DSCR
- —
- Eligible?
- —
Short-term bridge; refi at stabilization.
Listing history 19 events
-
2026-06-19days on market $99,900 Active 265 DOM
-
2026-06-18days on market $99,900 Active 264 DOM
-
2026-06-17days on market $99,900 Active 263 DOM
-
2026-06-16days on market $99,900 Active 262 DOM
-
2026-06-15days on market $99,900 Active 261 DOM
-
2026-06-14days on market $99,900 Active 259 DOM
-
2026-06-13days on market $99,900 Active 258 DOM
-
2026-06-10days on market $99,900 Active 256 DOM
-
2026-06-09days on market $99,900 Active 255 DOM
-
2026-06-08days on market $99,900 Active 254 DOM
-
2026-06-07days on market $99,900 Active 253 DOM
-
2026-06-05days on market $99,900 Active 250 DOM
-
2026-06-03days on market $99,900 Active 249 DOM
-
2026-06-02days on market $99,900 Active 248 DOM
-
2026-06-01days on market $99,900 Active 247 DOM
-
2026-05-31days on market $99,900 Active 246 DOM
-
2026-05-30days on market $99,900 Active 245 DOM
-
2025-11-04price $99,900 537-char remark
Show marketing remark (537 chars)
Country charm on a paved road! This cozy 2-bedroom, 1-bath mobile home offers peaceful country living on a 1.25-acre lot. Enjoy the covered lean-to front porch overlooking the open yard, perfect for relaxing evenings. The home includes all appliances and sits on a nice property featuring a large 24’x30’ detached shop—ideal for storage, hobbies, or a small workspace. With plenty of potential and a quiet rural setting, this property is being sold " AS IS " and is ready for its next owner to make it a home.
-
2025-09-27$114,900 Active 537-char remark
Show marketing remark (537 chars)
Country charm on a paved road! This cozy 2-bedroom, 1-bath mobile home offers peaceful country living on a 1.25-acre lot. Enjoy the covered lean-to front porch overlooking the open yard, perfect for relaxing evenings. The home includes all appliances and sits on a nice property featuring a large 24’x30’ detached shop—ideal for storage, hobbies, or a small workspace. With plenty of potential and a quiet rural setting, this property is being sold " AS IS " and is ready for its next owner to make it a home.
ⓘ Source: listings_history table (triggers on properties + properties_extension) + one-shot
backfill from property_details.listing_events for pre-trigger history.
Climate risk First Street
- Flood 10/10 Extreme FEMA zone X (unshaded) · 99% chance over 30 yrs
- Wildfire 3/10 Moderate
- Heat 4/10 Moderate 7 d/yr ≥104°F today · 19 d/yr by 30 yrs out
- Wind 2/10 Low 100% chance of damaging wind over 30 yrs
- Air quality 2/10 Low 1 unhealthy d/yr today · 1 by 30 yrs out
Nearby sold comps map
Loading sold comps map…
Walkable amenities ~0.75 mi
Loading nearby amenities…
Taxation est. · year 1
- Rental income
- $11,795
- − Mortgage interest
- −$5,596
- − Property taxes
- −$1,498
- − Insurance
- −$1,297
- − Repairs & maintenance
- −$944
- − Management
- −$944
- − Depreciation
- −$2,906
- Taxable loss
- −$1,390
- Est. tax savings @ 24.0%
- +$334
- After-tax cash flow
- $569/yr
For passive investors: Depreciation is non-cash, so a rental often shows a tax loss while cash-flowing — sheltering income. Rental losses are passive: they offset passive income freely, and up to $25,000/yr can offset ordinary (W-2) income if you actively participate and your MAGI is under $100k (phasing out to $0 by $150k); unused losses carry forward. On sale, claimed depreciation is recaptured at up to 25%, and gains may owe capital-gains tax (a 1031 exchange can defer both). Figures are a year-1 estimate at your 24.0% rate — not tax advice; consult a CPA.
Condition & rehab AI · 12 photos
This mobile home requires moderate repairs and maintenance, particularly in the exterior and interior paint, to improve its condition and value.
Repairs flagged
- Major Paint — Paint appears faded and chipping on exterior and interior.
- Major Exterior siding — Siding appears weathered and may need replacement.
- Minor Kitchen cabinets — Dated but not damaged, could be updated with new ones.
- Minor Bathroom fixtures — Standard fixtures, but could be updated for a fresh look.
- Minor Landscaping — Basic landscaping, could be improved for better curb appeal.
Value-add opportunities
- Both Paint and exterior siding — Improves curb appeal and home value
- Resale Kitchen cabinets — Freshens up the kitchen and adds value
- Resale Bathroom fixtures — Modernizes the bathroom and adds value
- Rental Landscaping — Improves curb appeal and rental appeal
Renovation cost estimate screening
| Repair item | Severity | Est. cost |
|---|---|---|
| Paint · Paint appears faded and chipping on exterior and interior. | Major | $15,000–50,000 |
| Exterior siding · Siding appears weathered and may need replacement. | Major | $15,000–50,000 |
| Kitchen cabinets · Dated but not damaged, could be updated with new ones. | Minor | $500–3,000 |
| Bathroom fixtures · Standard fixtures, but could be updated for a fresh look. | Minor | $500–3,000 |
| Landscaping · Basic landscaping, could be improved for better curb appeal. | Minor | $500–3,000 |
| Total estimated repair cost · 5 items | $31,500–109,000 |
Value-add ROI direction
- Both Paint and exterior siding — Improves curb appeal and home value ↑
- Resale Kitchen cabinets — Freshens up the kitchen and adds value ↑
- Resale Bathroom fixtures — Modernizes the bathroom and adds value ↑
- Rental Landscaping — Improves curb appeal and rental appeal ↑
ⓘ Cost ranges are severity-bucket heuristics (US national rule-of-thumb). Get contractor quotes + a written scope before underwriting a rehab budget.
Schools (NCES district)
- District
- North Lawrence Community Schools
- NCES district ID
- 1807860
- Math proficiency
- 35% ▼ -2.00%
- Reading proficiency
- 40% ▼ -3.00%
- Median HH income
- $44,566
- Composite
- 31.88/100
- National rank
- #5864
- State rank
- #170 of 301 in IN
Livability — Bedford
- Score
- 80/100
- State rank
- #23
- US rank
- #1958
Category grades
Schools grade is shown separately in the Schools card above.
Census & demographics
- County
- Lawrence County · 27,599 people
- City population
- 27,599
- Metro
- Bedford, IN
- Population (ZIP)
- 27,599
- Household income
- $68,108
- Rent vs Own
- Severe rent burden
- 507.0
Population outlook (Lawrence County) Hauer SSP2
- Today (2025)
- 44,347 people
- By 2030
- 43,331 · -2.3%
- By 2040
- 40,887 · -7.8%
- By 2050
- 38,297 · -13.6%
- By 2075
- 32,479 · -26.8%
- By 2100
- 26,051 · -41.3%
Race, ethnicity, and origin ACS 2023
- Neighborhood character
- Predominantly White (94%)
- Race & ethnicity
- White 94% Two or more races 4% Hispanic / Latino 2%
- Common ancestry
- Slovak 3% Italian 2% Scotch-Irish 1%
- Foreign-born
- 1% · Canada
- Languages at home
- 99% English-only · Spanish 1%
Political lean MEDSL · Lawrence
- 2024 margin
- Solid R (+51.0) · D 23.6% · R 74.6% · Other 1.7%
- 2008→2024 swing
- -30.5pp toward R · 2008: -20.6pp · 2024: -51.0pp
- All cycles
- 2024: R+51.0 2020: R+50.6 2016: R+51.5 2012: R+32.8 2008: R+20.6
Not yet ingested
- Civics
- —
Market trends
- HPI YoY
- ▼ -81.32%
- Current HPI
- 240.959
- Rent YoY
- —
- Metro
- Bedford, IN
- State GDP YoY
- ▲ 2.90%
- F500 in state
- 18
Industry mix (Fortune 500 HQ in IN)
| Industry | F500 HQs | Revenue |
|---|---|---|
| Industrial Machinery | 2 | $37B |
|
||
| Healthcare | 1 | $177B |
|
||
| Pharmaceuticals | 1 | $45B |
|
||
| Metals / Steel | 1 | $18B |
|
||
| Agriculture | 1 | $17B |
|
||
| Packaging | 1 | $12B |
|
||
Price history
-13.1% since first listed2 events — show timeline
- 2025-11-04 Price Changed $99,900 IRMLS
- 2025-09-27 Listed $114,900 IRMLS
Cash-flow waterfall
monthlySold comps — $/sqft
last 12 mo · ≤1 miLoading sold comps…