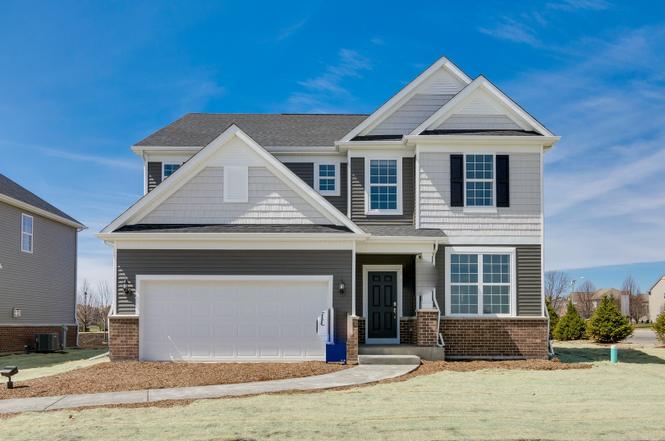
3248 Peyton Cir · Aurora, IL
Flood risk 1/10 · Minimal
- FEMA flood zone
- X (unshaded)
- Chance of flooding over 30 yrs
- 0.0%
- Est. flood insurance / yr
- $507 – $1,088
Fire risk 1/10 · Minimal
- Est. fire insurance / yr
- $804 – $1,492
Heat risk 3/10 · Minor
- Hot days now (above 103°F)
- 7 days/yr
- Hot days in 30 yrs
- 15 days/yr
Wind risk 2/10 · Minimal
- Chance of severe wind over 30 yrs
- 1.0%
Air-quality risk 3/10 · Minor
- Unhealthy air days now
- 3 days/yr
- Unhealthy air days in 30 yrs
- 4 days/yr
Risk factors via First Street. Map © Google.
Why this score? — see what drove the D+ grade
The composite is a weighted blend of 9 inputs, each scored 0–100. Each bar is that input's sub-score; the figure is the points it added to the 100-point composite (weight × sub-score).
- ARV discount +15.0/15.0
- Appreciation +10.0/10.0
- Cash flow +6.8/30.0
- Livability +3.8/5.0
- Schools +3.1/10.0
- Rent growth +2.5/5.0
- Condition / age +2.5/5.0
- 1% rule +1.9/10.0
- DSCR +1.1/10.0
$518,121
🖨 Deal sheet (PDF) 📄 Offer letter ✓ Due diligence
Listing remarks
Welcome home to Lincoln Crossing, a beautiful community of two-story homes designed for families. The Meadows Series presents the Continental, a spacious open concept layout featuring a separate formal dining room and flex space to use as you need. Enjoy your morning coffee in the bright airy sunroom. You will love entertaining family and friends in your spacious Great Room that is open to the casual dining area and kitchen. Your gourmet kitchen features SS appliances, white cabinets with quartz counters and a large island with seating. You have plenty of storage with all the cabinets and the large pantry. Picture yourself relaxing after a day of shopping or golf in your own private retreat
Key facts
- 2 garage spots
- Built 2026
- Listed 7 days
Neighborhood map
What this means for you Summary
Snapshot
- This is a 4-bed/2.5-bath single-family listed at $518k.
Deal economics
- At list price, monthly cash flow is $-799 ($-10k/yr) — negative.
- To cash-flow at today's rent, offer at most $403k (22.3% below list).
- To meet the 1% rule (rent ≥ 1% of price), the offer needs to be $360k (30.5% below list).
- Recommended offer: $360k (30.5% below list) — sets the bar for 1% rule.
- Cap rate 4.4% vs local median 3.5% in Aurora — meaningfully above typical; check what's discounted (condition, days-on-market, listing class) to confirm the premium yield is real.
Location & tenants
- Location reads 75/100 on livability (#232 in IL, #4,272 nationally) — a middle-class / working-renter tenant base. Strengths: commute A+, housing A+, employment A-; Watch: amenities F, health & safety F.
- CUSD 308 (suburban): math 29% / reading 34% proficiency, ranked #179 of 620 in IL (top 29%) — families likely to look elsewhere, expect single-tenant / working-renter base with shorter leases; only 20% free/reduced lunch — higher-income household profile.
- Zoned schools: Wolfs Crossing Elem School (math 42% / reading 42%, grade F, #336 of 2,056 statewide, top 18%, 485 students, 0% FRL); Bednarcik Junior High School (math 39% / reading 38%, grade F, #154 of 665 statewide, top 24%, 571 students, 0% FRL); Oswego East High School (math 35% / reading 40%, grade F, #104 of 693 statewide, top 15%, 2,836 students, 0% FRL) — zoned schools average 0% FRL vs 20% district-wide (20 pts lower); this property's tenant base skews higher-income than the district average.
- Market conditions: 122 active listings in the ZIP; 6 comparable units currently listed for rent nearby; rentals at typical pace (median 21d on market — plan ~3-4 weeks tenant-placement turnaround); high-income renter base; 2,028 units permitted in Will County in 2024 (530 in 5+ unit buildings).
- This rent runs 32% of the median local income ($137k/yr) — at the standard rent-burdened threshold; future hikes will face affordability resistance.
Forward outlook
- In year one you build about $55k of equity ($4k loan paydown + $52k appreciation (10.0% local appreciation)).
- Will County population projected to shrink 4% by 2050 — rents likely to lag national; underwrite the cash flow, not the appreciation.
- By year 2, paydown + projected appreciation supports a ~$89k cash-out refi (75% LTV) — recoverable capital for the next deal without selling this one.
Negotiation context
- Only 7 days on market — expect competitive offers; lowballing is unlikely to land.
- 4 sale attempts with the ask held roughly flat each time — persistent listings suggest the price (not the market) is what's stuck; bring a comps-based counter.
Questions for the listing agent
- What do current leases actually rent for vs. the listed asking? Can we see a recent rent roll and the last 12 months of T-12 income?
- What does the HOA fee cover, when was the last increase, and are there any pending special assessments or reserve-fund shortfalls?
- Is there a deadline driving the sale (1031 exchange, divorce, estate, relocation)? That informs how much negotiation room exists.
- Schools are F-rated, which usually means shorter tenancies and higher turnover. Who's the typical renter profile here, and what's been the actual vacancy rate?
- The area grade is low — what's the realistic commute time and amenity access for the typical tenant pool here? Any planned neighborhood developments (good or bad) we should know about?
- What's the average days-on-market for RENTAL listings here right now (not sales)? A rising rental-DOM trend means longer vacancies and softer asking-rent achievability than the comps imply.
- What's the recent tenant-quality profile in this submarket — average credit score on applications, eviction rate, late-payment / NSF rate, and stable-employment percentage? A property-management company in the area should have these aggregated.
- How much new for-sale + rental construction is in the pipeline within 1–3 miles? Heavy new supply typically softens prices + rents 12–24 months out; constrained supply supports both.
Investment metrics
- 1% rule
- 0.69% ✗
- Cap rate
- 4.44%
- Cash-on-cash
- -6.61%
- DSCR
- 0.71
- GRM
- 12.0
CMA / ARV
- ARV (on-the-fly)
- $710,125
- Comps found
- 12
Show comp detail 12 sales within ~0.75 mi
| Address | Dist | Beds/Ba | Sqft | Sold | Price | $/sf | Match |
|---|---|---|---|---|---|---|---|
| 3150 Bellwether Dr | 0.00mi | 3/2.5 (-1) | 2,754 (-4%) | 3mo | $681,614 | $247 | 86 |
| 3171 Bellwether Dr | 0.00mi | 3/3.5 (-1) | 2,754 (-4%) | 1mo | $839,979 | $305 | 83 |
| 3144 Peyton Cir | 0.00mi | 5/3.5 (+1) | 3,031 (+5%) | 0mo | $673,082 | $222 | 82 |
| 3144 Bellwether Dr | 0.00mi | 3/3.5 (-1) | 2,599 (-10%) | 2mo | $737,521 | $284 | 73 |
| 3148 Bellwether Dr | 0.00mi | 3/3.5 (-1) | 2,599 (-10%) | 2mo | $766,542 | $295 | 73 |
| 3169 Bellwether Dr | 0.00mi | 4/3.5 | 3,300 (+15%) | 0mo | $982,686 | $298 | 71 |
| 3152 Bellwether Dr | 0.00mi | 4/4.5 | 3,242 (+13%) | 1mo | $854,300 | $264 | 70 |
| 2208 Grand Pointe Trl | 0.57mi | 4/2.5 | 2,730 (-5%) | 2mo | $499,900 | $183 | 64 |
| 2013 Lyndhurst Ln | 0.71mi | 4/3.5 | 2,788 (-3%) | 2mo | $421,000 | $151 | 56 |
| 2263 Shiloh Dr | 0.34mi | 5/3.5 (+1) | 2,556 (-11%) | 3mo | $517,500 | $202 | 54 |
| 2322 Pagosa Springs Dr | 0.75mi | 4/3.5 | 2,729 (-5%) | 1mo | $505,000 | $185 | 52 |
| 1870 Keating Dr | 0.75mi | 4/2.5 | 2,600 (-10%) | 1mo | $583,990 | $225 | 49 |
Match score weights: distance 35% · size 25% · config 20% · recency 20%. Top-matched comps best support the ARV.
Projected returns pro-forma
10.0% appreciation · 3.0% rent growth · sell at horizon
- IRR
- 19.6%
- Equity multiple
- 2.60×
- Total profit
- $231,411
- Equity at exit
- $466,764
- IRR
- 18.0%
- Equity multiple
- 5.97×
- Total profit
- $721,650
- Equity at exit
- $1,006,595
Cash invested: $145,074 (down + closing). Projections, not guarantees.
Landlord ↔ Tenant lean methodology
- Overall (STATE)
- 43 Moderately Tenant-Leaning
- State Illinois
- 43 Moderately Tenant-Leaning · D+7
- County
- — inherits STATE
- City
- — inherits STATE
ZIP-level market 60503
- Home prices YoY
- 4.6%
- Active inventory
- 122
- Price-to-rent
- 12.0×
Monthly cashflow live
- Estimated rent
- $3,600 high interval (Pro) →
- Mortgage (P&I)
- −$2,717
- Tax est. 1.5%
- −$648 /mo · $7,772/yr
- Insurance
- −$216
- HOA
- −$62
- Vacancy / Maint / Mgmt
- −$756
- Net cashflow
- $-799
Break-even live
Sensitivity live
| Price | -10% $-441 | -5% $-620 | +0% $-799 | +5% $-978 | +10% $-1,157 |
|---|---|---|---|---|---|
| Rent | -10% $-1,083 | -5% $-941 | +0% $-799 | +5% $-656 | +10% $-514 |
| Rate | -1.0pp $-538 | -0.5pp $-667 | base $-799 | +0.5pp $-933 | +1.0pp $-1,069 |
UW: 25.0% down · 7.5% · 30yr · 1.5% tax · 5.0% vac · 8.0% maint · 8.0% mgmt
Financing live
Cash to close
- Down payment
- $129,530
- Closing costs
- $15,544
- Reserves months
- —
- Total cash needed
- —
Loan-product check · same deal, 3 products live
Conventional
25% down · 7.5% · 30yr
- Down + closing
- —
- Monthly P&I
- —
- Monthly cashflow
- —
- DSCR
- —
- Eligible?
- —
Personal DTI + credit; lowest rate.
DSCR
20% down · 8.5% · 30yr
- Down + closing
- —
- Monthly P&I
- —
- Monthly cashflow
- —
- DSCR
- —
- Eligible?
- —
No personal income docs; deal must DSCR.
Hard money
10% down · 12.0% · 12mo
- Down + closing
- —
- Monthly P&I
- —
- Monthly cashflow
- —
- DSCR
- —
- Eligible?
- —
Short-term bridge; refi at stabilization.
Rent comps 6 comps
| Address | Beds | Baths | Sqft | Rent | $/sqft | DOM | Units | Dist |
|---|---|---|---|---|---|---|---|---|
| 2036 Antietam Ct Aurora, IL | 4.0 | 2.5 | 2345 | $3,450 | $1.47 | 4d | 1 | 0.59mi |
| 1870 Canyon Creek Dr Aurora, IL | 5.0 | 2.5 | 2051 | $4,200 | $2.05 | 13d | 1 | 0.64mi |
| 1998 Conway Ln Aurora, IL | 4.0 | 2.5 | 2304 | $3,200 | $1.39 | 45d | 1 | 0.78mi |
| 2557 Tahoe Ct Aurora, IL | 3.0 | 2.5 | 3805 | $2,050 | $0.54 | 26d | 1 | 0.81mi |
| 464 Valentine Way Oswego, IL | 3.0 | 2.5 | 2071 | $2,800 | $1.35 | 1d | 1 | 1.19mi |
| 159 Chapin Way Oswego, IL | 4.0 | 3.5 | 2415 | $3,500 | $1.45 | 20d | 1 | 1.26mi |
HOA detail
- Monthly dues
- $62 · $744/yr
Listing history 7 events
-
2026-01-20status Pending
-
2026-01-13Contingent - No Showings
-
2026-01-13historical
-
2026-01-12$518,121
-
2025-11-10Active
-
2025-11-10historical
-
2025-08-20Active
ⓘ Source: listings_history table (triggers on properties + properties_extension) + one-shot
backfill from property_details.listing_events for pre-trigger history.
Climate risk First Street
- Flood 1/10 Low FEMA zone X (unshaded) · 0% chance over 30 yrs
- Wildfire 1/10 Low
- Heat 3/10 Moderate 7 d/yr ≥103°F today · 15 d/yr by 30 yrs out
- Wind 2/10 Low 100% chance of damaging wind over 30 yrs
- Air quality 3/10 Moderate 3 unhealthy d/yr today · 4 by 30 yrs out
Nearby sold comps map
Loading sold comps map…
Walkable amenities ~0.75 mi
Loading nearby amenities…
Taxation est. · year 1
- Rental income
- $43,200
- − Mortgage interest
- −$29,023
- − Property taxes
- −$7,772
- − Insurance
- −$2,591
- − Repairs & maintenance
- −$3,456
- − Management
- −$3,456
- − HOA
- −$744
- − Depreciation
- −$15,073
- Taxable loss
- −$18,914
- Est. tax savings @ 24.0%
- +$4,539
- After-tax cash flow
- $-5,044/yr
For passive investors: Depreciation is non-cash, so a rental often shows a tax loss while cash-flowing — sheltering income. Rental losses are passive: they offset passive income freely, and up to $25,000/yr can offset ordinary (W-2) income if you actively participate and your MAGI is under $100k (phasing out to $0 by $150k); unused losses carry forward. On sale, claimed depreciation is recaptured at up to 25%, and gains may owe capital-gains tax (a 1031 exchange can defer both). Figures are a year-1 estimate at your 24.0% rate — not tax advice; consult a CPA.
Schools (NCES district)
- District
- CUSD 308
- NCES district ID
- 1730270
- Math proficiency
- 29% ▼ -10.00%
- Reading proficiency
- 34% ▼ -9.00%
- Median HH income
- $89,945
- Composite
- 31.25/100
- National rank
- #6028
- State rank
- #179 of 620 in IL
Livability — Aurora
- Score
- 75/100
- State rank
- #232
- US rank
- #4272
Category grades
Schools grade is shown separately in the Schools card above.
Census & demographics
- Census place
- Aurora, IL
- County
- Will County · 412,448 people
- City population
- 186,692
- Metro
- Chicago-Naperville-Elgin, IL-IN-WI
- Population (ZIP)
- 16,789
- Household income
- $136,726
- Rent vs Own
- Severe rent burden
- 19.0
Population outlook (Will County) Hauer SSP2
- Today (2025)
- 705,368 people
- By 2030
- 708,154 · +0.4%
- By 2040
- 702,692 · -0.4%
- By 2050
- 680,249 · -3.6%
- By 2075
- 611,990 · -13.2%
- By 2100
- 516,215 · -26.8%
Race, ethnicity, and origin ACS 2023
- Neighborhood character
- Diverse neighborhood (Simpson 0.69)
- Race & ethnicity
- White 49% Asian 19% Black 14% Hispanic / Latino 14% Two or more races 7%
- Hispanic origin (detail)
- Mexican 11% Puerto Rican 1%
- Common ancestry
- Romanian 10% Scandinavian 3% Italian 1%
- Foreign-born
- 22% · Canada, China, Vietnam
- Languages at home
- 68% English-only · Other Indo-European 11% Spanish 8% Other Asian/Pacific 4%
Political lean MEDSL · Will
- 2024 margin
- Toss-up / Even · D 50.1% · R 48.5% · Other 1.4%
- 2008→2024 swing
- -11.6pp toward R · 2008: 13.2pp · 2024: 1.6pp
- All cycles
- 2024: D+1.6 2020: D+8.3 2016: D+5.7 2012: D+3.7 2008: D+13.2
Not yet ingested
- Civics
- —
Market trends
- HPI YoY
- ▲ 10.31%
- Current HPI
- 232.382
- Rent YoY
- —
- Metro
- Chicago-Naperville-Elgin, IL-IN-WI
- State GDP YoY
- ▲ 1.59%
- F500 in state
- 60
Industry mix (Fortune 500 HQ in IL)
| Industry | F500 HQs | Revenue |
|---|---|---|
| Insurance | 4 | $201B |
|
||
| Consumer Goods | 4 | $87B |
|
||
| Industrial Machinery | 3 | $64B |
|
||
| Healthcare | 2 | $55B |
|
||
| Retail / Pharmacy | 1 | $148B |
|
||
| Agriculture / Food | 1 | $86B |
|
||
Price history
7 events — show timeline
- 2026-01-20 Pending — MRED as Distributed by MLS Grid
- 2026-01-13 Listed — MRED as Distributed by MLS Grid
- 2026-01-13 Listing Removed — MRED as Distributed by MLS Grid
- 2026-01-12 Listed $518,121 MRED as Distributed by MLS Grid
- 2025-11-10 Listing Removed — MRED as Distributed by MLS Grid
- 2025-11-10 Listed — MRED as Distributed by MLS Grid
- 2025-08-20 Listed — MRED as Distributed by MLS Grid
Cash-flow waterfall
monthlySold comps — $/sqft
last 12 mo · ≤1 miLoading sold comps…