104 Lexington Rd · South Burlington, VT
Flood risk No data
- FEMA flood zone
- —
- Chance of flooding over 30 yrs
- —
- Est. flood insurance / yr
- —
Fire risk No data
- Est. fire insurance / yr
- —
Heat risk 2/10 · Minimal
- Hot days now (above threshold)
- 7 days/yr
- Hot days in 30 yrs
- 15 days/yr
Wind risk No data
- Chance of severe wind over 30 yrs
- —
Air-quality risk 3/10 · Minor
- Unhealthy air days now
- 3 days/yr
- Unhealthy air days in 30 yrs
- 3 days/yr
Risk factors via First Street. Map © Google.
Why this score? — see what drove the B+ grade
The composite is a weighted blend of 9 inputs, each scored 0–100. Each bar is that input's sub-score; the figure is the points it added to the 100-point composite (weight × sub-score).
- Cash flow +30.0/30.0
- ARV discount +15.0/15.0
- 1% rule +10.0/10.0
- DSCR +10.0/10.0
- Schools +5.0/10.0
- Livability +4.2/5.0
- Rent growth +2.5/5.0
- Condition / age +2.5/5.0
- Appreciation +0.0/10.0
$70,000
🖨 Deal sheet (PDF) 📄 Offer letter ✓ Due diligence
Listing remarks
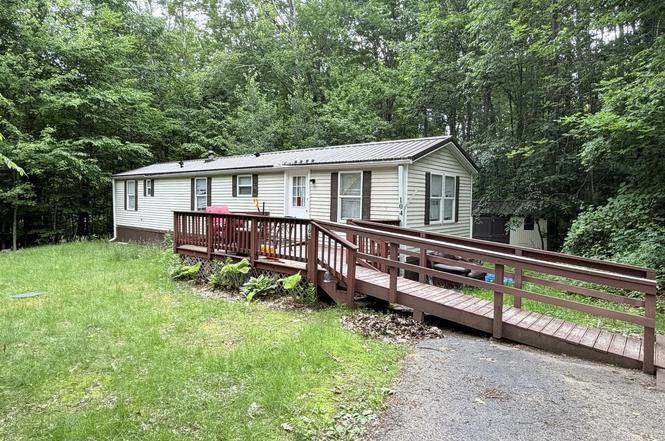
Opportunity knocks at 104 Lexington Road, a 1984 two-bedroom, one-bathroom single-wide home nestled on a remarkably private lot with beautiful front and backyards in Colchester’s highly desirable, resident-owned Westbury community. Being sold strictly as-is with all contents included, this property does require some TLC, but it offers a functional layout with a previously renovated bathroom, a large front and back deck, a spacious storage shed, and a steady ramp leading directly to the main entrance. Residents of this premier cooperative enjoy a inclusive lot rent covering plowing, road maintenance, trash, and recycling, alongside fantastic, shared neighborhood amenities like an outdo
Key facts
- Private lot
- Renovated bathroom
- Basketball courts
Tags
Property features AI
Finance
- HOA & community: Monthly park/association fee of $542; Fee includes plowing, recreation, sewer, trash, water, and park rent; Association amenities include master insurance, in-ground pool, basketball court, tennis court, snow removal, and trash removal
Exterior
- Utilities: Community water; Community sewer; Circuit breaker electrical service; No listed other utilities
- Home design: Single wide mobile home; Entry and living spaces on the main level
- Construction: Built in 1984; Vinyl siding; Metal roof
- Exterior features: Gravel driveway; Paved road frontage; Mobile park approval (Westbury Park)
Interior
- Kitchen: Eat-in kitchen
- Bedrooms: Two bedrooms on the main level
- Bathrooms: One 3/4 bath
- Heating & cooling: Forced air heating
- Interior features: 4 total rooms; Living Room; Eat-in Kitchen; 3/4 Bath
Neighborhood map
What this means for you Summary
Snapshot
- This is a 2-bed/1.0-bath manufactured listed at $70k.
Deal economics
- At list price, monthly cash flow is $703 ($8k/yr) — positive.
- The deal already cash-flows at list — no discount required.
- Meets the 1% rule at list price ($2k rent vs $70k).
- Cap rate 18.3% vs local median 2.5% in South Burlington — top-decile yield for the area; either an underpriced asset or a hidden risk that comps aren't pricing in. Stress-test before assuming the spread holds.
Location & tenants
- Location reads 84/100 on livability (#4 in VT, #765 nationally) — a professional / high-income tenant draw. Strengths: amenities A+, commute A+, employment A+; Watch: crime D-, cost of living D-.
- Market conditions: 89 active listings in the ZIP; solid renter incomes; 898 units permitted in Chittenden County in 2024 (554 in 5+ unit buildings).
Forward outlook
- Local home prices are declining (-3.0%/yr); year-one equity from $484 of loan paydown is wiped out by about $2k of value loss. Plan a longer hold.
- Chittenden County population projected at +8% by 2050 — modest demand growth; plan on rents tracking national, not racing it.
- At projected returns (-3.0% appreciation + 3.0% rent growth), your $20k cash investment doubles in ~3 years — after that, you're playing with house money.
Negotiation context
- Only 1 days on market — expect competitive offers; lowballing is unlikely to land.
- Current owner paid $22k; list at $70k implies a 218% gain — meaningful room to come down on a strong offer.
Risks & watch-outs
- Watch-outs: HOA is 26% of rent.
Questions for the listing agent
- What does the HOA fee cover, when was the last increase, and are there any pending special assessments or reserve-fund shortfalls?
- Is there a deadline driving the sale (1031 exchange, divorce, estate, relocation)? That informs how much negotiation room exists.
- Schools are B-rated — typically a magnet for longer-tenancy family renters. What's the average tenant stay here, and is there a school-zone premium baked into asking?
- Crime grade is D in this area — have there been break-ins, vandalism, or insurance claims at this property in the last 3 years? What carrier currently insures it and at what premium?
- What's the average days-on-market for RENTAL listings here right now (not sales)? A rising rental-DOM trend means longer vacancies and softer asking-rent achievability than the comps imply.
- What's the recent tenant-quality profile in this submarket — average credit score on applications, eviction rate, late-payment / NSF rate, and stable-employment percentage? A property-management company in the area should have these aggregated.
- How much new for-sale + rental construction is in the pipeline within 1–3 miles? Heavy new supply typically softens prices + rents 12–24 months out; constrained supply supports both.
Investment metrics
- 1% rule
- 3.03% ✓
- Cap rate
- 18.34%
- Cash-on-cash
- 43.02%
- DSCR
- 2.91
- GRM
- 2.8
CMA / ARV
- ARV (on-the-fly)
- $109,928
- Comps found
- 1
Show comp detail 1 sale within ~0.75 mi
| Address | Dist | Beds/Ba | Sqft | Sold | Price | $/sf | Match |
|---|---|---|---|---|---|---|---|
| 111 Brennan St | 0.16mi | 2/1.0 | 826 (+14%) | 20mo | $125,000 | $151 | 54 |
Match score weights: distance 35% · size 25% · config 20% · recency 20%. Top-matched comps best support the ARV.
Projected returns pro-forma
-3.0% appreciation · 3.0% rent growth · sell at horizon
- IRR
- 40.1%
- Equity multiple
- 2.72×
- Total profit
- $33,746
- Equity at exit
- $10,437
- IRR
- 46.5%
- Equity multiple
- 5.51×
- Total profit
- $88,367
- Equity at exit
- $6,052
Cash invested: $19,600 (down + closing). Projections, not guarantees.
Landlord ↔ Tenant lean methodology
- Overall (STATE)
- 41 Moderately Tenant-Leaning
- State Vermont
- 41 Moderately Tenant-Leaning · D+15
- County
- — inherits STATE
- City
- — inherits STATE
ZIP-level market 05446
- Home prices YoY
- -24.4%
- Active inventory
- 89
- Price-to-rent
- 2.8×
Monthly cashflow live
- Estimated rent
- $2,120 medium interval (Pro) →
- Mortgage (P&I)
- −$367
- Tax from tax record
- −$34 /mo · $404/yr
- Insurance
- −$29
- HOA
- −$542
- Vacancy / Maint / Mgmt
- −$445
- Net cashflow
- $703
Break-even live
Sensitivity live
| Price | -10% $742 | -5% $723 | +0% $703 | +5% $683 | +10% $663 |
|---|---|---|---|---|---|
| Rent | -10% $535 | -5% $619 | +0% $703 | +5% $786 | +10% $870 |
| Rate | -1.0pp $738 | -0.5pp $721 | base $703 | +0.5pp $685 | +1.0pp $666 |
UW: 25.0% down · 7.5% · 30yr · 1.5% tax · 5.0% vac · 8.0% maint · 8.0% mgmt
Financing live
Cash to close
- Down payment
- $17,500
- Closing costs
- $2,100
- Reserves months
- —
- Total cash needed
- —
Loan-product check · same deal, 3 products live
Conventional
25% down · 7.5% · 30yr
- Down + closing
- —
- Monthly P&I
- —
- Monthly cashflow
- —
- DSCR
- —
- Eligible?
- —
Personal DTI + credit; lowest rate.
DSCR
20% down · 8.5% · 30yr
- Down + closing
- —
- Monthly P&I
- —
- Monthly cashflow
- —
- DSCR
- —
- Eligible?
- —
No personal income docs; deal must DSCR.
Hard money
10% down · 12.0% · 12mo
- Down + closing
- —
- Monthly P&I
- —
- Monthly cashflow
- —
- DSCR
- —
- Eligible?
- —
Short-term bridge; refi at stabilization.
HOA detail
- Monthly dues
- $542 · $6,504/yr
- Likely covers
- trash
Listing history 2 events
-
2026-06-18remarks 693-char remark
-
2026-06-18$70,000 Active 1 DOM
ⓘ Source: listings_history table (triggers on properties + properties_extension) + one-shot
backfill from property_details.listing_events for pre-trigger history.
Tax reassessment forecast VT · Partial reset (capped growth)
- Current annual tax
- $404 · $34/mo
- Projected year-2 tax
- $867 · $72/mo
- Expected delta
- +$463/yr (+$39/mo · 114.6%)
ⓘ Screening estimate from a state-policy table — verify with the county assessor before closing.
Climate risk First Street
- Heat 2/10 Low
- Air quality 3/10 Moderate 3 unhealthy d/yr today · 3 by 30 yrs out
Nearby sold comps map
Loading sold comps map…
Walkable amenities ~0.75 mi
Loading nearby amenities…
Taxation est. · year 1
- Rental income
- $25,438
- − Mortgage interest
- −$3,921
- − Property taxes
- −$404
- − Insurance
- −$350
- − Repairs & maintenance
- −$2,035
- − Management
- −$2,035
- − HOA
- −$6,504
- − Depreciation
- −$2,036
- Taxable income
- $8,152
- Est. tax owed @ 24.0%
- −$1,957
- After-tax cash flow
- $6,476/yr
For passive investors: Depreciation is non-cash, so a rental often shows a tax loss while cash-flowing — sheltering income. Rental losses are passive: they offset passive income freely, and up to $25,000/yr can offset ordinary (W-2) income if you actively participate and your MAGI is under $100k (phasing out to $0 by $150k); unused losses carry forward. On sale, claimed depreciation is recaptured at up to 25%, and gains may owe capital-gains tax (a 1031 exchange can defer both). Figures are a year-1 estimate at your 24.0% rate — not tax advice; consult a CPA.
Schools (NCES district)
No district data.
Livability — South Burlington
- Score
- 84/100
- State rank
- #4
- US rank
- #765
Category grades
Schools grade is shown separately in the Schools card above.
Census & demographics
- County
- Chittenden County · 110,603 people
- City population
- 20,614
- Metro
- Burlington-South Burlington, VT
- Population (ZIP)
- 16,452
- Household income
- $97,475
- Rent vs Own
- Severe rent burden
- 259.0
Population outlook (Chittenden County) Hauer SSP2
- Today (2025)
- 170,769 people
- By 2030
- 174,716 · +2.3%
- By 2040
- 180,337 · +5.6%
- By 2050
- 183,768 · +7.6%
- By 2075
- 194,646 · +14.0%
- By 2100
- 194,933 · +14.2%
Race, ethnicity, and origin ACS 2023
- Neighborhood character
- Predominantly White (86%)
- Race & ethnicity
- White 86% Two or more races 6% Hispanic / Latino 4% Black 2% Asian 2%
- Common ancestry
- Lithuanian 14% Italian 4% Slovak 3%
- Foreign-born
- 9% · Canada, India, China
- Languages at home
- 91% English-only · French/Haitian/Cajun 2% Other Indo-European 2% Russian/Polish/Slavic 2%
Political lean MEDSL · Chittenden
- 2024 margin
- Solid D (+53.6) · D 75.4% · R 21.7% · Other 2.9%
- 2008→2024 swing
- +8.9pp toward D · 2008: 44.8pp · 2024: 53.6pp
- All cycles
- 2024: D+53.6 2020: D+54.5 2016: D+46.8 2012: D+41.9 2008: D+44.8
Not yet ingested
- Civics
- —
Market trends
- HPI YoY
- ▼ -131.02%
- Current HPI
- 406.7675
- Rent YoY
- —
- Metro
- Burlington-South Burlington, VT
- State GDP YoY
- —
- F500 in state
- 0
Price history
+218.2% since first listed2 events — show timeline
- 2026-06-18 Listed $70,000 PrimeMLS
- 2010-09-16 Sold (Public Records) $22,000 Public Records
Property tax history
-1.0%/yrLatest (2024): $404 · +9.9% YoY. Source: county tax records.
Cash-flow waterfall
monthlySold comps — $/sqft
last 12 mo · ≤1 miLoading sold comps…