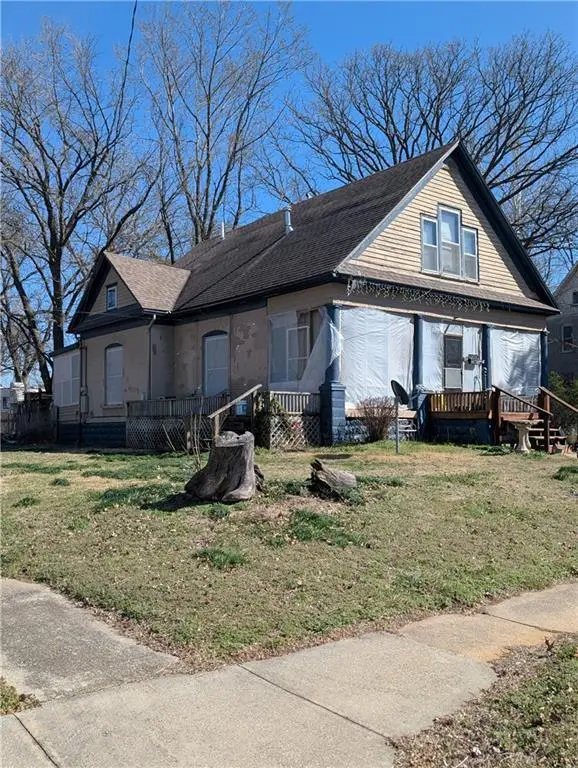
403 S Adams St · Nevada, MO
Flood risk 1/10 · Minimal
- FEMA flood zone
- X (unshaded)
- Chance of flooding over 30 yrs
- 0.0%
- Est. flood insurance / yr
- $473 – $860
Fire risk 2/10 · Minimal
- Est. fire insurance / yr
- $1,054 – $1,958
Heat risk 5/10 · Moderate
- Hot days now (above 108°F)
- 7 days/yr
- Hot days in 30 yrs
- 19 days/yr
Wind risk 2/10 · Minimal
- Chance of severe wind over 30 yrs
- 1.0%
Air-quality risk 2/10 · Minimal
- Unhealthy air days now
- 0 days/yr
- Unhealthy air days in 30 yrs
- 1 days/yr
Risk factors via First Street. Map © Google.
Why this score? — see what drove the C+ grade
The composite is a weighted blend of 9 inputs, each scored 0–100. Each bar is that input's sub-score; the figure is the points it added to the 100-point composite (weight × sub-score).
- Cash flow +22.5/30.0
- ARV discount +15.0/15.0
- DSCR +7.2/10.0
- 1% rule +5.4/10.0
- Schools +3.2/10.0
- Livability +3.0/5.0
- Rent growth +2.5/5.0
- Condition / age +2.5/5.0
- Appreciation +0.0/10.0
$99,900
🖨 Deal sheet (PDF) 📄 Offer letter ✓ Due diligence
Listing remarks MLS
A historical Nevada home. The current owners have some health issues, so the home doesn't show as well as they would like. It's a good solid house but needs refreshed. It has many positive features including central heat & air, hardwood floors, 2 car detached garage, lots of square footage, corner lot, deck, covered porch. .. It would be nice to see it freshly painted & changes made more fitting for the era of it's time to bring it back to it's glory! The owners have currently converted it into a 5 bedroom, but the wall & door that was added can easily be removed to open it back up. It has a flue from a woodstove in the past.
Key facts
- Covered porch
- Central heat and air
- Deck
Tags
Neighborhood map
What this means for you Summary
Snapshot
- This is a 3-bed/2.0-bath single-family listed at $100k.
Deal economics
- At list price, monthly cash flow is $169 ($2k/yr) — positive.
- The deal already cash-flows at list — no discount required.
- Meets the 1% rule at list price ($1k rent vs $100k).
- Recommended offer: $91k (9.0% below list) — sets the bar for market timing.
- Cap rate 8.3% vs local median 5.0% in Nevada — top-decile yield for the area; either an underpriced asset or a hidden risk that comps aren't pricing in. Stress-test before assuming the spread holds.
Location & tenants
- Location reads 59/100 on livability (#519 in MO) — a working-class tenant base; expect higher turnover. Strengths: cost of living A+, housing A; Watch: crime F, amenities F, commute F.
- Nevada R-V (town): math 33% / reading 44% proficiency, ranked #180 of 324 in MO (top 56%) — families likely to look elsewhere, expect single-tenant / working-renter base with shorter leases.
- Zoned schools: Truman Elem. (math 25% / reading 41%, grade F, #744 of 1,115 statewide, top 67%, 500 students, 58% FRL); Nevada Middle (math 38% / reading 43%, grade F, #180 of 391 statewide, top 47%, 529 students, 54% FRL); Nevada High (math 38% / reading 52%, grade D-, #176 of 521 statewide, top 34%, 786 students, 48% FRL).
- Market conditions: 105 active listings in the ZIP; 2 comparable units currently listed for rent nearby; 57 units permitted in Vernon County in 2024 (38 in 5+ unit buildings).
Forward outlook
- Local home prices are declining (-3.0%/yr); year-one equity from $691 of loan paydown is wiped out by about $3k of value loss. Plan a longer hold.
- Vernon County population projected at -13% by 2050 — secular population decline; favor cash flow + early exit over multi-decade hold.
Negotiation context
- It's been on market 97 days — a 9% lower offer ($91k) is reasonable based on typical stale-listing flexibility.
- 6 sale attempts since 18y ago with the ask held roughly flat each time — persistent listings suggest the price (not the market) is what's stuck; bring a comps-based counter.
- Current owner paid $70k; 43% above their basis — modest negotiation headroom, anchor on the comps not their cost.
Risks & watch-outs
- Watch-outs: built in 1880 — expect roof / HVAC / electrical / plumbing capex.
- Climate carrying-cost: extreme-heat days projected 7→19/yr by 2055 (HVAC capex compounding) — expect insurance premiums to compound above CPI over the hold.
Questions for the listing agent
- It's been on market 97 days. Have you received any prior offers? Is the seller open to a 9% concession, seller financing, or rate buy-down credit?
- Built in 1880 — when were the roof, HVAC, electrical panel, plumbing, and water heater last replaced?
- Why hasn't it sold? Are there any deal-killer items the seller is aware of (foundation, flood, title, zoning, code violations)?
- Is there a deadline driving the sale (1031 exchange, divorce, estate, relocation)? That informs how much negotiation room exists.
- Crime grade is F in this area — have there been break-ins, vandalism, or insurance claims at this property in the last 3 years? What carrier currently insures it and at what premium?
- What's the average days-on-market for RENTAL listings here right now (not sales)? A rising rental-DOM trend means longer vacancies and softer asking-rent achievability than the comps imply.
- What's the recent tenant-quality profile in this submarket — average credit score on applications, eviction rate, late-payment / NSF rate, and stable-employment percentage? A property-management company in the area should have these aggregated.
- How much new for-sale + rental construction is in the pipeline within 1–3 miles? Heavy new supply typically softens prices + rents 12–24 months out; constrained supply supports both.
Investment metrics
- 1% rule
- 1.04% ✓
- Cap rate
- 8.32%
- Cash-on-cash
- 7.23%
- DSCR
- 1.32
- GRM
- 8.0
CMA / ARV
- ARV (median comp)
- $146,394
- List price
- $99,900
- Delta
- -31.76%
- Verdict
- UNDERPRICED
- Comps
- 20 within 1.0 mi
Show comp detail 12 sales within ~0.75 mi
| Address | Dist | Beds/Ba | Sqft | Sold | Price | $/sf | Match |
|---|---|---|---|---|---|---|---|
| 325 S Ash St | 0.08mi | 2/1.5 (-1) | 1,790 (-9%) | 0mo | $1 | — | 74 |
| 628 S Clay St | 0.21mi | 3/3.0 | 1,848 (-6%) | 3mo | $183,000 | $99 | 74 |
| 928 W Arch St | 0.47mi | 3/2.0 | 1,868 (-5%) | 1mo | $215,000 | $115 | 69 |
| 710 W Ewing St | 0.50mi | 3/2.0 | 2,072 (+6%) | 1mo | $1 | — | 66 |
| 704 W Burton St | 0.61mi | 3/1.0 | 1,964 (+0%) | 6mo | $167,500 | $85 | 62 |
| 802 S Timberbrook Dr | 0.38mi | 3/2.0 | 1,723 (-12%) | 1mo | $228,000 | $132 | 61 |
| 519 W Cherry St | 0.25mi | 3/1.5 | 1,712 (-13%) | 6mo | $162,700 | $95 | 60 |
| 626 W Allison St | 0.53mi | 3/2.0 | 1,791 (-9%) | 2mo | $203,500 | $114 | 59 |
| 429 N Washington St | 0.59mi | 3/2.0 | 1,871 (-5%) | 8mo | $1 | — | 58 |
| 805 W Sycamore St | 0.33mi | 4/1.5 (+1) | 2,205 (+12%) | 8mo | $1 | — | 50 |
| 514 N Washington St | 0.64mi | 4/2.0 (+1) | 1,842 (-6%) | 7mo | $179,900 | $98 | 49 |
| 1115 S Cedar St | 0.59mi | 2/2.0 (-1) | 1,680 (-14%) | 6mo | $230,000 | $137 | 38 |
Match score weights: distance 35% · size 25% · config 20% · recency 20%. Top-matched comps best support the ARV.
Projected returns pro-forma
-3.0% appreciation · 3.0% rent growth · sell at horizon
- IRR
- -5.2%
- Equity multiple
- 0.80×
- Total profit
- $-5,456
- Equity at exit
- $14,895
- IRR
- 4.4%
- Equity multiple
- 1.32×
- Total profit
- $9,046
- Equity at exit
- $8,638
Cash invested: $27,972 (down + closing). Projections, not guarantees.
Landlord ↔ Tenant lean methodology
- Overall (STATE)
- 81 Strongly Landlord-Friendly
- State Missouri
- 81 Strongly Landlord-Friendly · R+10
- County
- — inherits STATE
- City
- — inherits STATE
ZIP-level market 64772
- Active inventory
- 105
- Price-to-rent
- 8.0×
Monthly cashflow live
- Estimated rent
- $1,039 medium interval (Pro) →
- Mortgage (P&I)
- −$524
- Tax from tax record
- −$87 /mo · $1,041/yr
- Insurance
- −$42
- HOA
- −$0
- Vacancy / Maint / Mgmt
- −$218
- Net cashflow
- $169
Break-even live
Sensitivity live
| Price | -10% $225 | -5% $197 | +0% $169 | +5% $140 | +10% $112 |
|---|---|---|---|---|---|
| Rent | -10% $87 | -5% $128 | +0% $169 | +5% $210 | +10% $251 |
| Rate | -1.0pp $219 | -0.5pp $194 | base $169 | +0.5pp $143 | +1.0pp $116 |
UW: 25.0% down · 7.5% · 30yr · 1.5% tax · 5.0% vac · 8.0% maint · 8.0% mgmt
Financing live
Cash to close
- Down payment
- $24,975
- Closing costs
- $2,997
- Reserves months
- —
- Total cash needed
- —
Loan-product check · same deal, 3 products live
Conventional
25% down · 7.5% · 30yr
- Down + closing
- —
- Monthly P&I
- —
- Monthly cashflow
- —
- DSCR
- —
- Eligible?
- —
Personal DTI + credit; lowest rate.
DSCR
20% down · 8.5% · 30yr
- Down + closing
- —
- Monthly P&I
- —
- Monthly cashflow
- —
- DSCR
- —
- Eligible?
- —
No personal income docs; deal must DSCR.
Hard money
10% down · 12.0% · 12mo
- Down + closing
- —
- Monthly P&I
- —
- Monthly cashflow
- —
- DSCR
- —
- Eligible?
- —
Short-term bridge; refi at stabilization.
Rent comps 2 comps
| Address | Beds | Baths | Sqft | Rent | $/sqft | DOM | Units | Dist |
|---|---|---|---|---|---|---|---|---|
| 317 E Hickory St Nevada, MO | 3.0 | 1.0 | 1296 | $1,050 | $0.81 | 45d | 1 | 0.68mi |
| 515 N Tower St Nevada, MO | 3.0 | 1.0 | 1305 | $1,025 | $0.79 | 45d | 1 | 0.88mi |
Listing history 27 events
-
2026-06-21days on market $99,900 Active 97 DOM
-
2026-06-21days on market $99,900 Active 96 DOM
-
2026-06-18days on market $99,900 Active 94 DOM
-
2026-06-17days on market $99,900 Active 93 DOM
-
2026-06-16days on market $99,900 Active 92 DOM
-
2026-06-15days on market $99,900 Active 91 DOM
-
2026-06-13days on market $99,900 Active 89 DOM
-
2026-06-12days on market $99,900 Active 88 DOM
-
2026-06-09days on market $99,900 Active 85 DOM
-
2026-06-08days on market $99,900 Active 84 DOM
-
2026-06-07days on market $99,900 Active 83 DOM
-
2026-06-07days on market $99,900 Active 82 DOM
-
2026-06-04days on market $99,900 Active 79 DOM
-
2026-06-02days on market $99,900 Active 78 DOM
-
2026-06-01days on market $99,900 Active 77 DOM
-
2026-05-31days on market $99,900 Active 76 DOM
-
2026-03-16$99,900 Active 651-char remark
Show marketing remark (651 chars)
A historical Nevada home. The current owners have some health issues, so the home doesn't show as well as they would like. It's a good solid house but needs refreshed. It has many positive features including central heat & air, hardwood floors, 2 car detached garage, lots of square footage, corner lot, deck, covered porch. .. It would be nice to see it freshly painted & changes made more fitting for the era of it's time to bring it back to it's glory! The owners have currently converted it into a 5 bedroom, but the wall & door that was added can easily be removed to open it back up. It has a flue from a woodstove in the past.
-
2024-07-30historical
-
2024-07-19$74,900 Active
-
2018-07-02soldstatus $69,900
-
2018-06-29soldstatus
-
2018-05-01$69,900
-
2015-06-03$69,900
-
2012-03-23$78,500
-
2009-04-21soldstatus
-
2008-05-05$79,900
-
1997-03-01soldstatus
ⓘ Source: listings_history table (triggers on properties + properties_extension) + one-shot
backfill from property_details.listing_events for pre-trigger history.
Tax reassessment forecast MO · Resets to sale price
- Current annual tax
- $1,041 · $87/mo
- Projected year-2 tax
- $1,041 · $87/mo
- Expected delta
- $0/yr ($0/mo · 0.0%)
ⓘ Screening estimate from a state-policy table — verify with the county assessor before closing.
Climate risk First Street
- Flood 1/10 Low FEMA zone X (unshaded) · 0% chance over 30 yrs
- Wildfire 2/10 Low
- Heat 5/10 Major 7 d/yr ≥108°F today · 19 d/yr by 30 yrs out
- Wind 2/10 Low 100% chance of damaging wind over 30 yrs
- Air quality 2/10 Low 0 unhealthy d/yr today · 1 by 30 yrs out
Nearby sold comps map
Loading sold comps map…
Walkable amenities ~0.75 mi
Loading nearby amenities…
Taxation est. · year 1
- Rental income
- $12,469
- − Mortgage interest
- −$5,596
- − Property taxes
- −$1,041
- − Insurance
- −$500
- − Repairs & maintenance
- −$998
- − Management
- −$998
- − Depreciation
- −$2,906
- Taxable income
- $431
- Est. tax owed @ 24.0%
- −$104
- After-tax cash flow
- $1,920/yr
For passive investors: Depreciation is non-cash, so a rental often shows a tax loss while cash-flowing — sheltering income. Rental losses are passive: they offset passive income freely, and up to $25,000/yr can offset ordinary (W-2) income if you actively participate and your MAGI is under $100k (phasing out to $0 by $150k); unused losses carry forward. On sale, claimed depreciation is recaptured at up to 25%, and gains may owe capital-gains tax (a 1031 exchange can defer both). Figures are a year-1 estimate at your 24.0% rate — not tax advice; consult a CPA.
Schools (NCES district)
- District
- Nevada R-V
- NCES district ID
- 2921840
- Math proficiency
- 33% ▼ -1.00%
- Reading proficiency
- 44% ▼ -1.00%
- Median HH income
- $38,804
- Composite
- 32.14/100
- National rank
- #5792
- State rank
- #180 of 324 in MO
Livability — Nevada
- Score
- 59/100
- State rank
- #519
- US rank
- #19644
Category grades
Schools grade is shown separately in the Schools card above.
Census & demographics
- Census place
- Nevada, MO
- Population (ZIP)
- 12,930
Population outlook (Vernon County) Hauer SSP2
- Today (2025)
- 20,169 people
- By 2030
- 19,639 · -2.6%
- By 2040
- 18,551 · -8.0%
- By 2050
- 17,549 · -13.0%
- By 2075
- 15,314 · -24.1%
- By 2100
- 13,132 · -34.9%
Race, ethnicity, and origin ACS 2023
- Neighborhood character
- Predominantly White (92%)
- Race & ethnicity
- White 92% Two or more races 4% Hispanic / Latino 3% Black 1% Asian 1%
- Common ancestry
- Italian 3% Portuguese 2% Romanian 2%
- Foreign-born
- 1%
- Languages at home
- 98% English-only · German/W. Germanic 1%
Political lean MEDSL · Vernon
- 2024 margin
- Solid R (+59.5) · D 19.8% · R 79.3%
- 2008→2024 swing
- -37.5pp toward R · 2008: -22.0pp · 2024: -59.5pp
- All cycles
- 2024: R+59.5 2020: R+57.2 2016: R+56.2 2012: R+37.3 2008: R+22.0
Not yet ingested
- Civics
- —
Market trends
- HPI YoY
- ▼ -84.21%
- Current HPI
- 150.7283
- Rent YoY
- —
- Metro
- —
- State GDP YoY
- ▲ 1.84%
- F500 in state
- 20
Industry mix (Fortune 500 HQ in MO)
| Industry | F500 HQs | Revenue |
|---|---|---|
| Healthcare | 1 | $163B |
|
||
| Insurance | 1 | $21B |
|
||
| Industrial Technology | 1 | $17B |
|
||
| Retail | 1 | $16B |
|
||
| Industrial Distribution | 1 | $10B |
|
||
| Utilities | 1 | $9B |
|
||
Price history
+25.0% since first listed11 events — show timeline
- 2026-03-16 Listed $99,900 Heartland MLS as Distributed by MLS Grid
- 2024-07-30 Listing Removed — Heartland MLS as Distributed by MLS Grid
- 2024-07-19 Listed $74,900 Heartland MLS as Distributed by MLS Grid
- 2018-07-02 Sold (Public Records) $69,900 Public Records
- 2018-06-29 Sold (MLS) — Heartland MLS as Distributed by MLS Grid
- 2018-05-01 Listed $69,900 Heartland MLS as Distributed by MLS Grid
- 2015-06-03 Listed $69,900 Heartland MLS as Distributed by MLS Grid
- 2012-03-23 Listed $78,500 Heartland MLS as Distributed by MLS Grid
- 2009-04-21 Sold (Public Records) — Public Records
- 2008-05-05 Listed $79,900 Heartland MLS as Distributed by MLS Grid
- 1997-03-01 Sold (Public Records) — Public Records
Property tax history
+3.1%/yrLatest (2025): $1,041 · +13.6% YoY. Source: county tax records.
Cash-flow waterfall
monthlySold comps — $/sqft
last 12 mo · ≤1 miLoading sold comps…