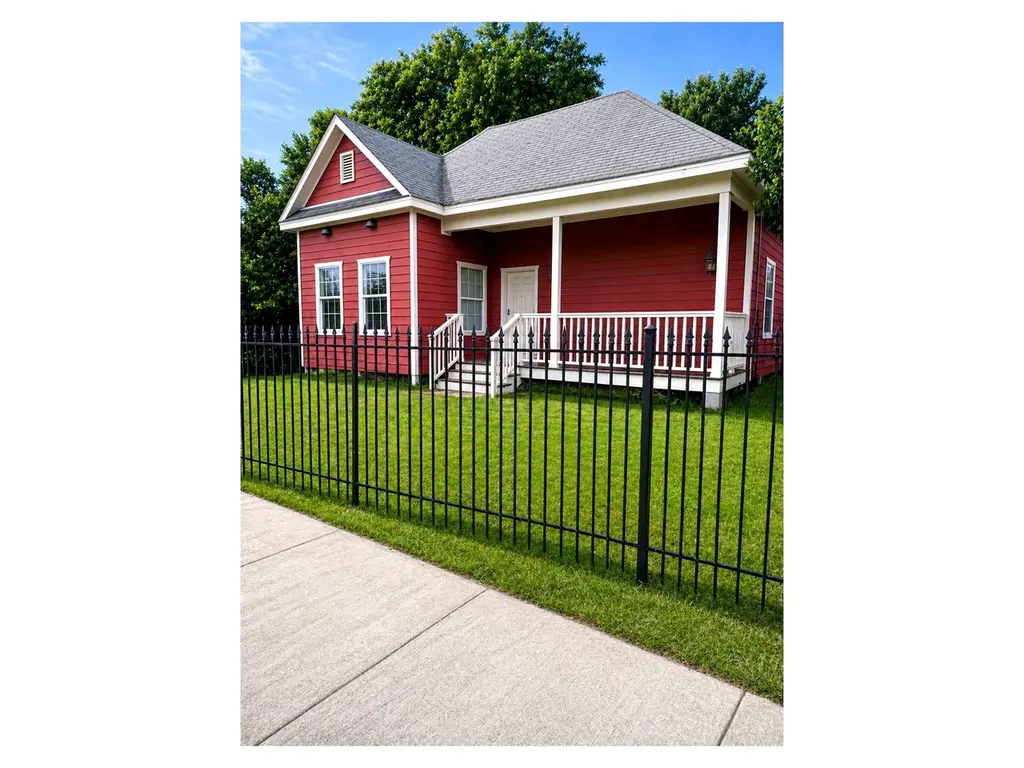
 Triplex
1504 Freeman St · Houston, TX
Flood risk 4/10 · Minor
- FEMA flood zone
- X (unshaded)
- Chance of flooding over 30 yrs
- 0.22%
- Est. flood insurance / yr
- $507 – $1,088
Fire risk 1/10 · Minimal
- Est. fire insurance / yr
- $1,222 – $2,270
Heat risk 9/10 · Severe
- Hot days now (above 109°F)
- 7 days/yr
- Hot days in 30 yrs
- 24 days/yr
Wind risk 9/10 · Severe
- Chance of severe wind over 30 yrs
- 99.0%
Air-quality risk 3/10 · Minor
- Unhealthy air days now
- 2 days/yr
- Unhealthy air days in 30 yrs
- 3 days/yr
Risk factors via First Street. Map © Google.
Why this score? — see what drove the D grade
The composite is a weighted blend of 9 inputs, each scored 0–100. Each bar is that input's sub-score; the figure is the points it added to the 100-point composite (weight × sub-score).
- Cash flow +13.9/30.0
- ARV discount +9.0/15.0
- DSCR +4.2/10.0
- 1% rule +3.9/10.0
- Livability +3.7/5.0
- Rent growth +2.7/5.0
- Schools +2.7/10.0
- Condition / age +2.5/5.0
- Appreciation +0.0/10.0
$409,000
🖨 Deal sheet 📄 Offer letter ✓ Due diligence
Multi-family units
County records classify this as Multi-Family (2-4 Unit). Listing-text estimate: 3 units. confirmed
Listing remarks
This Triplex is located in one of Houston’s rapidly evolving inner-loop corridors, this property offers a prime buy-and-hold opportunity in a high-growth area. Just minutes from Downtown, The Heights, and major redevelopment projects, the surrounding neighborhood continues to see strong investment and new construction. Situated on a single lot, the property features three separate units, each offering 2 bedrooms and 1 bathroom with approximately 630 sq ft of living space. All units will be delivered vacant, providing flexibility to lease at current market rates. Previously rented around $950 per unit, this property presents strong income potential with upside as the area continues to
Key facts
- 5,000 sq ft lot
- Built 1930
- Listed 50 days
Property features AI
Exterior
- Utilities: Electricity available; Natural gas available; Water available
- Home design: Residential income property; Built in 1930; Total building area approximately 1,978
- Construction: Composition roof
- Exterior features: Corner lot
Interior
- Bedrooms: Unit with 2 bedrooms; Three total units on property
- Bathrooms: 3 full bathrooms (total for property)
- Heating & cooling: Window units for cooling; Heating provided by wall furnace and window unit
- Interior features: Refrigerator
Neighborhood map
What this means for you Summary
Snapshot
- This is a 3 × 2-bed/1-bath units multifamily listed at $409k.
Deal economics
- At list price, monthly cash flow is $44 ($526/yr) — positive. Per door: $15/mo.
- The deal already cash-flows at list — no discount required.
- To meet the 1% rule (rent ≥ 1% of price), the offer needs to be $363k (11.2% below list).
- Recommended offer: $363k (11.2% below list) — sets the bar for 1% rule.
- Cap rate 6.4% vs local median 3.2% in Houston — top-decile yield for the area; either an underpriced asset or a hidden risk that comps aren't pricing in. Stress-test before assuming the spread holds.
Location & tenants
- Location reads 74/100 on livability (#184 in TX, #4,771 nationally) — a middle-class / working-renter tenant base. Strengths: amenities A+, cost of living A+, housing A+; Watch: crime F.
- Houston ISD (urban): math 27% / reading 35% proficiency, ranked #593 of 826 in TX (top 72%) — families likely to look elsewhere, expect single-tenant / working-renter base with shorter leases; 71% free/reduced lunch — lower-income household profile, screen leases tightly.
- Zoned schools: Marshall Middle (math 14% / reading 22%, grade F, #1,491 of 1,662 statewide, top 91%, 607 students, 97% FRL); Northside H S (math 15% / reading 26%, grade F, #1,389 of 1,632 statewide, top 86%, 1,168 students, 94% FRL) — zoned schools average 95% FRL vs 71% district-wide (24 pts higher); higher-poverty schools than district average — tighter screening recommended.
- Market conditions: Rents flat; 595 active listings in the ZIP; 40 comparable units currently listed for rent nearby; rentals at typical pace (median 22d on market — plan ~3-4 weeks tenant-placement turnaround); 48% of comp listings sitting > 30 days — soft ceiling on asking rent; solid renter incomes; 29,883 units permitted in Harris County in 2024 (8,621 in 5+ unit buildings).
- At $3,630/mo this rent would consume 52% of the median local household income ($83k/yr) (locally 994% of renters already pay >50% of income on rent) — very limited rent-growth headroom before tenants either downsize or default.
Forward outlook
- Local home prices are declining (-3.0%/yr); year-one equity from $3k of loan paydown is wiped out by about $12k of value loss. Plan a longer hold.
- Harris County population projected at +47% by 2050 — long-run rental-demand tailwind backs the buy-and-hold thesis.
Negotiation context
- It's been on market 50 days — a 3% lower offer ($397k) is reasonable based on typical stale-listing flexibility.
Risks & watch-outs
- Watch-outs: built in 1930 — expect roof / HVAC / electrical / plumbing capex.
- Climate carrying-cost: severe wind risk, 99% chance of damaging wind over 30y; extreme-heat days projected 7→24/yr by 2055 (HVAC capex compounding) — expect insurance premiums to compound above CPI over the hold.
Questions for the listing agent
- It's been on market 50 days. Have you received any prior offers? Is the seller open to a 11% concession, seller financing, or rate buy-down credit?
- Can we see the unit-by-unit rent roll, current vacancy, and any below-market leases? What's the average tenancy length?
- What capital expenditures (roof, boiler, parking lot, exteriors) have been made in the last 5 years, and what's planned in the next 2?
- Built in 1930 — when were the roof, HVAC, electrical panel, plumbing, and water heater last replaced?
- Is there a deadline driving the sale (1031 exchange, divorce, estate, relocation)? That informs how much negotiation room exists.
- Schools are D-rated, which usually means shorter tenancies and higher turnover. Who's the typical renter profile here, and what's been the actual vacancy rate?
- Crime grade is F in this area — have there been break-ins, vandalism, or insurance claims at this property in the last 3 years? What carrier currently insures it and at what premium?
- The area grade is low — what's the realistic commute time and amenity access for the typical tenant pool here? Any planned neighborhood developments (good or bad) we should know about?
- What's the average days-on-market for RENTAL listings here right now (not sales)? A rising rental-DOM trend means longer vacancies and softer asking-rent achievability than the comps imply.
- What's the recent tenant-quality profile in this submarket — average credit score on applications, eviction rate, late-payment / NSF rate, and stable-employment percentage? A property-management company in the area should have these aggregated.
- How much new apartment / multifamily construction is in the pipeline within 1–3 miles? Heavy new supply (>2% of stock underway) typically softens rents 12–24 months out; light construction supports rent growth.
Investment metrics
- 1% rule
- 0.89% ✗
- Cap rate
- 6.42%
- Cash-on-cash
- 0.46%
- DSCR
- 1.02
- GRM
- 9.4
CMA / ARV
- ARV (median comp)
- $423,014
- List price
- $409,000
- Delta
- -3.31%
- Verdict
- FAIR
- Comps
- 7 within 1.0 mi
Projected returns pro-forma
-3.0% appreciation · 0.84% rent growth · sell at horizon
- IRR
- -18.0%
- Equity multiple
- 0.38×
- Total profit
- $-71,154
- Equity at exit
- $60,983
- IRR
- -15.0%
- Equity multiple
- 0.23×
- Total profit
- $-88,495
- Equity at exit
- $35,363
Cash invested: $114,520 (down + closing). Projections, not guarantees.
Landlord ↔ Tenant lean methodology
- Overall (STATE)
- 87 Strongly Landlord-Friendly
- State Texas
- 87 Strongly Landlord-Friendly · R+5
- County
- — inherits STATE
- City
- — inherits STATE
ZIP-level market 77009
- Rents YoY
- 0.8%
- Active inventory
- 595
- Price-to-rent
- 28.2×
Monthly cashflow live
- Estimated rent
- $3,630 medium interval (Pro) →
- Mortgage (P&I)
- −$2,145
- Tax from tax record
- −$509 /mo · $6,103/yr
- Insurance
- −$170
- HOA
- −$0
- Vacancy / Maint / Mgmt
- −$762
- Net cashflow
- $44
Break-even live
3-unit breakdown (identical units grouped — click to expand)
| Units | Beds | Baths | Est. rent |
|---|---|---|---|
| 3× units | 2 | 1 | $3,630 |
| #1 | 2 | 1 | $1,210 |
| #2 | 2 | 1 | $1,210 |
| #3 | 2 | 1 | $1,210 |
| Total (3 units) | $3,630 | ||
UW: 25.0% down · 7.5% · 30yr · 1.5% tax · 5.0% vac · 8.0% maint · 8.0% mgmt
Financing live
Cash to close
- Down payment
- $102,250
- Closing costs
- $12,270
- Reserves months
- —
- Total cash needed
- —
Loan-product check · same deal, 3 products live
Conventional
25% down · 7.5% · 30yr
- Down + closing
- —
- Monthly P&I
- —
- Monthly cashflow
- —
- DSCR
- —
- Eligible?
- —
Personal DTI + credit; lowest rate.
DSCR
20% down · 8.5% · 30yr
- Down + closing
- —
- Monthly P&I
- —
- Monthly cashflow
- —
- DSCR
- —
- Eligible?
- —
No personal income docs; deal must DSCR.
Hard money
10% down · 12.0% · 12mo
- Down + closing
- —
- Monthly P&I
- —
- Monthly cashflow
- —
- DSCR
- —
- Eligible?
- —
Short-term bridge; refi at stabilization.
Rent comps 40 comps
| Address | Beds | Baths | Sqft | Rent | $/sqft | DOM | Units | Dist |
|---|---|---|---|---|---|---|---|---|
| 1514 Everett St Houston, TX | 2.0 | 1.0 | 970 | $1,840 | $1.90 | 19d | 1 | 0.06mi |
| 1625 N Main St Houston, TX | 3.0 | 1.0–3.0 | 994 | $2,007 | $2.02 | 3d | 42 | 0.13mi |
| 1725 N Main St Houston, TX | 2.0 | 2.0 | 988 | $2,263 | $2.29 | 43d | 1 | 0.20mi |
| 1250 Leona St Houston, TX | 2.0 | 1.0–2.0 | 885 | $1,990 | $2.25 | 1d | 16 | 0.28mi |
| 1550 Leona St Unit 1587 Houston, TX | 2.0 | 2.0 | 1131 | $1,942 | $1.72 | 43d | 1 | 0.36mi |
| 410 James St Unit 1031793P Houston, TX | 3.0 | 2.0 | 1593 | $7,554 | $4.74 | 15d | 1 | 0.36mi |
| 410 James St Houston, TX | 3.0 | 2.0 | 1602 | $6,750 | $4.21 | 43d | 1 | 0.36mi |
| 200 Hogan St Houston, TX | 2.0 | 2.0 | 1058 | $1,904 | $1.80 | 11d | 1 | 0.40mi |
| 2016 N Main St Houston, TX | 2.0 | 2.0 | 1169 | $2,200 | $1.88 | 43d | 1 | 0.40mi |
| 1550 Leona St Houston, TX | 1.0–2.0 | 1.0–2.0 | 835 | $1,905 | $2.28 | 1d | 19 | 0.40mi |
| 412 Paschall St Unit 1316398P Houston, TX | 3.0 | 2.0 | 1130 | $4,840 | $4.28 | 12d | 1 | 0.44mi |
| 1556 Leona St Houston, TX | 1.0 | 1.0 | 905 | $1,505 | $1.66 | 43d | 1 | 0.46mi |
| 6 N Main St Houston, TX | 2.0 | 2.0 | 1248 | $2,453 | $1.97 | 20d | 1 | 0.49mi |
| 6 N Main St Houston, TX | 2.0 | 2.0 | 1248 | $2,453 | $1.97 | 43d | 1 | 0.49mi |
| 711 William St Houston, TX | 1.0 | 1.0 | 1340 | $2,250 | $1.68 | 43d | 1 | 0.51mi |
| 711 William St Houston, TX | 1.0 | 1.0 | 960 | $1,700 | $1.77 | 17d | 1 | 0.51mi |
| 2310 N Main St Houston, TX | 2.0 | 2.0 | 997 | $1,687 | $1.69 | 43d | 1 | 0.64mi |
| 915 Franklin St Unit ID51118 Houston, TX | 2.0 | 2.0 | 1342 | $2,000 | $1.49 | 43d | 1 | 0.64mi |
| 915 Franklin St Unit 312202 Houston, TX | 2.0 | 2.0 | 1398 | $1,987 | $1.42 | 43d | 1 | 0.64mi |
| 915 Franklin St Unit 3-324 Houston, TX | 2.0 | 2.0 | 1158 | $2,498 | $2.16 | 43d | 1 | 0.64mi |
| 915 Franklin St Unit 1-349 Houston, TX | 1.0 | 1.0 | 950 | $1,785 | $1.88 | 43d | 1 | 0.64mi |
| 650 McKee St Apt 422 Houston, TX | 2.0 | 2.0 | 966 | $1,690 | $1.75 | 7d | 1 | 0.66mi |
| 650 McKee St Unit 3112 Houston, TX | 3.0 | 2.0 | 1136 | $2,082 | $1.83 | 2d | 1 | 0.66mi |
| 650 McKee St Unit 3174 Houston, TX | 3.0 | 2.0 | 1136 | $2,114 | $1.86 | 10d | 1 | 0.66mi |
| 650 McKee St Unit 687 Houston, TX | 2.0 | 2.0 | 966 | $1,715 | $1.78 | 43d | 1 | 0.66mi |
| 650 McKee St Unit 683 Houston, TX | 3.0 | 2.0 | 1136 | $2,125 | $1.87 | 43d | 1 | 0.66mi |
| 650 McKee St Unit 2174 Houston, TX | 2.0 | 2.0 | 966 | $1,714 | $1.77 | 10d | 1 | 0.66mi |
| 650 McKee St Unit 424 Houston, TX | 2.0 | 2.0 | 966 | $1,690 | $1.75 | 5d | 1 | 0.66mi |
| 650 McKee St Unit 2148 Houston, TX | 2.0 | 2.0 | 966 | $1,682 | $1.74 | 2d | 1 | 0.66mi |
| 650 McKee St Apt 425 Houston, TX | 2.0 | 2.0 | 966 | $1,725 | $1.79 | 4d | 1 | 0.66mi |
| 201 Main St Unit 12258 Houston, TX | 2.0 | 2.0 | 1308 | $2,250 | $1.72 | 43d | 1 | 0.70mi |
| 201 Main St Unit 10225 Houston, TX | 1.0 | 1.0 | 910 | $1,458 | $1.60 | 43d | 1 | 0.70mi |
| 414 Milam St Unit B1-2003 Houston, TX | 2.0 | 2.0 | 1585 | $4,513 | $2.85 | 43d | 1 | 0.77mi |
| 414 Milam St Houston, TX | 2.0 | 2.5 | 1585 | $3,845 | $2.43 | 21d | 1 | 0.77mi |
| 414 Milam St Unit A3-2805 Houston, TX | 1.0 | 1.0 | 1023 | $3,235 | $3.16 | 43d | 1 | 0.77mi |
| 207 Carl St Houston, TX | 2.0 | 2.0 | 1230 | $2,250 | $1.83 | 43d | 1 | 0.78mi |
| 414 Milam St Unit 2162 Houston, TX | 2.0 | 2.0 | 1585 | $3,833 | $2.42 | 5d | 1 | 0.79mi |
| 414 Milam St Unit 2148 Houston, TX | 2.0 | 2.0 | 1585 | $3,825 | $2.41 | 2d | 1 | 0.79mi |
| 414 Milam St Unit 2165 Houston, TX | 2.0 | 2.0 | 1585 | $3,868 | $2.44 | 4d | 1 | 0.79mi |
| 414 Milam St Unit 437 Houston, TX | 2.0 | 2.0 | 1585 | $3,857 | $2.43 | 10d | 1 | 0.79mi |
Listing history 15 events
-
2026-06-18days on market $409,000 Active 50 DOM
-
2026-06-17days on market $409,000 Active 49 DOM
-
2026-06-16days on market $409,000 Active 48 DOM
-
2026-06-15days on market $409,000 Active 47 DOM
-
2026-06-13days on market $409,000 Active 45 DOM
-
2026-06-10days on market $409,000 Active 41 DOM
-
2026-06-08days on market $409,000 Active 40 DOM
-
2026-06-07days on market $409,000 Active 39 DOM
-
2026-06-04days on market $409,000 Active 36 DOM
-
2026-06-01days on market $409,000 Active 33 DOM
-
2026-05-31days on market $409,000 Active 32 DOM
-
2026-04-29$409,000 Active 851-char remark
-
2007-11-21soldstatus
-
2002-08-02soldstatus
-
1997-12-15soldstatus
ⓘ Source: listings_history table (triggers on properties + properties_extension) + one-shot
backfill from property_details.listing_events for pre-trigger history.
Tax reassessment forecast TX · Resets to sale price
- Current annual tax
- $6,103 · $509/mo
- Projected year-2 tax
- $7,485 · $624/mo
- Expected delta
- +$1,381/yr (+$115/mo · 22.6%)
ⓘ Screening estimate from a state-policy table — verify with the county assessor before closing.
Climate risk First Street
- Flood 4/10 Moderate FEMA zone X (unshaded) · 22% chance over 30 yrs
- Wildfire 1/10 Low
- Heat 9/10 Extreme 7 d/yr ≥109°F today · 24 d/yr by 30 yrs out
- Wind 9/10 Extreme 99% chance of damaging wind over 30 yrs
- Air quality 3/10 Moderate 2 unhealthy d/yr today · 3 by 30 yrs out
Nearby sold comps map
Loading sold comps map…
Walkable amenities ~0.75 mi
Loading nearby amenities…
Taxation est. · year 1
- Rental income
- $43,560
- − Mortgage interest
- −$22,910
- − Property taxes
- −$6,103
- − Insurance
- −$2,045
- − Repairs & maintenance
- −$3,485
- − Management
- −$3,485
- − Depreciation
- −$11,898
- Taxable loss
- −$6,366
- Est. tax savings @ 24.0%
- +$1,528
- After-tax cash flow
- $2,054/yr
For passive investors: Depreciation is non-cash, so a rental often shows a tax loss while cash-flowing — sheltering income. Rental losses are passive: they offset passive income freely, and up to $25,000/yr can offset ordinary (W-2) income if you actively participate and your MAGI is under $100k (phasing out to $0 by $150k); unused losses carry forward. On sale, claimed depreciation is recaptured at up to 25%, and gains may owe capital-gains tax (a 1031 exchange can defer both). Figures are a year-1 estimate at your 24.0% rate — not tax advice; consult a CPA.
Schools (NCES district)
- District
- Houston ISD
- NCES district ID
- 4823640
- Math proficiency
- 27% ▼ -18.00%
- Reading proficiency
- 35% ▼ -6.00%
- Median HH income
- $46,054
- Composite
- 26.63/100
- National rank
- #7173
- State rank
- #593 of 826 in TX
Livability — Houston
- Score
- 74/100
- State rank
- #184
- US rank
- #4771
Category grades
Schools grade is shown separately in the Schools card above.
Census & demographics
- Census place
- Houston, TX
- County
- Harris County · 4,702,590 people
- City population
- 3,226,434
- Metro
- Houston-The Woodlands-Sugar Land, TX
- Population (ZIP)
- 35,769
- Household income
- $83,148
- Rent vs Own
- Severe rent burden
- 994.0
Population outlook (Harris County) Hauer SSP2
- Today (2025)
- 5,571,493 people
- By 2030
- 6,089,821 · +9.3%
- By 2040
- 7,142,806 · +28.2%
- By 2050
- 8,185,864 · +46.9%
- By 2075
- 10,574,329 · +89.8%
- By 2100
- 12,109,958 · +117.4%
Race, ethnicity, and origin ACS 2023
- Neighborhood character
- Diverse neighborhood (Simpson 0.60)
- Race & ethnicity
- Hispanic / Latino 53% White 33% Two or more races 22% Black 8% Asian 3%
- Hispanic origin (detail)
- Mexican 46%
- Common ancestry
- Italian 2% Lithuanian 2% Slovak 1%
- Foreign-born
- 20% · Canada
- Languages at home
- 55% English-only · Spanish 40% Other Indo-European 2% Other Asian/Pacific 1%
Political lean MEDSL · Harris
- 2024 margin
- Lean D (+5.5) · D 52.0% · R 46.4% · Other 1.6%
- 2008→2024 swing
- +3.9pp toward D · 2008: 1.6pp · 2024: 5.5pp
- All cycles
- 2024: D+5.5 2020: D+13.3 2016: D+12.4 2012: D+0.1 2008: D+1.6
Not yet ingested
- Civics
- —
Market trends
- HPI YoY
- ▼ -533.57%
- Current HPI
- 219.5037
- Rent YoY
- ▲ 0.84%
- Metro
- Houston-The Woodlands-Sugar Land, TX
- State GDP YoY
- ▲ 3.95%
- F500 in state
- 110
Industry mix (Fortune 500 HQ in TX)
| Industry | F500 HQs | Revenue |
|---|---|---|
| Energy | 16 | $1,198B |
|
||
| Technology | 5 | $198B |
|
||
| Engineering / Construction | 4 | $72B |
|
||
| Energy Services | 3 | $60B |
|
||
| Utilities | 3 | $41B |
|
||
| Healthcare | 2 | $330B |
|
||
Price history
4 events — show timeline
- 2026-04-29 Listed $409,000 HARMLS
- 2007-11-21 Sold (Public Records) — Public Records
- 2002-08-02 Sold (Public Records) — Public Records
- 1997-12-15 Sold (Public Records) — Public Records
Property tax history
+5.1%/yrLatest (2025): $6,103 · +2.0% YoY. Source: county tax records.
Cash-flow waterfall
monthlySold comps — $/sqft
last 12 mo · ≤1 miLoading sold comps…