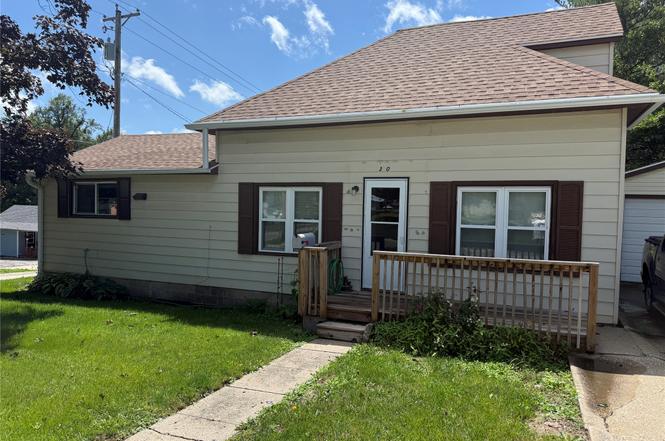
300 N Fillmore St · Osceola, IA
Flood risk 1/10 · Minimal
- FEMA flood zone
- X (unshaded)
- Chance of flooding over 30 yrs
- 0.0%
- Est. flood insurance / yr
- $507 – $1,088
Fire risk 3/10 · Minor
- Est. fire insurance / yr
- $902 – $1,676
Heat risk 3/10 · Minor
- Hot days now (above 104°F)
- 7 days/yr
- Hot days in 30 yrs
- 15 days/yr
Wind risk 2/10 · Minimal
- Chance of severe wind over 30 yrs
- —
Air-quality risk 2/10 · Minimal
- Unhealthy air days now
- 0 days/yr
- Unhealthy air days in 30 yrs
- 1 days/yr
Risk factors via First Street. Map © Google.
Why this score? — see what drove the C- grade
The composite is a weighted blend of 9 inputs, each scored 0–100. Each bar is that input's sub-score; the figure is the points it added to the 100-point composite (weight × sub-score).
- Cash flow +13.6/30.0
- ARV discount +10.2/15.0
- Appreciation +10.0/10.0
- Schools +4.4/10.0
- DSCR +4.1/10.0
- Livability +3.7/5.0
- 1% rule +3.1/10.0
- Rent growth +2.5/5.0
- Condition / age +2.5/5.0
$146,850
🖨 Deal sheet 📄 Offer letter ✓ Due diligence
Listing remarks MLS
Super sweet 3 Bedroom with bonus space! Counter's galore in this oversized galley style kitchen with outside access for your grill! New front deck, one full bath down and 1/2 bath up, dining room, large living room, detached garage, original hardwood floors and trim in upper level, main level laundry and cute back yard! Permanent siding, paved driveway, corner lot in a convenient location!
Key facts
- 5,183 sq ft lot
- Garage
- Built 1920
Property features AI
Exterior
- Parking: Detached one-car garage
- Utilities: Public water; Public sewer
- Home design: Single-story home; Resale property
- Construction: Metal siding; Asphalt shingle roof; Crawl space foundation; Built with residential zoning
- Exterior features: Rectangular lot; Concrete road access
Interior
- Kitchen: Dishwasher; Microwave; Refrigerator; Stove
- Bedrooms: 2 main-level bedrooms
- Bathrooms: 1 full bathroom; 1 half bathroom
- Interior features: Cable TV
- Laundry & utility: Washer; Dryer; Laundry on main level
Heating & cooling
- Heating & cooling: Forced air heating (natural gas); Central air conditioning
Neighborhood map
What this means for you Summary
Snapshot
- This is a 3-bed/1.0-bath single-family listed at $147k.
Deal economics
- At list price, monthly cash flow is $8 ($100/yr) — positive.
- The deal already cash-flows at list — no discount required.
- To meet the 1% rule (rent ≥ 1% of price), the offer needs to be $118k (19.3% below list).
- Recommended offer: $118k (19.3% below list) — sets the bar for 1% rule.
- Cap rate 6.4% vs local median 4.2% in Osceola — top-decile yield for the area; either an underpriced asset or a hidden risk that comps aren't pricing in. Stress-test before assuming the spread holds.
Location & tenants
- Location reads 74/100 on livability (#253 in IA, #4,874 nationally) — a middle-class / working-renter tenant base. Strengths: cost of living A+, housing A+, health & safety A-; Watch: amenities F, commute F.
- Clarke Community School District (town): math 47% / reading 58% proficiency, ranked #275 of 289 in IA (top 95%) — acceptable for families but not a draw, mixed tenant base, ~2y average lease.
- Market conditions: 52 active listings in the ZIP; 4 comparable units currently listed for rent nearby; rentals leasing fast (median 3d on market — plan ~1-2 weeks tenant-placement turnaround); 125 units permitted in Clarke County in 2024 (0 in 5+ unit buildings).
Forward outlook
- In year one you build about $16k of equity ($1k loan paydown + $15k appreciation (10.0% local appreciation)).
- At projected returns (10.0% appreciation + 3.0% rent growth), your $41k cash investment doubles in ~3 years — after that, you're playing with house money.
- By year 3, paydown + projected appreciation supports a ~$40k cash-out refi (75% LTV) — recoverable capital for the next deal without selling this one.
Negotiation context
- Only 3 days on market — expect competitive offers; lowballing is unlikely to land.
- 3 sale attempts since 3y ago with the ask held roughly flat each time — persistent listings suggest the price (not the market) is what's stuck; bring a comps-based counter.
- Current owner paid $110k; 33% above their basis — modest negotiation headroom, anchor on the comps not their cost.
Risks & watch-outs
- Watch-outs: built in 1920 — expect roof / HVAC / electrical / plumbing capex.
Questions for the listing agent
- Built in 1920 — when were the roof, HVAC, electrical panel, plumbing, and water heater last replaced?
- Is there a deadline driving the sale (1031 exchange, divorce, estate, relocation)? That informs how much negotiation room exists.
- What's the average days-on-market for RENTAL listings here right now (not sales)? A rising rental-DOM trend means longer vacancies and softer asking-rent achievability than the comps imply.
- What's the recent tenant-quality profile in this submarket — average credit score on applications, eviction rate, late-payment / NSF rate, and stable-employment percentage? A property-management company in the area should have these aggregated.
- How much new for-sale + rental construction is in the pipeline within 1–3 miles? Heavy new supply typically softens prices + rents 12–24 months out; constrained supply supports both.
Investment metrics
- 1% rule
- 0.81% ✗
- Cap rate
- 6.36%
- Cash-on-cash
- 0.24%
- DSCR
- 1.01
- GRM
- 10.3
CMA / ARV
- ARV (on-the-fly)
- $156,240
- Comps found
- 12
Show comp detail 12 sales within ~0.75 mi
| Address | Dist | Beds/Ba | Sqft | Sold | Price | $/sf | Match |
|---|---|---|---|---|---|---|---|
| 215 N Lincoln St | 0.22mi | 3/2.0 | 1,248 (+1%) | 3mo | $260,000 | $208 | 83 |
| 214 N Fillmore St | 0.07mi | 2/1.5 (-1) | 1,238 (-0%) | 9mo | $40,000 | $32 | 82 |
| 128 W Logan St | 0.12mi | 4/2.0 (+1) | 1,320 (+6%) | 7mo | $54,000 | $41 | 69 |
| 301 E Washington St | 0.38mi | 3/2.0 | 1,201 (-3%) | 7mo | $114,500 | $95 | 67 |
| 425 E Ayers St | 0.48mi | 3/1.0 | 1,136 (-8%) | 3mo | $187,500 | $165 | 62 |
| 114 W Ayers St | 0.09mi | 2/2.0 (-1) | 1,092 (-12%) | 8mo | $155,000 | $142 | 60 |
| 205 N Park St | 0.24mi | 3/2.0 | 1,390 (+12%) | 9mo | $175,000 | $126 | 57 |
| 321 S Ridge Rd | 0.75mi | 2/1.5 (-1) | 1,232 (-1%) | 6mo | $150,000 | $122 | 52 |
| 602 S Fillmore St | 0.67mi | 2/1.0 (-1) | 1,078 (-13%) | 1mo | $100,000 | $93 | 42 |
| 707 S Fillmore St | 0.74mi | 3/2.0 | 1,350 (+9%) | 7mo | $158,000 | $117 | 41 |
| 110 N Osceola St | 0.62mi | 2/3.0 (-1) | 1,077 (-13%) | 0mo | $219,000 | $203 | 36 |
| 419 E Grant St | 0.72mi | 2/1.0 (-1) | 1,080 (-13%) | 7mo | $171,000 | $158 | 34 |
Match score weights: distance 35% · size 25% · config 20% · recency 20%. Top-matched comps best support the ARV.
Projected returns pro-forma
9.99% appreciation · 3.0% rent growth · sell at horizon
- IRR
- 24.4%
- Equity multiple
- 2.96×
- Total profit
- $80,414
- Equity at exit
- $132,229
- IRR
- 21.6%
- Equity multiple
- 6.75×
- Total profit
- $236,300
- Equity at exit
- $285,086
Cash invested: $41,118 (down + closing). Projections, not guarantees.
Landlord ↔ Tenant lean methodology
- Overall (STATE)
- 83 Strongly Landlord-Friendly
- State Iowa
- 83 Strongly Landlord-Friendly · R+6
- County
- — inherits STATE
- City
- — inherits STATE
ZIP-level market 50213
- Home prices YoY
- 4.8%
- Active inventory
- 52
- Price-to-rent
- 10.3×
Monthly cashflow live
- Estimated rent
- $1,185 medium interval (Pro) →
- Mortgage (P&I)
- −$770
- Tax from tax record
- −$96 /mo · $1,156/yr
- Insurance
- −$61
- HOA
- −$0
- Vacancy / Maint / Mgmt
- −$249
- Net cashflow
- $8
Break-even live
UW: 25.0% down · 7.5% · 30yr · 1.5% tax · 5.0% vac · 8.0% maint · 8.0% mgmt
Financing live
Cash to close
- Down payment
- $36,712
- Closing costs
- $4,406
- Reserves months
- —
- Total cash needed
- —
Loan-product check · same deal, 3 products live
Conventional
25% down · 7.5% · 30yr
- Down + closing
- —
- Monthly P&I
- —
- Monthly cashflow
- —
- DSCR
- —
- Eligible?
- —
Personal DTI + credit; lowest rate.
DSCR
20% down · 8.5% · 30yr
- Down + closing
- —
- Monthly P&I
- —
- Monthly cashflow
- —
- DSCR
- —
- Eligible?
- —
No personal income docs; deal must DSCR.
Hard money
10% down · 12.0% · 12mo
- Down + closing
- —
- Monthly P&I
- —
- Monthly cashflow
- —
- DSCR
- —
- Eligible?
- —
Short-term bridge; refi at stabilization.
Rent comps 4 comps
| Address | Beds | Baths | Sqft | Rent | $/sqft | DOM | Units | Dist |
|---|---|---|---|---|---|---|---|---|
| 113 W Clay St #2 Osceola, IA | 2.0 | 1.0 | 1008 | $995 | $0.99 | 19d | 1 | 0.06mi |
| 422 S Gustin Unit 1 Osceola, IA | 2.0 | 1.0 | 750 | $300 | $0.40 | 2d | 1 | 0.76mi |
| 332 Wildflower Dr Osceola, IA | 3.0 | 2.0 | 1240 | $1,235 | $1.00 | 2d | 3 | 1.33mi |
| 502 Wildflower Dr Osceola, IA | 3.0 | 1.0–2.0 | 1098 | $1,152 | $1.05 | 2d | 8 | 1.36mi |
Listing history 3 events
-
2026-06-18days on market $146,850 Active 3 DOM
-
2026-06-17days on market $146,850 Active 2 DOM
-
2026-06-15$146,850 Active 1 DOM
ⓘ Source: listings_history table (triggers on properties + properties_extension) + one-shot
backfill from property_details.listing_events for pre-trigger history.
Tax reassessment forecast IA · Partial reset (capped growth)
- Current annual tax
- $1,156 · $96/mo
- Projected year-2 tax
- $1,731 · $144/mo
- Expected delta
- +$575/yr (+$48/mo · 49.7%)
ⓘ Screening estimate from a state-policy table — verify with the county assessor before closing.
Climate risk First Street
- Flood 1/10 Low FEMA zone X (unshaded) · 0% chance over 30 yrs
- Wildfire 3/10 Moderate
- Heat 3/10 Moderate 7 d/yr ≥104°F today · 15 d/yr by 30 yrs out
- Wind 2/10 Low
- Air quality 2/10 Low 0 unhealthy d/yr today · 1 by 30 yrs out
Nearby sold comps map
Loading sold comps map…
Walkable amenities ~0.75 mi
Loading nearby amenities…
Taxation est. · year 1
- Rental income
- $14,218
- − Mortgage interest
- −$8,226
- − Property taxes
- −$1,156
- − Insurance
- −$734
- − Repairs & maintenance
- −$1,137
- − Management
- −$1,137
- − Depreciation
- −$4,272
- Taxable loss
- −$2,445
- Est. tax savings @ 24.0%
- +$587
- After-tax cash flow
- $687/yr
For passive investors: Depreciation is non-cash, so a rental often shows a tax loss while cash-flowing — sheltering income. Rental losses are passive: they offset passive income freely, and up to $25,000/yr can offset ordinary (W-2) income if you actively participate and your MAGI is under $100k (phasing out to $0 by $150k); unused losses carry forward. On sale, claimed depreciation is recaptured at up to 25%, and gains may owe capital-gains tax (a 1031 exchange can defer both). Figures are a year-1 estimate at your 24.0% rate — not tax advice; consult a CPA.
Schools (NCES district)
- District
- Clarke Community School District
- NCES district ID
- 1907410
- Math proficiency
- 47% ▼ -8.00%
- Reading proficiency
- 58% ▲ 1.00%
- Median HH income
- $44,866
- Composite
- 44.33/100
- National rank
- #2825
- State rank
- #275 of 289 in IA
Livability — Osceola
- Score
- 74/100
- State rank
- #253
- US rank
- #4874
Category grades
Schools grade is shown separately in the Schools card above.
Census & demographics
- Census place
- Osceola, IA
- County
- Clarke County · 7,489 people
- City population
- 7,489
- Metro
- nan
- Population (ZIP)
- 7,489
- Household income
- $73,026
- Rent vs Own
- Severe rent burden
- 102.0
Population outlook (Clarke County) Hauer SSP2
- Today (2025)
- 9,307 people
- By 2030
- 9,294 · -0.1%
- By 2040
- 9,259 · -0.5%
- By 2050
- 9,345 · +0.4%
- By 2075
- 10,219 · +9.8%
- By 2100
- 11,526 · +23.8%
Race, ethnicity, and origin ACS 2023
- Neighborhood character
- Predominantly White (74%)
- Race & ethnicity
- White 74% Hispanic / Latino 20% Two or more races 8%
- Hispanic origin (detail)
- Mexican 19%
- Common ancestry
- Portuguese 2% Iranian 2% Lithuanian 2%
- Foreign-born
- 7% · Canada, Jamaica
- Languages at home
- 86% English-only · Spanish 13% Other Asian/Pacific 1%
Political lean MEDSL · Clarke
- 2024 margin
- Solid R (+42.0) · D 28.4% · R 70.4% · Other 1.2%
- 2008→2024 swing
- -44.3pp toward R · 2008: 2.2pp · 2024: -42.0pp
- All cycles
- 2024: R+42.0 2020: R+35.9 2016: R+28.2 2012: D+1.4 2008: D+2.2
Not yet ingested
- Civics
- —
Market trends
- HPI YoY
- ▲ 9.99%
- Current HPI
- 216.6704
- Rent YoY
- —
- Metro
- nan
- State GDP YoY
- ▲ 2.48%
- F500 in state
- 4
Industry mix (Fortune 500 HQ in IA)
| Industry | F500 HQs | Revenue |
|---|---|---|
| Financial Services | 1 | $16B |
|
||
| Retail / Convenience | 1 | $15B |
|
||
Price history
+607.7% since first listed11 events — show timeline
- 2026-06-15 Listed $146,850 DMMLS
- 2023-08-03 Listing Removed — DMMLS
- 2023-08-03 Listed $110,500 DMMLS
- 2023-05-30 Sold (Public Records) $110,500 Public Records
- 2023-05-30 Sold (MLS) $110,500 IAR
- 2023-03-30 Pending — IAR
- 2023-03-14 Price Changed $109,500 IAR
- 2023-02-17 Price Changed $112,500 IAR
- 2023-01-19 Price Changed $119,000 IAR
- 2023-01-12 Listed $124,900 IAR
- 1977-04-23 Sold (Public Records) $20,750 Public Records
Property tax history
+2.2%/yrLatest (2025): $1,156 · -0.3% YoY. Source: county tax records.
Cash-flow waterfall
monthlySold comps — $/sqft
last 12 mo · ≤1 miLoading sold comps…