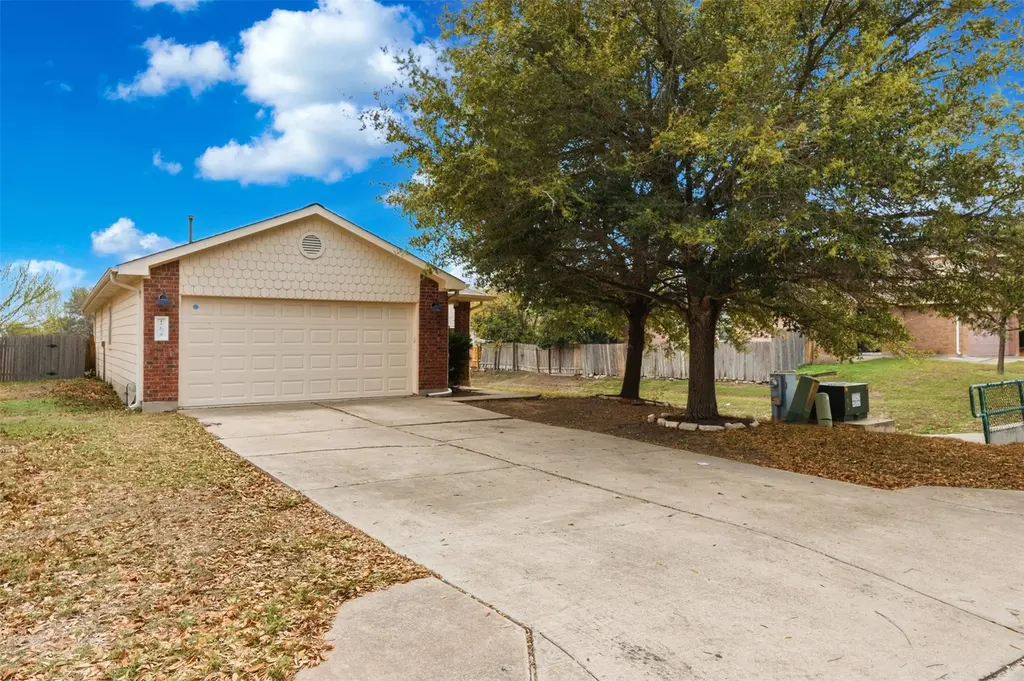
164 Opal Lake Dr · Kyle, TX
Flood risk 1/10 · Minimal
- FEMA flood zone
- X (unshaded)
- Chance of flooding over 30 yrs
- 0.0%
- Est. flood insurance / yr
- $507 – $1,088
Fire risk 4/10 · Minor
- Est. fire insurance / yr
- $1,222 – $2,270
Heat risk 8/10 · Major
- Hot days now (above 108°F)
- 7 days/yr
- Hot days in 30 yrs
- 22 days/yr
Wind risk 8/10 · Major
- Chance of severe wind over 30 yrs
- 80.0%
Air-quality risk 1/10 · Minimal
- Unhealthy air days now
- 0 days/yr
- Unhealthy air days in 30 yrs
- 0 days/yr
Risk factors via First Street. Map © Google.
Why this score? — see what drove the D- grade
The composite is a weighted blend of 9 inputs, each scored 0–100. Each bar is that input's sub-score; the figure is the points it added to the 100-point composite (weight × sub-score).
- ARV discount +15.0/15.0
- Cash flow +7.4/30.0
- Livability +3.8/5.0
- Schools +3.5/10.0
- 1% rule +3.3/10.0
- Condition / age +2.5/5.0
- Rent growth +2.4/5.0
- DSCR +1.6/10.0
- Appreciation +0.0/10.0
$216,000
🖨 Deal sheet 📄 Offer letter ✓ Due diligence
Listing remarks MLS
Short Sale - Subject to Lender Approval. Well maintained single story home in Kyle, TX offering privacy, comfort, and a convenient location. Located in the Southlake Ranch community, this property offers single story living with bright, open spaces and thoughtful updates throughout. Inside, the home features no carpet and laminate plank flooring, creating a clean and modern feel that is both stylish and easy to maintain. The main living area is filled with natural light and includes architectural details such as tray ceilings, crown molding, and updated light fixtures, giving the space added character and warmth. The kitchen with stainless steel appliances is designed for both everyday functionality and entertaining, complete with a gas stove, generous cabinetry, and a comfortable eat in kitchen layout that connects seamlessly with the living area. The primary suite offers a relaxing retreat with a walk in closet and a private ensuite bathroom with tub and shower combo. Additional bedrooms provide flexible space for a home office, guest room, or hobby area. Outdoor living continues with a covered back patio and extended deck, creating the perfect space for relaxing or hosting gatherings. The privacy fenced backyard enjoys the added benefit of no back neighbors and no side neighbors, offering a level of privacy that is difficult to find. Recent improvements include a roof replaced in 2022, double pane windows, installed gutters, and a garage door opener upgrade, providing added value and long term peace of mind. Conveniently located with easy access to I 35, the home offers a smooth commute while being close to shopping, dining, and local restaurants, with Downtown Austin reachable in about 35 minutes.
Key facts
- No carpet
- Single story home
- Natural light
Tags
Neighborhood map
What this means for you Summary
Snapshot
- This is a 3-bed/2.0-bath single-family listed at $216k.
Deal economics
- At list price, monthly cash flow is $-275 ($-3k/yr) — negative.
- To cash-flow at today's rent, offer at most $167k (22.5% below list).
- To meet the 1% rule (rent ≥ 1% of price), the offer needs to be $179k (16.9% below list).
- Recommended offer: $167k (22.5% below list) — sets the bar for cash-flow.
- Cap rate 4.8% vs local median 3.3% in Kyle — top-decile yield for the area; either an underpriced asset or a hidden risk that comps aren't pricing in. Stress-test before assuming the spread holds.
Location & tenants
- Location reads 75/100 on livability (#138 in TX, #3,993 nationally) — a middle-class / working-renter tenant base. Strengths: housing A+, health & safety A+, employment A; Watch: schools D, amenities F, commute F.
- Hays CISD (rural): math 35% / reading 41% proficiency, ranked #390 of 826 in TX (top 47%) — families likely to look elsewhere, expect single-tenant / working-renter base with shorter leases.
- Market conditions: Rents soft (-0.3%/yr); 1801 active listings in the ZIP; 27 comparable units currently listed for rent nearby; rentals at typical pace (median 18d on market — plan ~3-4 weeks tenant-placement turnaround); solid renter incomes; 5,270 units permitted in Hays County in 2024 (1,464 in 5+ unit buildings).
Forward outlook
- Local home prices are declining (-3.0%/yr); year-one equity from $1k of loan paydown is wiped out by about $6k of value loss. Plan a longer hold.
- Hays County population projected at +93% by 2050 — long-run rental-demand tailwind backs the buy-and-hold thesis.
Negotiation context
- It's been on market 98 days — a 9% lower offer ($197k) is reasonable based on typical stale-listing flexibility.
- 18 sale attempts since 17y ago with the ask held roughly flat each time — persistent listings suggest the price (not the market) is what's stuck; bring a comps-based counter.
- Current owner paid $92k; list at $216k implies a 134% gain — meaningful room to come down on a strong offer.
Risks & watch-outs
- Watch-outs: property tax is 2.5% of price.
- Climate carrying-cost: severe wind risk, 80% chance of damaging wind over 30y; extreme-heat days projected 7→22/yr by 2055 (HVAC capex compounding) — expect insurance premiums to compound above CPI over the hold.
Questions for the listing agent
- What do current leases actually rent for vs. the listed asking? Can we see a recent rent roll and the last 12 months of T-12 income?
- It's been on market 98 days. Have you received any prior offers? Is the seller open to a 22% concession, seller financing, or rate buy-down credit?
- Property tax is high relative to price — has the assessment been appealed recently, and will the sale trigger a re-assessment?
- What does the HOA fee cover, when was the last increase, and are there any pending special assessments or reserve-fund shortfalls?
- Why hasn't it sold? Are there any deal-killer items the seller is aware of (foundation, flood, title, zoning, code violations)?
- Is there a deadline driving the sale (1031 exchange, divorce, estate, relocation)? That informs how much negotiation room exists.
- Schools are D-rated, which usually means shorter tenancies and higher turnover. Who's the typical renter profile here, and what's been the actual vacancy rate?
- The area grade is low — what's the realistic commute time and amenity access for the typical tenant pool here? Any planned neighborhood developments (good or bad) we should know about?
- What's the average days-on-market for RENTAL listings here right now (not sales)? A rising rental-DOM trend means longer vacancies and softer asking-rent achievability than the comps imply.
- What's the recent tenant-quality profile in this submarket — average credit score on applications, eviction rate, late-payment / NSF rate, and stable-employment percentage? A property-management company in the area should have these aggregated.
- How much new for-sale + rental construction is in the pipeline within 1–3 miles? Heavy new supply typically softens prices + rents 12–24 months out; constrained supply supports both.
Investment metrics
- 1% rule
- 0.83% ✗
- Cap rate
- 4.77%
- Cash-on-cash
- -5.45%
- DSCR
- 0.76
- GRM
- 10.0
CMA / ARV
- ARV (median comp)
- $286,737
- List price
- $216,000
- Delta
- -24.67%
- Verdict
- UNDERPRICED
- Comps
- 20 within 1.0 mi
Show comp detail 12 sales within ~0.75 mi
| Address | Dist | Beds/Ba | Sqft | Sold | Price | $/sf | Match |
|---|---|---|---|---|---|---|---|
| 109 Onyx Lake Dr | 0.07mi | 3/2.0 | 1,175 (0%) | 6mo | $219,900 | $187 | 92 |
| 125 Sapphire Lake Dr | 0.30mi | 3/2.0 | 1,151 (-2%) | 8mo | $229,900 | $200 | 76 |
| 3013 Winding Creek Rd | 0.54mi | 3/2.0 | 1,191 (+1%) | 3mo | $261,130 | $219 | 70 |
| 3035 Winding Creek Dr | 0.55mi | 3/2.0 | 1,191 (+1%) | 3mo | $257,780 | $216 | 70 |
| 3085 Winding Creek Rd | 0.55mi | 2/2.0 (-1) | 1,105 (-6%) | 1mo | $239,990 | $217 | 58 |
| 340 Spillway Dr | 0.42mi | 3/2.0 | 1,048 (-11%) | 8mo | $210,000 | $200 | 56 |
| 720 Brandi Cir | 0.39mi | 3/2.0 | 1,009 (-14%) | 3mo | $155,000 | $154 | 56 |
| 141 Henke Cv | 0.57mi | 3/2.0 | 1,086 (-8%) | 6mo | $245,000 | $226 | 55 |
| 121 Palestine Trl | 0.59mi | 3/2.0 | 1,291 (+10%) | 4mo | $296,990 | $230 | 53 |
| 2971 Winding Crk | 0.55mi | 3/2.0 | 1,326 (+13%) | 2mo | $270,425 | $204 | 51 |
| 170 Henke Cv | 0.53mi | 3/2.0 | 1,343 (+14%) | 2mo | $239,000 | $178 | 50 |
| 265 Texoma St | 0.58mi | 3/2.0 | 1,325 (+13%) | 4mo | $296,990 | $224 | 48 |
Match score weights: distance 35% · size 25% · config 20% · recency 20%. Top-matched comps best support the ARV.
Projected returns pro-forma
-3.0% appreciation · 0.0% rent growth · sell at horizon
- IRR
- -29.5%
- Equity multiple
- 0.05×
- Total profit
- $-57,619
- Equity at exit
- $32,206
- IRR
- -52.7%
- Equity multiple
- -0.53×
- Total profit
- $-92,431
- Equity at exit
- $18,676
Cash invested: $60,480 (down + closing). Projections, not guarantees.
Landlord ↔ Tenant lean methodology
- Overall (STATE)
- 87 Strongly Landlord-Friendly
- State Texas
- 87 Strongly Landlord-Friendly · R+5
- County
- — inherits STATE
- City
- — inherits STATE
ZIP-level market 78640
- Home prices YoY
- -33.8%
- Rents YoY
- -0.3%
- Active inventory
- 1801
- Price-to-rent
- 10.0×
Monthly cashflow live
- Estimated rent
- $1,794 high interval (Pro) →
- Mortgage (P&I)
- −$1,133
- Tax from tax record
- −$455 /mo · $5,455/yr
- Insurance
- −$90
- HOA
- −$15
- Vacancy / Maint / Mgmt
- −$377
- Net cashflow
- $-275
Break-even live
UW: 25.0% down · 7.5% · 30yr · 1.5% tax · 5.0% vac · 8.0% maint · 8.0% mgmt
Financing live
Cash to close
- Down payment
- $54,000
- Closing costs
- $6,480
- Reserves months
- —
- Total cash needed
- —
Loan-product check · same deal, 3 products live
Conventional
25% down · 7.5% · 30yr
- Down + closing
- —
- Monthly P&I
- —
- Monthly cashflow
- —
- DSCR
- —
- Eligible?
- —
Personal DTI + credit; lowest rate.
DSCR
20% down · 8.5% · 30yr
- Down + closing
- —
- Monthly P&I
- —
- Monthly cashflow
- —
- DSCR
- —
- Eligible?
- —
No personal income docs; deal must DSCR.
Hard money
10% down · 12.0% · 12mo
- Down + closing
- —
- Monthly P&I
- —
- Monthly cashflow
- —
- DSCR
- —
- Eligible?
- —
Short-term bridge; refi at stabilization.
Rent comps 27 comps
| Address | Beds | Baths | Sqft | Rent | $/sqft | DOM | Units | Dist |
|---|---|---|---|---|---|---|---|---|
| 228 Pearl Lake Dr Kyle, TX | 3.0 | 2.0 | 1439 | $1,725 | $1.20 | 24d | 1 | 0.10mi |
| 228 Pearl Lake Dr Kyle, TX | 3.0 | 2.0 | 1439 | $1,725 | $1.20 | 22d | 1 | 0.10mi |
| 289 Lake Washington Dr Kyle, TX | 3.0 | 2.0 | 1389 | $1,699 | $1.22 | 12d | 1 | 0.16mi |
| 205 Mood Lake Dr Kyle, TX | 3.0 | 2.0 | 1419 | $1,595 | $1.12 | 22d | 1 | 0.23mi |
| 205 Mood Lake Dr Kyle, TX | 3.0 | 2.0 | 1419 | $1,595 | $1.12 | 24d | 1 | 0.23mi |
| 109 Granite Shoals Dr Kyle, TX | 3.0 | 2.0 | 1304 | $1,700 | $1.30 | 4d | 1 | 0.25mi |
| 931 Brandi Cir Kyle, TX | 3.0 | 2.0 | 1343 | $1,750 | $1.30 | 4d | 1 | 0.55mi |
| 196 Fabion St Kyle, TX | 3.0 | 2.0 | 1326 | $1,850 | $1.40 | 24d | 1 | 0.61mi |
| 164 Fabion St Kyle, TX | 3.0 | 2.0 | 1437 | $1,799 | $1.25 | 15d | 1 | 0.63mi |
| 1310 Goforth Rd Kyle, TX | 2.0 | 2.0 | 1163 | $1,850 | $1.59 | 4d | 1 | 0.64mi |
| 117 Keltic Dr Kyle, TX | 3.0 | 2.0 | 1437 | $1,850 | $1.29 | 17d | 1 | 0.83mi |
| 314 Paddington Dr Kyle, TX | 3.0 | 2.0 | 1364 | $1,799 | $1.32 | 17d | 1 | 0.85mi |
| 315 Nottingham Loop Kyle, TX | 3.0 | 2.0 | 1336 | $1,800 | $1.35 | 11d | 1 | 1.03mi |
| 21393 Interstate 35 Kyle, TX | 1.0–3.0 | 1.0–2.0 | 969 | $1,471 | $1.52 | 4d | 7 | 1.19mi |
| 211 Wild Buffalo Dr Kyle, TX | 3.0 | 2.0 | 1180 | $1,595 | $1.35 | 16d | 1 | 1.21mi |
| 211 Wild Buffalo Dr Kyle, TX | 3.0 | 2.0 | 1180 | $1,595 | $1.35 | 17d | 1 | 1.21mi |
| 211 Wild Buffalo Dr Kyle, TX | 3.0 | 2.0 | 1180 | $1,595 | $1.35 | 24d | 1 | 1.21mi |
| 828 Bebee Rd Kyle, TX | 1.0–2.0 | 1.0–2.0 | 768 | $1,418 | $1.85 | 2d | 57 | 1.23mi |
| 140 Llama Loop Kyle, TX | 3.0 | 2.0 | 1335 | $1,695 | $1.27 | 43d | 1 | 1.23mi |
| 351 Zebra Dr Kyle, TX | 3.0 | 2.0 | 1207 | $1,995 | $1.65 | 24d | 1 | 1.25mi |
| 1579 Violet Ln Kyle, TX | 3.0 | 2.5 | 1426 | $1,750 | $1.23 | 24d | 1 | 1.30mi |
| 320 Goll ST Niederwald, TX | 1.0–2.0 | 1.0–2.0 | 1056 | $1,982 | $1.88 | 2d | 87 | 1.35mi |
| 410 Masonwood Dr Kyle, TX | 3.0 | 2.0 | 1341 | $1,797 | $1.34 | 43d | 1 | 1.39mi |
| 1437 Treeta Trl Kyle, TX | 3.0 | 2.0 | 1262 | $1,895 | $1.50 | 43d | 1 | 1.42mi |
| 200 Philomena Dr Kyle, TX | 1.0–3.0 | 1.0–2.0 | 994 | $1,980 | $1.99 | 2d | 24 | 1.44mi |
| 1561 Arbor Knot Dr Kyle, TX | 2.0 | 2.0 | 1195 | $1,750 | $1.46 | 3d | 1 | 1.47mi |
| 1469 Breanna Ln Kyle, TX | 3.0 | 2.0 | 1329 | $1,650 | $1.24 | 17d | 1 | 1.49mi |
HOA detail
- Monthly dues
- $15 · $180/yr
- Likely covers
- gas
Listing history 50 events
-
2026-06-18days on market $216,000 Active 98 DOM
-
2026-06-17days on market $216,000 Active 97 DOM
-
2026-06-16days on market $216,000 Active 96 DOM
-
2026-06-15days on market $216,000 Active 95 DOM
-
2026-06-13days on market $216,000 Active 93 DOM
-
2026-06-09days on market $216,000 Active 89 DOM
-
2026-06-08days on market $216,000 Active 88 DOM
-
2026-06-07days on market $216,000 Active 87 DOM
-
2026-06-05days on market $216,000 Active 84 DOM
-
2026-06-03days on market $216,000 Active 83 DOM
-
2026-06-02days on market $216,000 Active 82 DOM
-
2026-06-01days on market $216,000 Active 81 DOM
-
2026-05-31days on market $216,000 Active 80 DOM
-
2026-03-12$216,000 New 1730-char remark
Show marketing remark (1730 chars)
Short Sale - Subject to Lender Approval. Well maintained single story home in Kyle, TX offering privacy, comfort, and a convenient location. Located in the Southlake Ranch community, this property offers single story living with bright, open spaces and thoughtful updates throughout. Inside, the home features no carpet and laminate plank flooring, creating a clean and modern feel that is both stylish and easy to maintain. The main living area is filled with natural light and includes architectural details such as tray ceilings, crown molding, and updated light fixtures, giving the space added character and warmth. The kitchen with stainless steel appliances is designed for both everyday functionality and entertaining, complete with a gas stove, generous cabinetry, and a comfortable eat in kitchen layout that connects seamlessly with the living area. The primary suite offers a relaxing retreat with a walk in closet and a private ensuite bathroom with tub and shower combo. Additional bedrooms provide flexible space for a home office, guest room, or hobby area. Outdoor living continues with a covered back patio and extended deck, creating the perfect space for relaxing or hosting gatherings. The privacy fenced backyard enjoys the added benefit of no back neighbors and no side neighbors, offering a level of privacy that is difficult to find. Recent improvements include a roof replaced in 2022, double pane windows, installed gutters, and a garage door opener upgrade, providing added value and long term peace of mind. Conveniently located with easy access to I 35, the home offers a smooth commute while being close to shopping, dining, and local restaurants, with Downtown Austin reachable in about 35 minutes.
-
2026-03-12$216,000 Active 1730-char remark
Show marketing remark (1730 chars)
Short Sale - Subject to Lender Approval. Well maintained single story home in Kyle, TX offering privacy, comfort, and a convenient location. Located in the Southlake Ranch community, this property offers single story living with bright, open spaces and thoughtful updates throughout. Inside, the home features no carpet and laminate plank flooring, creating a clean and modern feel that is both stylish and easy to maintain. The main living area is filled with natural light and includes architectural details such as tray ceilings, crown molding, and updated light fixtures, giving the space added character and warmth. The kitchen with stainless steel appliances is designed for both everyday functionality and entertaining, complete with a gas stove, generous cabinetry, and a comfortable eat in kitchen layout that connects seamlessly with the living area. The primary suite offers a relaxing retreat with a walk in closet and a private ensuite bathroom with tub and shower combo. Additional bedrooms provide flexible space for a home office, guest room, or hobby area. Outdoor living continues with a covered back patio and extended deck, creating the perfect space for relaxing or hosting gatherings. The privacy fenced backyard enjoys the added benefit of no back neighbors and no side neighbors, offering a level of privacy that is difficult to find. Recent improvements include a roof replaced in 2022, double pane windows, installed gutters, and a garage door opener upgrade, providing added value and long term peace of mind. Conveniently located with easy access to I 35, the home offers a smooth commute while being close to shopping, dining, and local restaurants, with Downtown Austin reachable in about 35 minutes.
-
2024-07-26historical $1,700
-
2024-07-18$1,700
-
2024-07-18historical $1,700
-
2024-07-14$1,700
-
2024-06-28historical $1,700
-
2024-06-26price $1,700
-
2024-06-20price $1,800
-
2024-05-29$1,850
-
2022-07-29soldstatus
-
2022-07-27soldstatus Closed
-
2022-06-26historical Active Under Contract
-
2022-06-16price $335,000
-
2022-06-01$350,000 Active
-
2013-09-26soldstatus $92,500
-
2013-07-09$90,000
-
2013-03-13historical Withdrawn
-
2013-02-06status Pending - Taking Backups
-
2013-01-30historical Active Contingent
-
2013-01-18status Active
-
2013-01-10historical Active Contingent
-
2013-01-02price
-
2012-12-10price
-
2012-12-07status Active
-
2012-11-16historical Active Contingent
-
2012-09-18Active
-
2012-07-25historical Temporarily Off Market
-
2012-07-02status Active
-
2012-04-11historical Active Contingent
-
2012-03-25status Active
-
2012-02-28historical Active Contingent
-
2012-01-31price
-
2012-01-20status Active
-
2012-01-06historical Active Contingent
-
2011-12-23price
-
2011-12-23status Active
ⓘ Source: listings_history table (triggers on properties + properties_extension) + one-shot
backfill from property_details.listing_events for pre-trigger history.
Tax reassessment forecast TX · Resets to sale price
- Current annual tax
- $5,455 · $455/mo
- Projected year-2 tax
- $5,455 · $455/mo
- Expected delta
- $0/yr ($0/mo · 0.0%)
ⓘ Screening estimate from a state-policy table — verify with the county assessor before closing.
Climate risk First Street
- Flood 1/10 Low FEMA zone X (unshaded) · 0% chance over 30 yrs
- Wildfire 4/10 Moderate
- Heat 8/10 Severe 7 d/yr ≥108°F today · 22 d/yr by 30 yrs out
- Wind 8/10 Severe 80% chance of damaging wind over 30 yrs
- Air quality 1/10 Low 0 unhealthy d/yr today · 0 by 30 yrs out
Nearby sold comps map
Loading sold comps map…
Walkable amenities ~0.75 mi
Loading nearby amenities…
Taxation est. · year 1
- Rental income
- $21,530
- − Mortgage interest
- −$12,099
- − Property taxes
- −$5,455
- − Insurance
- −$1,080
- − Repairs & maintenance
- −$1,722
- − Management
- −$1,722
- − HOA
- −$180
- − Depreciation
- −$6,284
- Taxable loss
- −$7,013
- Est. tax savings @ 24.0%
- +$1,683
- After-tax cash flow
- $-1,616/yr
For passive investors: Depreciation is non-cash, so a rental often shows a tax loss while cash-flowing — sheltering income. Rental losses are passive: they offset passive income freely, and up to $25,000/yr can offset ordinary (W-2) income if you actively participate and your MAGI is under $100k (phasing out to $0 by $150k); unused losses carry forward. On sale, claimed depreciation is recaptured at up to 25%, and gains may owe capital-gains tax (a 1031 exchange can defer both). Figures are a year-1 estimate at your 24.0% rate — not tax advice; consult a CPA.
Schools (NCES district)
- District
- Hays CISD
- NCES district ID
- 4800010
- Math proficiency
- 35% ▼ -15.00%
- Reading proficiency
- 41% ▼ -5.00%
- Median HH income
- $70,570
- Composite
- 34.78/100
- National rank
- #5118
- State rank
- #390 of 826 in TX
Livability — Kyle
- Score
- 75/100
- State rank
- #138
- US rank
- #3993
Category grades
Schools grade is shown separately in the Schools card above.
Census & demographics
- Census place
- Kyle, TX
- County
- Hays County · 280,138 people
- City population
- 77,531
- Metro
- Austin-Round Rock-Georgetown, TX
- Population (ZIP)
- 77,531
- Household income
- $90,075
- Rent vs Own
- Severe rent burden
- 2552.0
Population outlook (Hays County) Hauer SSP2
- Today (2025)
- 286,948 people
- By 2030
- 336,923 · +17.4%
- By 2040
- 441,894 · +54.0%
- By 2050
- 553,462 · +92.9%
- By 2075
- 838,261 · +192.1%
- By 2100
- 1,063,658 · +270.7%
Race, ethnicity, and origin ACS 2023
- Neighborhood character
- Diverse neighborhood (Simpson 0.56)
- Race & ethnicity
- Hispanic / Latino 55% White 36% Two or more races 29% Black 5% Native American 1%
- Hispanic origin (detail)
- Mexican 47% Puerto Rican 1%
- Common ancestry
- Italian 2% Slovak 2% Lithuanian 1%
- Foreign-born
- 13% · Canada
- Languages at home
- 63% English-only · Spanish 35%
Political lean MEDSL · Hays
- 2024 margin
- Lean D (+5.7) · D 52.1% · R 46.5% · Other 1.4%
- 2008→2024 swing
- +7.7pp toward D · 2008: -2.0pp · 2024: 5.7pp
- All cycles
- 2024: D+5.7 2020: D+10.8 2016: R+0.9 2012: R+10.4 2008: R+2.0
Not yet ingested
- Civics
- —
Market trends
- HPI YoY
- ▼ -92.64%
- Current HPI
- 181.7969
- Rent YoY
- ▼ -0.34%
- Metro
- Austin-Round Rock-Georgetown, TX
- State GDP YoY
- ▲ 3.95%
- F500 in state
- 110
Industry mix (Fortune 500 HQ in TX)
| Industry | F500 HQs | Revenue |
|---|---|---|
| Energy | 16 | $1,198B |
|
||
| Technology | 5 | $198B |
|
||
| Engineering / Construction | 4 | $72B |
|
||
| Energy Services | 3 | $60B |
|
||
| Utilities | 3 | $41B |
|
||
| Healthcare | 2 | $330B |
|
||
Price history
+140.0% since first listed45 events — show timeline
- 2026-03-12 Listed $216,000 LERA
- 2026-03-12 Listed $216,000 Unlock MLS
- 2024-07-26 Rental Removed $1,700 BUILDIUM
- 2024-07-18 Listed for Rent $1,700 BUILDIUM
- 2024-07-18 Rental Removed $1,700 ACTRIS
- 2024-07-14 Listed for Rent $1,700 ACTRIS
- 2024-06-28 Rental Removed $1,700 ACTRIS
- 2024-06-26 Price Changed $1,700 ACTRIS
- 2024-06-20 Price Changed $1,800 ACTRIS
- 2024-05-29 Listed for Rent $1,850 ACTRIS
- 2022-07-29 Sold (Public Records) — Public Records
- 2022-07-27 Sold (MLS) — Unlock MLS
- 2022-06-26 Contingent — Unlock MLS
- 2022-06-16 Price Changed $335,000 Unlock MLS
- 2022-06-01 Listed $350,000 Unlock MLS
- 2013-09-26 Sold (MLS) $92,500 CTXMLS
- 2013-07-09 Listed $90,000 CTXMLS
- 2013-03-13 Delisted — Unlock MLS
- 2013-02-06 Pending — Unlock MLS
- 2013-01-30 Contingent — Unlock MLS
- 2013-01-18 Relisted — Unlock MLS
- 2013-01-10 Contingent — Unlock MLS
- 2013-01-02 Price Changed — Unlock MLS
- 2012-12-10 Price Changed — Unlock MLS
- 2012-12-07 Relisted — Unlock MLS
- 2012-11-16 Contingent — Unlock MLS
- 2012-09-18 Listed — Unlock MLS
- 2012-07-25 Delisted — Unlock MLS
- 2012-07-02 Relisted — Unlock MLS
- 2012-04-11 Contingent — Unlock MLS
- 2012-03-25 Relisted — Unlock MLS
- 2012-02-28 Contingent — Unlock MLS
- 2012-01-31 Price Changed — Unlock MLS
- 2012-01-20 Relisted — Unlock MLS
- 2012-01-06 Contingent — Unlock MLS
- 2011-12-23 Price Changed — Unlock MLS
- 2011-12-23 Relisted — Unlock MLS
- 2011-12-22 Contingent — Unlock MLS
- 2011-11-01 Listed — Unlock MLS
- 2011-06-22 Delisted — Unlock MLS
- 2011-04-19 Relisted — Unlock MLS
- 2010-12-22 Pending — Unlock MLS
- 2010-06-15 Listed — Unlock MLS
- 2009-10-31 Delisted — Unlock MLS
- 2009-07-18 Listed — Unlock MLS
Property tax history
+4.0%/yrLatest (2025): $5,455 · -16.0% YoY. Source: county tax records.
Cash-flow waterfall
monthlySold comps — $/sqft
last 12 mo · ≤1 miLoading sold comps…