None · Lafayette, LA
Flood risk 2/10 · Minimal
- FEMA flood zone
- A
- Chance of flooding over 30 yrs
- 0.09%
- Est. flood insurance / yr
- $1,009 – $1,996
Fire risk 2/10 · Minimal
- Est. fire insurance / yr
- $1,269 – $2,357
Heat risk 9/10 · Severe
- Hot days now (above 108°F)
- 7 days/yr
- Hot days in 30 yrs
- 21 days/yr
Wind risk 9/10 · Severe
- Chance of severe wind over 30 yrs
- 99.0%
Air-quality risk 1/10 · Minimal
- Unhealthy air days now
- 0 days/yr
- Unhealthy air days in 30 yrs
- 0 days/yr
Risk factors via First Street. Map © Google.
Why this score? — see what drove the D+ grade
The composite is a weighted blend of 9 inputs, each scored 0–100. Each bar is that input's sub-score; the figure is the points it added to the 100-point composite (weight × sub-score).
- Cash flow +16.7/30.0
- ARV discount +7.6/15.0
- 1% rule +5.2/10.0
- DSCR +5.2/10.0
- Schools +3.6/10.0
- Rent growth +3.5/5.0
- Livability +3.5/5.0
- Condition / age +2.8/5.0
- Appreciation +0.0/10.0
$125,000
🖨 Deal sheet 📄 Offer letter ✓ Due diligence
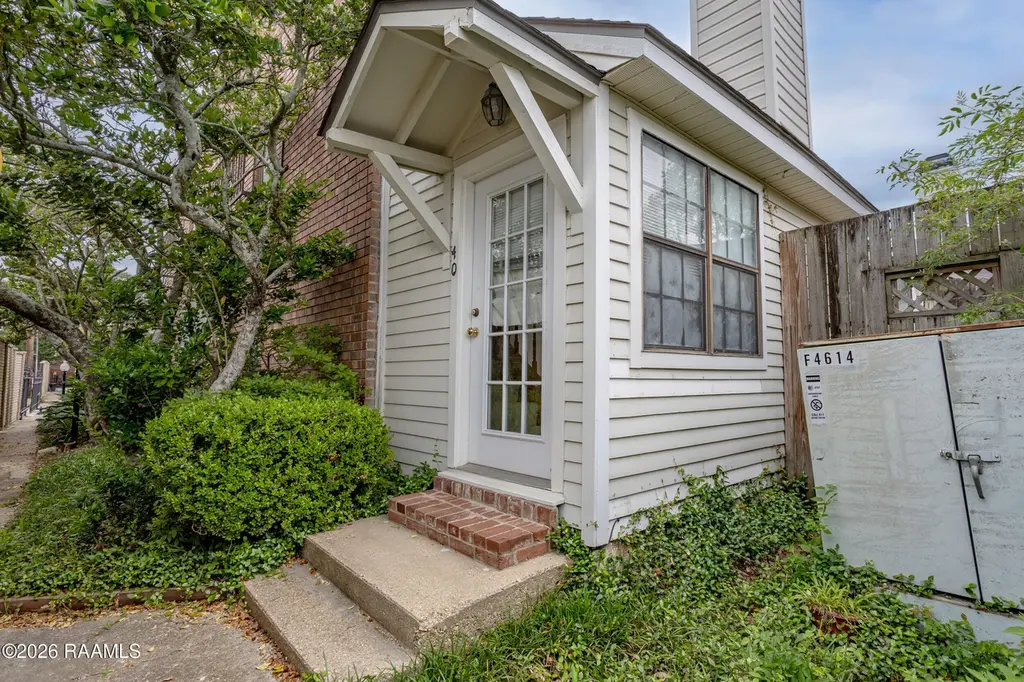
Listing remarks
New Orleans style townhouse with cathedral ceiling in the living room accented by a wood burning fireplace open to the kitchen and dining area which looks out to the private deck area. One full suite downstairs and a second full suite located upstairs with a balcony overlooking the living room and beautiful brick fireplace. Kitchen appliances, washer and dryer are included.
Key facts
- Private deck
- Cathedral ceiling
- Parking
Tags
Neighborhood map
What this means for you Summary
Snapshot
- This is a 2-bed/2.0-bath single-family listed at $125k. Condition is rated average.
Deal economics
- At list price, monthly cash flow is $-47 ($-565/yr) — negative.
- To cash-flow at today's rent, offer at most $118k (5.4% below list).
- Meets the 1% rule at list price ($1k rent vs $125k).
- Recommended offer: $118k (5.4% below list) — sets the bar for cash-flow.
- Cap rate 7.0% vs local median 4.7% in Lafayette — top-decile yield for the area; either an underpriced asset or a hidden risk that comps aren't pricing in. Stress-test before assuming the spread holds.
Location & tenants
- Location reads 70/100 on livability (#63 in LA) — a middle-class / working-renter tenant base. Strengths: cost of living A+, housing A+, health & safety A+; Watch: amenities C-, employment C-, crime F.
- Lafayette Parish (urban): math 38% / reading 46% proficiency, ranked #19 of 98 in LA (top 19%) — families likely to look elsewhere, expect single-tenant / working-renter base with shorter leases.
- Zoned schools: Prairie Elementary School (math 45% / reading 55%, grade D+, #125 of 646 statewide, top 20%, 606 students, 55% FRL); Judice Middle School (math 26% / reading 36%, grade F, #110 of 218 statewide, top 51%, 463 students, 61% FRL); Acadiana High School (math 31% / reading 29%, grade F, #125 of 265 statewide, top 47%, 1,813 students, 56% FRL) — zoned schools at 57% FRL track the district average.
- Market conditions: Rents rising fast (+4.1%/yr); 404 active listings in the ZIP; 18 comparable units currently listed for rent nearby; rentals lingering (median 44d on market — plan ~5-8 weeks vacancy on turnover, expect pricing pressure); 50% of comp listings sitting > 30 days — soft ceiling on asking rent; 1,585 units permitted in Lafayette Parish in 2024 (10 in 5+ unit buildings).
Forward outlook
- Local home prices are declining (-3.0%/yr); year-one equity from $864 of loan paydown is wiped out by about $4k of value loss. Plan a longer hold.
- Lafayette County population projected at +34% by 2050 — long-run rental-demand tailwind backs the buy-and-hold thesis.
Negotiation context
- Only 5 days on market — expect competitive offers; lowballing is unlikely to land.
Risks & watch-outs
- Watch-outs: flood insurance adds $125/mo.
- Climate carrying-cost: in FEMA flood zone A (mandatory federal flood insurance); severe wind risk, 99% chance of damaging wind over 30y; extreme-heat days projected 7→21/yr by 2055 (HVAC capex compounding) — expect insurance premiums to compound above CPI over the hold.
Questions for the listing agent
- What do current leases actually rent for vs. the listed asking? Can we see a recent rent roll and the last 12 months of T-12 income?
- What's the actual annual flood-insurance premium (NFIP or private), and is the property in a SFHA with mandatory coverage?
- What does the HOA fee cover, when was the last increase, and are there any pending special assessments or reserve-fund shortfalls?
- Is there a deadline driving the sale (1031 exchange, divorce, estate, relocation)? That informs how much negotiation room exists.
- Schools are B-rated — typically a magnet for longer-tenancy family renters. What's the average tenant stay here, and is there a school-zone premium baked into asking?
- Crime grade is F in this area — have there been break-ins, vandalism, or insurance claims at this property in the last 3 years? What carrier currently insures it and at what premium?
- The area grade is low — what's the realistic commute time and amenity access for the typical tenant pool here? Any planned neighborhood developments (good or bad) we should know about?
- What's the average days-on-market for RENTAL listings here right now (not sales)? A rising rental-DOM trend means longer vacancies and softer asking-rent achievability than the comps imply.
- What's the recent tenant-quality profile in this submarket — average credit score on applications, eviction rate, late-payment / NSF rate, and stable-employment percentage? A property-management company in the area should have these aggregated.
- How much new for-sale + rental construction is in the pipeline within 1–3 miles? Heavy new supply typically softens prices + rents 12–24 months out; constrained supply supports both.
Investment metrics
- 1% rule
- 1.02% ✓
- Cap rate
- 7.04%
- Cash-on-cash
- 2.68%
- DSCR
- 1.12
- GRM
- 8.1
CMA / ARV
- ARV (on-the-fly)
- $125,280
- Comps found
- 12
Show comp detail 12 sales within ~0.75 mi
| Address | Dist | Beds/Ba | Sqft | Sold | Price | $/sf | Match |
|---|---|---|---|---|---|---|---|
| — | 0.00mi | 2/2.0 | 1,080 (0%) | 1mo | $125,000 | $116 | 99 |
| — | 0.00mi | 3/2.0 (+1) | 1,086 (+1%) | 8mo | $141,000 | $130 | 87 |
| 4620 W Congress St #51 | 0.60mi | 2/2.0 | 1,050 (-3%) | 3mo | $127,500 | $121 | 65 |
| 100 Winchester Dr #308 | 0.60mi | 2/1.5 | 1,050 (-3%) | 2mo | $103,000 | $98 | 63 |
| 101 Wilbourn Blvd #604 | 0.64mi | 2/1.5 | 1,059 (-2%) | 2mo | $65,000 | $61 | 63 |
| 101 Wilbourn Blvd Apt 503 | 0.61mi | 2/1.0 | 1,056 (-2%) | 1mo | $87,500 | $83 | 63 |
| 101 Wilbourn Blvd #707 | 0.63mi | 2/1.5 | 1,059 (-2%) | 4mo | $59,000 | $56 | 62 |
| 100 Winchester Dr #702 | 0.60mi | 2/1.5 | 1,090 (+1%) | 13mo | $107,000 | $98 | 58 |
| 101 Wilbourn Blvd #913 | 0.68mi | 2/1.5 | 1,100 (+2%) | 7mo | $100,000 | $91 | 57 |
| 201 Strasbourg Dr | 0.44mi | 3/2.0 (+1) | 1,160 (+7%) | 11mo | $140,000 | $121 | 53 |
| 118 Woodoak Cir | 0.56mi | 3/2.0 (+1) | 1,220 (+13%) | 7mo | $170,000 | $139 | 41 |
| 131 E Pamela Dr | 0.64mi | 3/2.0 (+1) | 1,240 (+15%) | 6mo | $147,000 | $119 | 36 |
Match score weights: distance 35% · size 25% · config 20% · recency 20%. Top-matched comps best support the ARV.
Projected returns pro-forma
-3.0% appreciation · 4.12% rent growth · sell at horizon
- IRR
- -17.3%
- Equity multiple
- 0.38×
- Total profit
- $-21,655
- Equity at exit
- $18,638
- IRR
- -6.7%
- Equity multiple
- 0.54×
- Total profit
- $-16,023
- Equity at exit
- $10,808
Cash invested: $35,000 (down + closing). Projections, not guarantees.
Landlord ↔ Tenant lean methodology
- Overall (STATE)
- 90 Strongly Landlord-Friendly
- State Louisiana
- 90 Strongly Landlord-Friendly · R+12
- County
- — inherits STATE
- City
- — inherits STATE
ZIP-level market 70506
- Home prices YoY
- -34.8%
- Rents YoY
- 4.1%
- Active inventory
- 404
- Price-to-rent
- 8.1×
Monthly cashflow live
- Estimated rent
- $1,281 high interval (Pro) →
- Mortgage (P&I)
- −$656
- Tax est. 1.5%
- −$156 /mo · $1,875/yr
- Insurance
- −$52
- Flood insurance flood zone
- −$125 /mo · $1,502/yr
- HOA
- −$70
- Vacancy / Maint / Mgmt
- −$269
- Net cashflow
- $-47
Break-even live
UW: 25.0% down · 7.5% · 30yr · 1.5% tax · 5.0% vac · 8.0% maint · 8.0% mgmt
Financing live
Cash to close
- Down payment
- $31,250
- Closing costs
- $3,750
- Reserves months
- —
- Total cash needed
- —
Loan-product check · same deal, 3 products live
Conventional
25% down · 7.5% · 30yr
- Down + closing
- —
- Monthly P&I
- —
- Monthly cashflow
- —
- DSCR
- —
- Eligible?
- —
Personal DTI + credit; lowest rate.
DSCR
20% down · 8.5% · 30yr
- Down + closing
- —
- Monthly P&I
- —
- Monthly cashflow
- —
- DSCR
- —
- Eligible?
- —
No personal income docs; deal must DSCR.
Hard money
10% down · 12.0% · 12mo
- Down + closing
- —
- Monthly P&I
- —
- Monthly cashflow
- —
- DSCR
- —
- Eligible?
- —
Short-term bridge; refi at stabilization.
Rent comps 18 comps
| Address | Beds | Baths | Sqft | Rent | $/sqft | DOM | Units | Dist |
|---|---|---|---|---|---|---|---|---|
| 401 Strasbourg Dr Lafayette, LA | 3.0 | 2.0 | 1500 | $1,450 | $0.97 | 44d | 1 | 0.32mi |
| 326 Guilbeau Rd #248 Lafayette, LA | 2.0 | 2.0 | 950 | $1,085 | $1.14 | 44d | 1 | 0.60mi |
| 326 Guilbeau Rd #131 Lafayette, LA | 1.0 | 1.0 | 750 | $950 | $1.27 | 44d | 1 | 0.60mi |
| 108 Appleoak Ave Unit B Lafayette, LA | 2.0 | 2.5 | 1348 | $1,495 | $1.11 | 44d | 1 | 0.61mi |
| 101 Wilbourn Blvd #304 Lafayette, LA | 2.0 | 1.5 | 1150 | $1,275 | $1.11 | 44d | 1 | 0.61mi |
| 106 Seattle St Lafayette, LA | 3.0 | 2.0 | 1480 | $1,900 | $1.28 | 44d | 1 | 0.62mi |
| 101 Wilbourn Blvd #503 Lafayette, LA | 2.0 | 1.5 | 1100 | $1,300 | $1.18 | 13d | 1 | 0.63mi |
| 317 Guilbeau Rd Lafayette, LA | 1.0–3.0 | 1.0–1.5 | 833 | $988 | $1.19 | 13d | 14 | 0.67mi |
| 203 Crystal Ln Lafayette, LA | 3.0 | 2.0 | 1200 | $1,550 | $1.29 | 13d | 1 | 0.68mi |
| 3603 W Congress St Unit 133B Lafayette, LA | 2.0 | 1.0 | 768 | $950 | $1.24 | 44d | 1 | 0.85mi |
| 3603 W Congress St Lafayette, LA | 2.0 | 1.0 | 768 | $950 | $1.24 | 13d | 1 | 0.85mi |
| 3503 W Congress St Lafayette, LA | 3.0 | 1.0 | 876 | $875 | $1.00 | 44d | 1 | 0.88mi |
| 655 Marie Antoinette St Lafayette, LA | 1.0–2.0 | 1.0–2.0 | 900 | $1,196 | $1.33 | 13d | 14 | 0.98mi |
| 101 Glouchester Rd Lafayette, LA | 1.0–2.0 | 1.0–2.0 | 840 | $979 | $1.17 | 13d | 10 | 0.99mi |
| 715 Marie Antoinette St Lafayette, LA | 1.0–2.0 | 1.0–2.0 | 900 | $990 | $1.10 | 44d | 5 | 1.04mi |
| 110 Claymore Dr Lafayette, LA | 3.0 | 2.0 | 1500 | $1,500 | $1.00 | 21d | 1 | 1.31mi |
| 118 Millie Park Lafayette, LA | 3.0 | 2.0 | 1200 | $1,750 | $1.46 | 21d | 1 | 1.36mi |
| 411 Dulles Dr Lafayette, LA | 1.0–3.0 | 1.0–3.0 | 1107 | $1,164 | $1.05 | 13d | 23 | 1.49mi |
HOA detail
- Monthly dues
- $70 · $840/yr
Listing history 2 events
-
2026-04-27status Pending
-
2026-04-22$125,000 Active
ⓘ Source: listings_history table (triggers on properties + properties_extension) + one-shot
backfill from property_details.listing_events for pre-trigger history.
Climate risk First Street
- Flood 2/10 Low FEMA zone A · 9% chance over 30 yrs
- Wildfire 2/10 Low
- Heat 9/10 Extreme 7 d/yr ≥108°F today · 21 d/yr by 30 yrs out
- Wind 9/10 Extreme 99% chance of damaging wind over 30 yrs
- Air quality 1/10 Low 0 unhealthy d/yr today · 0 by 30 yrs out
Nearby sold comps map
Loading sold comps map…
Walkable amenities ~0.75 mi
Loading nearby amenities…
Taxation est. · year 1
- Rental income
- $15,372
- − Mortgage interest
- −$7,002
- − Property taxes
- −$1,875
- − Insurance
- −$2,128
- − Repairs & maintenance
- −$1,230
- − Management
- −$1,230
- − HOA
- −$840
- − Depreciation
- −$3,636
- Taxable loss
- −$2,568
- Est. tax savings @ 24.0%
- +$616
- After-tax cash flow
- $52/yr
For passive investors: Depreciation is non-cash, so a rental often shows a tax loss while cash-flowing — sheltering income. Rental losses are passive: they offset passive income freely, and up to $25,000/yr can offset ordinary (W-2) income if you actively participate and your MAGI is under $100k (phasing out to $0 by $150k); unused losses carry forward. On sale, claimed depreciation is recaptured at up to 25%, and gains may owe capital-gains tax (a 1031 exchange can defer both). Figures are a year-1 estimate at your 24.0% rate — not tax advice; consult a CPA.
Condition & rehab AI · 12 photos
This Lafayette LA townhouse requires moderate renovations to update the kitchen and bathrooms, paint interior walls, and improve landscaping. These updates would significantly increase its resale and rental value.
Repairs flagged
- Moderate kitchen cabinets — dated and worn
- Moderate bathroom fixtures — dated and worn
- Minor exterior siding — moderate wear
Value-add opportunities
- Both update kitchen cabinets and flooring — modernizing kitchen would appeal to buyers and renters
- Both update bathrooms with new fixtures and flooring — modernizing bathrooms would appeal to buyers and renters
- Both paint interior walls — fresh paint would improve curb appeal and interior aesthetics
- Both prune overgrown vegetation — improved landscaping would enhance curb appeal and attract more buyers
Renovation cost estimate screening
| Repair item | Severity | Est. cost |
|---|---|---|
| kitchen cabinets · dated and worn | Moderate | $3,000–15,000 |
| bathroom fixtures · dated and worn | Moderate | $3,000–15,000 |
| exterior siding · moderate wear | Minor | $500–3,000 |
| Total estimated repair cost · 3 items | $6,500–33,000 |
Value-add ROI direction
- Both update kitchen cabinets and flooring — modernizing kitchen would appeal to buyers and renters ↑
- Both update bathrooms with new fixtures and flooring — modernizing bathrooms would appeal to buyers and renters ↑
- Both paint interior walls — fresh paint would improve curb appeal and interior aesthetics ↑
- Both prune overgrown vegetation — improved landscaping would enhance curb appeal and attract more buyers ↑
ⓘ Cost ranges are severity-bucket heuristics (US national rule-of-thumb). Get contractor quotes + a written scope before underwriting a rehab budget.
Schools (NCES district)
- District
- Lafayette Parish
- NCES district ID
- 2200870
- Math proficiency
- 38% ▼ -32.00%
- Reading proficiency
- 46% ▼ -24.00%
- Median HH income
- $50,238
- Composite
- 36.15/100
- National rank
- #4741
- State rank
- #19 of 98 in LA
Livability — Lafayette
- Score
- 70/100
- State rank
- #63
- US rank
- #8133
Category grades
Schools grade is shown separately in the Schools card above.
Census & demographics
- Census place
- Lafayette, LA
- County
- Lafayette Parish · 207,544 people
- City population
- 158,114
- Metro
- Lafayette, LA
- Population (ZIP)
- 42,318
- Household income
- $57,379
- Rent vs Own
- Severe rent burden
- 2095.0
Population outlook (Lafayette County) Hauer SSP2
- Today (2025)
- 280,930 people
- By 2030
- 301,092 · +7.2%
- By 2040
- 339,456 · +20.8%
- By 2050
- 375,156 · +33.5%
- By 2075
- 451,672 · +60.8%
- By 2100
- 497,203 · +77.0%
Race, ethnicity, and origin ACS 2023
- Neighborhood character
- Diverse neighborhood (Simpson 0.58)
- Race & ethnicity
- White 60% Black 20% Hispanic / Latino 13% Two or more races 13% Asian 3%
- Hispanic origin (detail)
- Mexican 4%
- Common ancestry
- Lithuanian 18% Armenian 1% Slovak 1%
- Foreign-born
- 12% · Canada, Vietnam
- Languages at home
- 83% English-only · Spanish 9% French/Haitian/Cajun 3% Vietnamese 1%
Political lean MEDSL · Lafayette
- 2024 margin
- Solid R (+31.4) · D 33.5% · R 64.8% · Other 1.7%
- 2008→2024 swing
- -0.1pp no change · 2008: -31.3pp · 2024: -31.4pp
- All cycles
- 2024: R+31.4 2020: R+28.7 2016: R+33.6 2012: R+33.7 2008: R+31.3
Not yet ingested
- Civics
- —
Market trends
- HPI YoY
- ▼ -75.28%
- Current HPI
- 140.8445
- Rent YoY
- ▲ 4.12%
- Metro
- Lafayette, LA
- State GDP YoY
- ▲ 3.29%
- F500 in state
- 10
Industry mix (Fortune 500 HQ in LA)
| Industry | F500 HQs | Revenue |
|---|---|---|
| Telecommunications | 2 | $23B |
|
||
| Utilities | 1 | $12B |
|
||
| Wholesale / Distribution | 1 | $5B |
|
||
| Advertising | 1 | $2B |
|
||
Price history
2 events — show timeline
- 2026-04-27 Pending — AcadianaMLS
- 2026-04-22 Listed $125,000 AcadianaMLS
Cash-flow waterfall
monthlySold comps — $/sqft
last 12 mo · ≤1 miLoading sold comps…