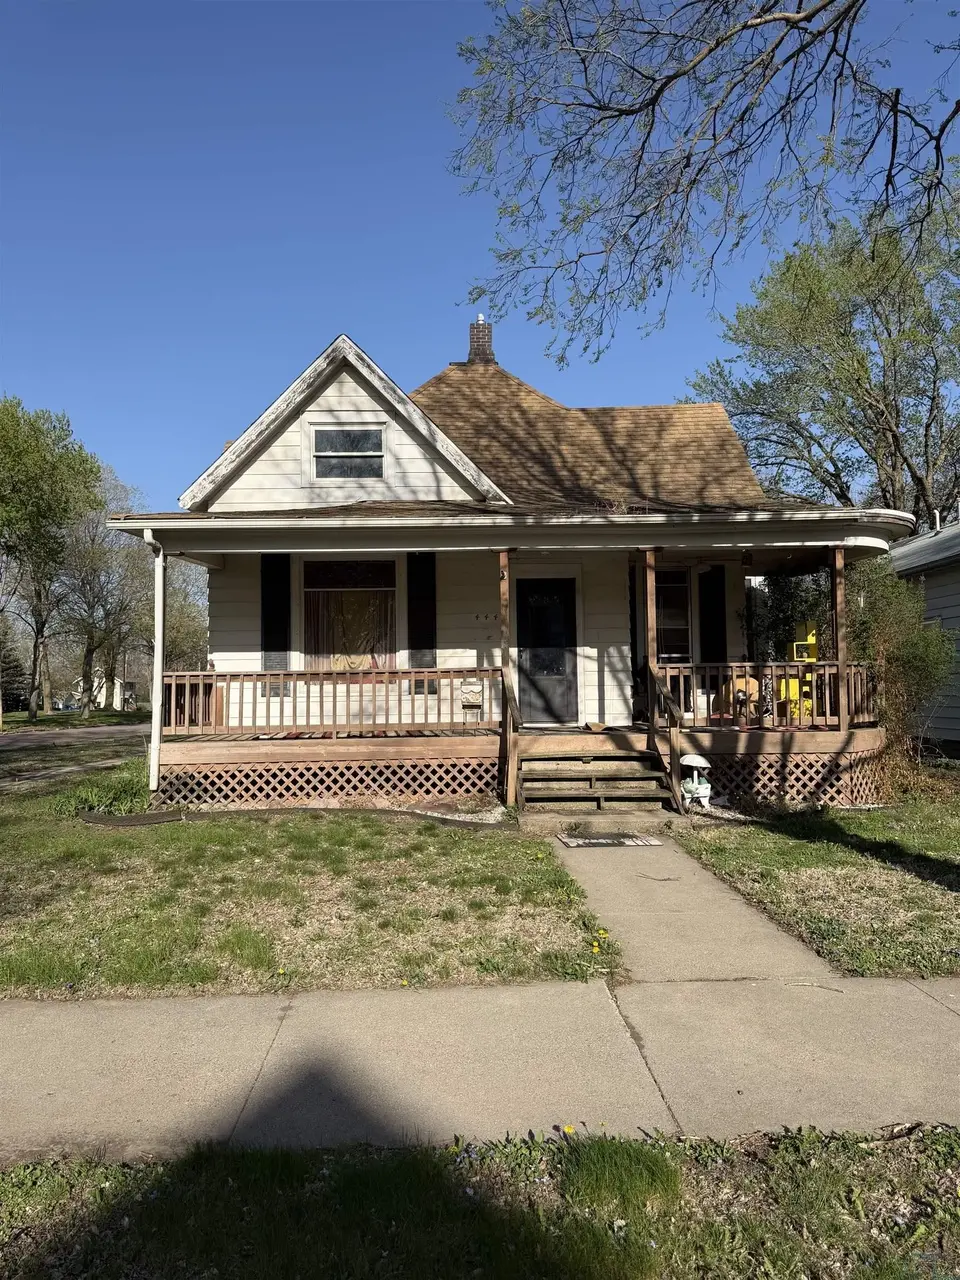
444 Sherman Ave · Cherokee, IA
Flood risk 1/10 · Minimal
- FEMA flood zone
- X (unshaded)
- Chance of flooding over 30 yrs
- 0.0%
- Est. flood insurance / yr
- $473 – $860
Fire risk 6/10 · Moderate
- Est. fire insurance / yr
- $902 – $1,676
Heat risk 3/10 · Minor
- Hot days now (above 100°F)
- 7 days/yr
- Hot days in 30 yrs
- 15 days/yr
Wind risk 2/10 · Minimal
- Chance of severe wind over 30 yrs
- —
Air-quality risk 1/10 · Minimal
- Unhealthy air days now
- 0 days/yr
- Unhealthy air days in 30 yrs
- 0 days/yr
Risk factors via First Street. Map © Google.
Why this score? — see what drove the B+ grade
The composite is a weighted blend of 9 inputs, each scored 0–100. Each bar is that input's sub-score; the figure is the points it added to the 100-point composite (weight × sub-score).
- Cash flow +30.0/30.0
- ARV discount +15.0/15.0
- 1% rule +10.0/10.0
- DSCR +10.0/10.0
- Schools +5.6/10.0
- Livability +4.0/5.0
- Rent growth +2.5/5.0
- Condition / age +2.5/5.0
- Appreciation +0.0/10.0
$67,500
🖨 Deal sheet (PDF) 📄 Offer letter ✓ Due diligence
Listing remarks MLS
This is a 3 bedroom 1.75 bath bungalow home with a partial finished attic home sitting on a corner lot and is looking for it's next owner to give it some TLC. Main floor has kitchen, dining room, living room, 2 bedrooms and a full bath with laundry. Upstairs consists of an open bedroom and 3/4 bath. there are 2 open porches for your morning and evening enjoyment! There is a one car detached garage.
Key facts
- 5,663 sq ft lot
- Garage
- Built 1890
Property features AI
Finance
- Financial info: Annual tax amount reported
Exterior
- Parking: Detached 1-car garage
- Utilities: Public water supply; Public sewer service
- Home design: Residential single-family home; Lot approximately 0.13 acre
- Construction: Aluminum siding
- Exterior features: Shingle roof; Public water; Public sewer
Interior
- Bathrooms: One full bathroom; One three-quarter bathroom
- Heating & cooling: Natural gas heating with forced air; Window cooling units
- Interior features: Water softener; Unfinished basement
Neighborhood map
What this means for you Summary
Snapshot
- This is a 2-bed/1.5-bath single-family listed at $68k.
Deal economics
- At list price, monthly cash flow is $445 ($5k/yr) — positive.
- The deal already cash-flows at list — no discount required.
- Meets the 1% rule at list price ($1k rent vs $68k).
- Cap rate 14.2% vs local median 4.9% in Cherokee — top-decile yield for the area; either an underpriced asset or a hidden risk that comps aren't pricing in. Stress-test before assuming the spread holds.
Location & tenants
- Location reads 80/100 on livability (#83 in IA, #1,698 nationally) — a professional / high-income tenant draw. Strengths: cost of living A+, housing A+, health & safety A+; Watch: employment D+, amenities F, commute F.
- Cherokee Community School District (town): math 65% / reading 67% proficiency, ranked #191 of 289 in IA (top 66%) — acceptable for families but not a draw, mixed tenant base, ~2y average lease.
- Zoned schools: Cherokee Elementary School (math 57% / reading 52%, grade C, #462 of 616 statewide, top 79%, 492 students, 43% FRL); Cherokee Middle School (math 65% / reading 64%, grade A-, #157 of 246 statewide, top 67%, 355 students, 42% FRL).
- Market conditions: 44 active listings in the ZIP; 3 comparable units currently listed for rent nearby; rentals at typical pace (median 22d on market — plan ~3-4 weeks tenant-placement turnaround); 10 units permitted in Cherokee County in 2024 (0 in 5+ unit buildings).
Forward outlook
- Local home prices are declining (-3.0%/yr); year-one equity from $467 of loan paydown is wiped out by about $2k of value loss. Plan a longer hold.
- Cherokee County population projected at -23% by 2050 — secular population decline; favor cash flow + early exit over multi-decade hold.
- At projected returns (-3.0% appreciation + 3.0% rent growth), your $19k cash investment doubles in ~5 years — after that, you're playing with house money.
Negotiation context
- Only 10 days on market — expect competitive offers; lowballing is unlikely to land.
- 2 sale attempts since 2y ago with the ask held roughly flat each time — persistent listings suggest the price (not the market) is what's stuck; bring a comps-based counter.
- Current owner paid $55k; 23% above their basis — modest negotiation headroom, anchor on the comps not their cost.
Risks & watch-outs
- Watch-outs: built in 1890 — expect roof / HVAC / electrical / plumbing capex.
- Climate carrying-cost: major wildfire risk — expect insurance premiums to compound above CPI over the hold.
Questions for the listing agent
- Built in 1890 — when were the roof, HVAC, electrical panel, plumbing, and water heater last replaced?
- Is there a deadline driving the sale (1031 exchange, divorce, estate, relocation)? That informs how much negotiation room exists.
- Schools are B-rated — typically a magnet for longer-tenancy family renters. What's the average tenant stay here, and is there a school-zone premium baked into asking?
- What's the average days-on-market for RENTAL listings here right now (not sales)? A rising rental-DOM trend means longer vacancies and softer asking-rent achievability than the comps imply.
- What's the recent tenant-quality profile in this submarket — average credit score on applications, eviction rate, late-payment / NSF rate, and stable-employment percentage? A property-management company in the area should have these aggregated.
- How much new for-sale + rental construction is in the pipeline within 1–3 miles? Heavy new supply typically softens prices + rents 12–24 months out; constrained supply supports both.
Investment metrics
- 1% rule
- 1.72% ✓
- Cap rate
- 14.20%
- Cash-on-cash
- 28.26%
- DSCR
- 2.26
- GRM
- 4.9
CMA / ARV
- ARV (median comp)
- $113,127
- List price
- $67,500
- Delta
- -40.33%
- Verdict
- UNDERPRICED
- Comps
- 20 within 1.0 mi
Show comp detail 12 sales within ~0.75 mi
| Address | Dist | Beds/Ba | Sqft | Sold | Price | $/sf | Match |
|---|---|---|---|---|---|---|---|
| 6 Sioux Valley Dr | 0.44mi | 3/1.0 (+1) | 1,483 (+0%) | 10mo | $120,000 | $81 | 64 |
| 415 E Cedar St | 0.20mi | 3/1.5 (+1) | 1,292 (-13%) | 4mo | $87,500 | $68 | 61 |
| 440 E Spruce St | 0.25mi | 3/2.0 (+1) | 1,597 (+8%) | 12mo | $135,000 | $85 | 58 |
| 442 Dakota Ave | 0.32mi | 3/1.5 (+1) | 1,360 (-8%) | 11mo | $31,000 | $23 | 57 |
| 544 Park Ave | 0.32mi | 3/2.0 (+1) | 1,620 (+10%) | 6mo | $159,250 | $98 | 57 |
| 602 N Roosevelt Ave | 0.10mi | 3/1.5 (+1) | 1,668 (+13%) | 15mo | $190,101 | $114 | 57 |
| 1403 Susan Ave | 0.74mi | 3/2.0 (+1) | 1,464 (-1%) | 2mo | $140,000 | $96 | 56 |
| 1008 N Hughes Ave | 0.58mi | 3/2.0 (+1) | 1,550 (+5%) | 6mo | $124,000 | $80 | 53 |
| 518 E Spruce St | 0.30mi | 3/2.0 (+1) | 1,642 (+11%) | 10mo | $205,000 | $125 | 52 |
| 410 Valley View Dr | 0.67mi | 3/2.0 (+1) | 1,310 (-11%) | 1mo | $169,000 | $129 | 42 |
| 613 Jefferies St | 0.43mi | 3/1.0 (+1) | 1,296 (-12%) | 14mo | $105,000 | $81 | 41 |
| 526 W Maple St | 0.63mi | 2/1.0 | 1,262 (-15%) | 10mo | $90,000 | $71 | 36 |
Match score weights: distance 35% · size 25% · config 20% · recency 20%. Top-matched comps best support the ARV.
Projected returns pro-forma
-3.0% appreciation · 3.0% rent growth · sell at horizon
- IRR
- 22.5%
- Equity multiple
- 1.92×
- Total profit
- $17,426
- Equity at exit
- $10,064
- IRR
- 30.5%
- Equity multiple
- 3.74×
- Total profit
- $51,753
- Equity at exit
- $5,836
Cash invested: $18,900 (down + closing). Projections, not guarantees.
Landlord ↔ Tenant lean methodology
- Overall (STATE)
- 83 Strongly Landlord-Friendly
- State Iowa
- 83 Strongly Landlord-Friendly · R+6
- County
- — inherits STATE
- City
- — inherits STATE
ZIP-level market 51012
- Home prices YoY
- -21.1%
- Active inventory
- 44
- Price-to-rent
- 4.9×
Monthly cashflow live
- Estimated rent
- $1,158 medium interval (Pro) →
- Mortgage (P&I)
- −$354
- Tax from tax record
- −$88 /mo · $1,056/yr
- Insurance
- −$28
- HOA
- −$0
- Vacancy / Maint / Mgmt
- −$243
- Net cashflow
- $445
Break-even live
Sensitivity live
| Price | -10% $483 | -5% $464 | +0% $445 | +5% $426 | +10% $407 |
|---|---|---|---|---|---|
| Rent | -10% $354 | -5% $399 | +0% $445 | +5% $491 | +10% $537 |
| Rate | -1.0pp $479 | -0.5pp $462 | base $445 | +0.5pp $428 | +1.0pp $410 |
UW: 25.0% down · 7.5% · 30yr · 1.5% tax · 5.0% vac · 8.0% maint · 8.0% mgmt
Financing live
Cash to close
- Down payment
- $16,875
- Closing costs
- $2,025
- Reserves months
- —
- Total cash needed
- —
Loan-product check · same deal, 3 products live
Conventional
25% down · 7.5% · 30yr
- Down + closing
- —
- Monthly P&I
- —
- Monthly cashflow
- —
- DSCR
- —
- Eligible?
- —
Personal DTI + credit; lowest rate.
DSCR
20% down · 8.5% · 30yr
- Down + closing
- —
- Monthly P&I
- —
- Monthly cashflow
- —
- DSCR
- —
- Eligible?
- —
No personal income docs; deal must DSCR.
Hard money
10% down · 12.0% · 12mo
- Down + closing
- —
- Monthly P&I
- —
- Monthly cashflow
- —
- DSCR
- —
- Eligible?
- —
Short-term bridge; refi at stabilization.
Rent comps 3 comps
| Address | Beds | Baths | Sqft | Rent | $/sqft | DOM | Units | Dist |
|---|---|---|---|---|---|---|---|---|
| 729 W Cedar St Unit 405 Cherokee, IA | 3.0 | 1.5 | 1100 | $1,050 | $0.95 | 21d | 1 | 0.72mi |
| 942 Riverview Dr Cherokee, IA | 1.0–2.0 | 1.0–2.0 | 1050 | $1,495 | $1.42 | 14d | 20 | 0.76mi |
| 900 Rock Island Ave Cherokee, IA | 2.0–3.0 | 1.0–2.0 | 1058 | $845 | $0.80 | 21d | 12 | 1.11mi |
Listing history 6 events
-
2026-05-03status Pending 245-char remark
-
2026-04-23$67,500 Active 245-char remark
-
2024-12-19soldstatus $55,000 Closed 401-char remark
Show marketing remark (401 chars)
This is a 3 bedroom 1.75 bath bungalow home with a partial finished attic home sitting on a corner lot and is looking for it's next owner to give it some TLC. Main floor has kitchen, dining room, living room, 2 bedrooms and a full bath with laundry. Upstairs consists of an open bedroom and 3/4 bath. there are 2 open porches for your morning and evening enjoyment! There is a one car detached garage.
-
2024-12-19soldstatus $57,500
Show marketing remark (401 chars)
This is a 3 bedroom 1.75 bath bungalow home with a partial finished attic home sitting on a corner lot and is looking for it's next owner to give it some TLC. Main floor has kitchen, dining room, living room, 2 bedrooms and a full bath with laundry. Upstairs consists of an open bedroom and 3/4 bath. there are 2 open porches for your morning and evening enjoyment! There is a one car detached garage.
-
2024-11-19status Pending 401-char remark
Show marketing remark (401 chars)
This is a 3 bedroom 1.75 bath bungalow home with a partial finished attic home sitting on a corner lot and is looking for it's next owner to give it some TLC. Main floor has kitchen, dining room, living room, 2 bedrooms and a full bath with laundry. Upstairs consists of an open bedroom and 3/4 bath. there are 2 open porches for your morning and evening enjoyment! There is a one car detached garage.
-
2024-11-12$55,000 Active 401-char remark
Show marketing remark (401 chars)
This is a 3 bedroom 1.75 bath bungalow home with a partial finished attic home sitting on a corner lot and is looking for it's next owner to give it some TLC. Main floor has kitchen, dining room, living room, 2 bedrooms and a full bath with laundry. Upstairs consists of an open bedroom and 3/4 bath. there are 2 open porches for your morning and evening enjoyment! There is a one car detached garage.
ⓘ Source: listings_history table (triggers on properties + properties_extension) + one-shot
backfill from property_details.listing_events for pre-trigger history.
Tax reassessment forecast IA · Partial reset (capped growth)
- Current annual tax
- $1,056 · $88/mo
- Projected year-2 tax
- $1,058 · $88/mo
- Expected delta
- +$2/yr ($0/mo · 0.2%)
ⓘ Screening estimate from a state-policy table — verify with the county assessor before closing.
Climate risk First Street
- Flood 1/10 Low FEMA zone X (unshaded) · 0% chance over 30 yrs
- Wildfire 6/10 Major
- Heat 3/10 Moderate 7 d/yr ≥100°F today · 15 d/yr by 30 yrs out
- Wind 2/10 Low
- Air quality 1/10 Low 0 unhealthy d/yr today · 0 by 30 yrs out
Nearby sold comps map
Loading sold comps map…
Walkable amenities ~0.75 mi
Loading nearby amenities…
Taxation est. · year 1
- Rental income
- $13,901
- − Mortgage interest
- −$3,781
- − Property taxes
- −$1,056
- − Insurance
- −$338
- − Repairs & maintenance
- −$1,112
- − Management
- −$1,112
- − Depreciation
- −$1,964
- Taxable income
- $4,538
- Est. tax owed @ 24.0%
- −$1,089
- After-tax cash flow
- $4,251/yr
For passive investors: Depreciation is non-cash, so a rental often shows a tax loss while cash-flowing — sheltering income. Rental losses are passive: they offset passive income freely, and up to $25,000/yr can offset ordinary (W-2) income if you actively participate and your MAGI is under $100k (phasing out to $0 by $150k); unused losses carry forward. On sale, claimed depreciation is recaptured at up to 25%, and gains may owe capital-gains tax (a 1031 exchange can defer both). Figures are a year-1 estimate at your 24.0% rate — not tax advice; consult a CPA.
Schools (NCES district)
- District
- Cherokee Community School District
- NCES district ID
- 1907170
- Math proficiency
- 65% ▼ -5.00%
- Reading proficiency
- 67% ▲ 2.00%
- Median HH income
- $45,935
- Composite
- 55.66/100
- National rank
- #1226
- State rank
- #191 of 289 in IA
Livability — Cherokee
- Score
- 80/100
- State rank
- #83
- US rank
- #1698
Category grades
Schools grade is shown separately in the Schools card above.
Census & demographics
- Census place
- Cherokee, IA
- City population
- 6,313
- Population (ZIP)
- 6,313
Population outlook (Cherokee County) Hauer SSP2
- Today (2025)
- 10,631 people
- By 2030
- 10,077 · -5.2%
- By 2040
- 9,015 · -15.2%
- By 2050
- 8,175 · -23.1%
- By 2075
- 7,192 · -32.3%
- By 2100
- 6,738 · -36.6%
Race, ethnicity, and origin ACS 2023
- Neighborhood character
- Predominantly White (89%)
- Race & ethnicity
- White 89% Hispanic / Latino 6% Two or more races 6%
- Hispanic origin (detail)
- Mexican 3%
- Common ancestry
- Iranian 3% Slovak 1% Portuguese 1%
- Foreign-born
- 5% · Canada
- Languages at home
- 92% English-only · Spanish 7% Other Asian/Pacific 1%
Political lean MEDSL · Cherokee
- 2024 margin
- Solid R (+45.8) · D 26.5% · R 72.2% · Other 1.3%
- 2008→2024 swing
- -38.2pp toward R · 2008: -7.6pp · 2024: -45.8pp
- All cycles
- 2024: R+45.8 2020: R+39.3 2016: R+40.6 2012: R+16.2 2008: R+7.6
Not yet ingested
- Civics
- —
Market trends
- HPI YoY
- ▼ -59.34%
- Current HPI
- 221.5831
- Rent YoY
- —
- Metro
- —
- State GDP YoY
- ▲ 2.48%
- F500 in state
- 4
Industry mix (Fortune 500 HQ in IA)
| Industry | F500 HQs | Revenue |
|---|---|---|
| Financial Services | 1 | $16B |
|
||
| Retail / Convenience | 1 | $15B |
|
||
Price history
+22.7% since first listed6 events — show timeline
- 2026-05-03 Pending — NWIA
- 2026-04-23 Listed $67,500 NWIA
- 2024-12-19 Sold (Public Records) $57,500 Public Records
- 2024-12-19 Sold (MLS) $55,000 NWIA
- 2024-11-19 Pending — NWIA
- 2024-11-12 Listed $55,000 NWIA
Property tax history
+0.4%/yrLatest (2025): $1,056 · -1.5% YoY. Source: county tax records.
Cash-flow waterfall
monthlySold comps — $/sqft
last 12 mo · ≤1 miLoading sold comps…