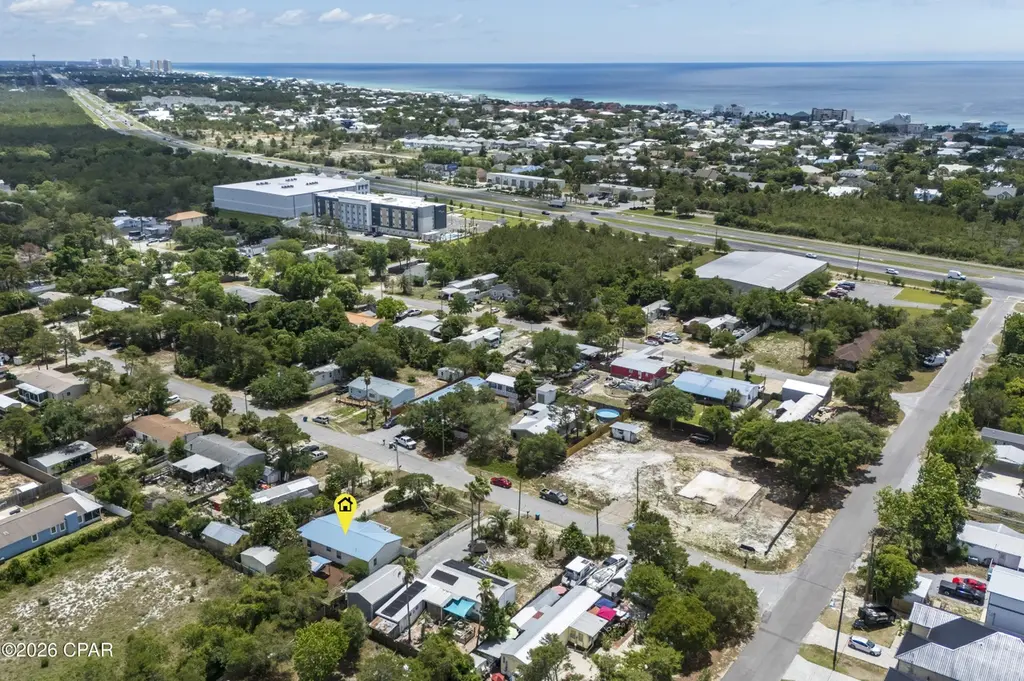
768 Westwood Beach Cir · Laguna Beach, FL
Flood risk 1/10 · Minimal
- FEMA flood zone
- X (unshaded)
- Chance of flooding over 30 yrs
- 0.0%
- Est. flood insurance / yr
- $507 – $1,088
Fire risk 5/10 · Moderate
- Est. fire insurance / yr
- $947 – $1,759
Heat risk 10/10 · Severe
- Hot days now (above 105°F)
- 7 days/yr
- Hot days in 30 yrs
- 22 days/yr
Wind risk 10/10 · Severe
- Chance of severe wind over 30 yrs
- 99.0%
Air-quality risk 2/10 · Minimal
- Unhealthy air days now
- 1 days/yr
- Unhealthy air days in 30 yrs
- 1 days/yr
Risk factors via First Street. Map © Google.
Why this score? — see what drove the D- grade
The composite is a weighted blend of 9 inputs, each scored 0–100. Each bar is that input's sub-score; the figure is the points it added to the 100-point composite (weight × sub-score).
- Cash flow +11.2/30.0
- ARV discount +7.5/15.0
- Schools +4.3/10.0
- Livability +3.7/5.0
- 1% rule +3.3/10.0
- DSCR +3.3/10.0
- Rent growth +2.6/5.0
- Condition / age +2.5/5.0
- Appreciation +0.0/10.0
$279,000
🖨 Deal sheet 📄 Offer letter ✓ Due diligence
Listing remarks
Tucked away on the growing west end of Panama City Beach, just minutes from the sugar-white sands of the Gulf and ideally positioned near 30A and Inlet Beach, This 3 bed 2 bath with office or bunk room charming coastal cottage offers the perfect blend of lifestyle, location and investment potential. Situated on a spacious . 22-acre lot in a quiet, golf cart-friendly neighborhood, this property delivers a relaxed coastal vibe while keeping you close to the area's best dining, shopping, and entertainment. 3bed 2 bath with office or bunk room. Inside, the home features an open, functional layout filled with abundant natural light, creating the perfect canvas for a beautifully designed coastal
Key facts
- Double vanity
- New flooring
- Spacious lot
Tags
Property features AI
Exterior
- Parking: Additional parking available
- Utilities: Electricity available
- Home design: Double wide mobile home
- Construction: Metal siding
- Exterior features: Outbuilding on the property; City street frontage; Publicly maintained road access; Zoned for single-family residential
Interior
- Kitchen: Electric range
- Bedrooms: Bedrooms on the first level (multiple bedrooms)
- Bathrooms: 2 full bathrooms
- Heating & cooling: Electric heating; Central air conditioning
- Interior features: Total of 8 rooms; Short term rental allowed
- Laundry & utility: Laundry room on the first level
Neighborhood map
What this means for you Summary
Snapshot
- This is a 3-bed/2.0-bath manufactured listed at $279k.
Deal economics
- At list price, monthly cash flow is $-108 ($-1k/yr) — negative.
- To cash-flow at today's rent, offer at most $263k (5.6% below list).
- To meet the 1% rule (rent ≥ 1% of price), the offer needs to be $230k (17.4% below list).
- Recommended offer: $230k (17.4% below list) — sets the bar for 1% rule.
- Cap rate 5.8% vs local median 0.9% in Laguna Beach — top-decile yield for the area; either an underpriced asset or a hidden risk that comps aren't pricing in. Stress-test before assuming the spread holds.
Location & tenants
- Location reads 74/100 on livability (#283 in FL, #4,522 nationally) — a middle-class / working-renter tenant base. Strengths: crime A+, housing A+, employment A; Watch: schools F, amenities F.
- Bay (suburban): math 51% / reading 51% proficiency, ranked #29 of 73 in FL (top 40%) — acceptable for families but not a draw, mixed tenant base, ~2y average lease.
- Market conditions: Rents flat; 1249 active listings in the ZIP; 6 comparable units currently listed for rent nearby; rentals leasing fast (median 14d on market — plan ~1-2 weeks tenant-placement turnaround); solid renter incomes; 2,473 units permitted in Bay County in 2024 (559 in 5+ unit buildings).
- This rent runs 35% of the median local income ($80k/yr) — at the standard rent-burdened threshold; future hikes will face affordability resistance.
Forward outlook
- Local home prices are declining (-3.0%/yr); year-one equity from $2k of loan paydown is wiped out by about $8k of value loss. Plan a longer hold.
- Bay County population projected at +24% by 2050 — long-run rental-demand tailwind backs the buy-and-hold thesis.
Negotiation context
- It's been on market 35 days — a 3% lower offer ($271k) is reasonable based on typical stale-listing flexibility.
- Current owner paid $55k; list at $279k implies a 408% gain — meaningful room to come down on a strong offer.
Risks & watch-outs
- Climate carrying-cost: severe wind risk, 99% chance of damaging wind over 30y; moderate wildfire risk; extreme-heat days projected 7→22/yr by 2055 (HVAC capex compounding) — expect insurance premiums to compound above CPI over the hold.
Questions for the listing agent
- What do current leases actually rent for vs. the listed asking? Can we see a recent rent roll and the last 12 months of T-12 income?
- It's been on market 35 days. Have you received any prior offers? Is the seller open to a 17% concession, seller financing, or rate buy-down credit?
- Is there a deadline driving the sale (1031 exchange, divorce, estate, relocation)? That informs how much negotiation room exists.
- Schools are F-rated, which usually means shorter tenancies and higher turnover. Who's the typical renter profile here, and what's been the actual vacancy rate?
- The area grade is low — what's the realistic commute time and amenity access for the typical tenant pool here? Any planned neighborhood developments (good or bad) we should know about?
- What's the average days-on-market for RENTAL listings here right now (not sales)? A rising rental-DOM trend means longer vacancies and softer asking-rent achievability than the comps imply.
- What's the recent tenant-quality profile in this submarket — average credit score on applications, eviction rate, late-payment / NSF rate, and stable-employment percentage? A property-management company in the area should have these aggregated.
- How much new for-sale + rental construction is in the pipeline within 1–3 miles? Heavy new supply typically softens prices + rents 12–24 months out; constrained supply supports both.
Investment metrics
- 1% rule
- 0.83% ✗
- Cap rate
- 5.83%
- Cash-on-cash
- -1.66%
- DSCR
- 0.93
- GRM
- 10.1
CMA / ARV
No comps found within radius.
Projected returns pro-forma
-3.0% appreciation · 0.52% rent growth · sell at horizon
- IRR
- -21.8%
- Equity multiple
- 0.26×
- Total profit
- $-57,664
- Equity at exit
- $41,600
- IRR
- -23.1%
- Equity multiple
- -0.03×
- Total profit
- $-80,834
- Equity at exit
- $24,123
Cash invested: $78,120 (down + closing). Projections, not guarantees.
Landlord ↔ Tenant lean methodology
- Overall (STATE)
- 87 Strongly Landlord-Friendly
- State Florida
- 87 Strongly Landlord-Friendly · R+3
- County
- — inherits STATE
- City
- — inherits STATE
ZIP-level market 32413
- Home prices YoY
- -34.4%
- Rents YoY
- 0.5%
- Active inventory
- 1249
- Price-to-rent
- 10.1×
Monthly cashflow live
- Estimated rent
- $2,304 high interval (Pro) →
- Mortgage (P&I)
- −$1,463
- Tax est. 1.5%
- −$349 /mo · $4,185/yr
- Insurance
- −$116
- HOA
- −$0
- Vacancy / Maint / Mgmt
- −$484
- Net cashflow
- $-108
Break-even live
UW: 25.0% down · 7.5% · 30yr · 1.5% tax · 5.0% vac · 8.0% maint · 8.0% mgmt
Financing live
Cash to close
- Down payment
- $69,750
- Closing costs
- $8,370
- Reserves months
- —
- Total cash needed
- —
Loan-product check · same deal, 3 products live
Conventional
25% down · 7.5% · 30yr
- Down + closing
- —
- Monthly P&I
- —
- Monthly cashflow
- —
- DSCR
- —
- Eligible?
- —
Personal DTI + credit; lowest rate.
DSCR
20% down · 8.5% · 30yr
- Down + closing
- —
- Monthly P&I
- —
- Monthly cashflow
- —
- DSCR
- —
- Eligible?
- —
No personal income docs; deal must DSCR.
Hard money
10% down · 12.0% · 12mo
- Down + closing
- —
- Monthly P&I
- —
- Monthly cashflow
- —
- DSCR
- —
- Eligible?
- —
Short-term bridge; refi at stabilization.
Rent comps 6 comps
| Address | Beds | Baths | Sqft | Rent | $/sqft | DOM | Units | Dist |
|---|---|---|---|---|---|---|---|---|
| 76 Gulf View Dr Unit 1514902P Panama City Beach, FL | 3.0 | 2.0 | 1571 | $2,257 | $1.44 | 13d | 1 | 0.54mi |
| 22942 Ann Miller Rd #111 Panama City Beach, FL | 3.0 | 3.0 | 1540 | $2,600 | $1.69 | 21d | 1 | 0.76mi |
| 22940 Ann Miller Rd #110 Panama City Beach, FL | 3.0 | 2.0 | 1580 | $2,400 | $1.52 | 13d | 1 | 0.76mi |
| 21101 Panama City Beach Pkwy Panama City Beach, FL | 1.0–3.0 | 1.0–2.0 | 1004 | $1,956 | $1.95 | 13d | 12 | 0.93mi |
| 24200 Panama City Beach Pkwy Panama City Beach, FL | 1.0–3.0 | 1.0–2.0 | 1115 | $3,200 | $2.87 | 13d | 170 | 1.06mi |
| 100 Downing St #13 Panama City Beach, FL | 3.0 | 2.5 | 1360 | $1,950 | $1.43 | 21d | 1 | 1.35mi |
Listing history 20 events
-
2026-06-19days on market $279,000 Active 35 DOM
-
2026-06-18days on market $279,000 Active 34 DOM
-
2026-06-17days on market $279,000 Active 33 DOM
-
2026-06-16days on market $279,000 Active 32 DOM
-
2026-06-15days on market $279,000 Active 31 DOM
-
2026-06-14days on market $279,000 Active 29 DOM
-
2026-06-13days on market $279,000 Active 28 DOM
-
2026-06-10days on market $279,000 Active 26 DOM
-
2026-06-09days on market $279,000 Active 25 DOM
-
2026-06-08days on market $279,000 Active 24 DOM
-
2026-06-07days on market $279,000 Active 23 DOM
-
2026-06-05days on market $279,000 Active 20 DOM
-
2026-06-03days on market $279,000 Active 19 DOM
-
2026-06-03price $279,000 Active 18 DOM
-
2026-06-02days on market $289,000 Active 18 DOM
-
2026-06-01days on market $289,000 Active 17 DOM
-
2026-05-31days on market $289,000 Active 16 DOM
-
2026-05-30days on market $289,000 Active 15 DOM
-
2026-05-07$289,000 Active 1621-char remark
-
1999-07-01soldstatus $54,900
ⓘ Source: listings_history table (triggers on properties + properties_extension) + one-shot
backfill from property_details.listing_events for pre-trigger history.
Climate risk First Street
- Flood 1/10 Low FEMA zone X (unshaded) · 0% chance over 30 yrs
- Wildfire 5/10 Major
- Heat 10/10 Extreme 7 d/yr ≥105°F today · 22 d/yr by 30 yrs out
- Wind 10/10 Extreme 99% chance of damaging wind over 30 yrs
- Air quality 2/10 Low 1 unhealthy d/yr today · 1 by 30 yrs out
Nearby sold comps map
Loading sold comps map…
Walkable amenities ~0.75 mi
Loading nearby amenities…
Taxation est. · year 1
- Rental income
- $27,647
- − Mortgage interest
- −$15,628
- − Property taxes
- −$4,185
- − Insurance
- −$1,395
- − Repairs & maintenance
- −$2,212
- − Management
- −$2,212
- − Depreciation
- −$8,116
- Taxable loss
- −$6,101
- Est. tax savings @ 24.0%
- +$1,464
- After-tax cash flow
- $168/yr
For passive investors: Depreciation is non-cash, so a rental often shows a tax loss while cash-flowing — sheltering income. Rental losses are passive: they offset passive income freely, and up to $25,000/yr can offset ordinary (W-2) income if you actively participate and your MAGI is under $100k (phasing out to $0 by $150k); unused losses carry forward. On sale, claimed depreciation is recaptured at up to 25%, and gains may owe capital-gains tax (a 1031 exchange can defer both). Figures are a year-1 estimate at your 24.0% rate — not tax advice; consult a CPA.
Schools (NCES district)
- District
- Bay
- NCES district ID
- 1200090
- Math proficiency
- 51% ▼ -8.00%
- Reading proficiency
- 51% ▼ -7.00%
- Median HH income
- $47,740
- Composite
- 43.41/100
- National rank
- #3014
- State rank
- #29 of 73 in FL
Livability — Laguna Beach
- Score
- 74/100
- State rank
- #283
- US rank
- #4522
Category grades
Schools grade is shown separately in the Schools card above.
Census & demographics
- County
- Bay County · 163,593 people
- Metro
- Panama City, FL
- Population (ZIP)
- 15,453
- Household income
- $80,039
- Rent vs Own
- Severe rent burden
- 531.0
Population outlook (Bay County) Hauer SSP2
- Today (2025)
- 206,264 people
- By 2030
- 217,740 · +5.6%
- By 2040
- 238,738 · +15.7%
- By 2050
- 255,545 · +23.9%
- By 2075
- 288,295 · +39.8%
- By 2100
- 288,638 · +39.9%
Race, ethnicity, and origin ACS 2023
- Neighborhood character
- Predominantly White (87%)
- Race & ethnicity
- White 87% Hispanic / Latino 8% Two or more races 6% Black 1%
- Hispanic origin (detail)
- Mexican 1% Puerto Rican 2%
- Common ancestry
- Slovak 3% Italian 3% Lithuanian 2%
- Foreign-born
- 8% · Canada, Jamaica
- Languages at home
- 91% English-only · Spanish 6% Other Indo-European 1% Russian/Polish/Slavic 0%
Political lean MEDSL · Bay
- 2024 margin
- Solid R (+47.4) · D 25.8% · R 73.1% · Other 1.1%
- 2008→2024 swing
- -6.6pp toward R · 2008: -40.7pp · 2024: -47.4pp
- All cycles
- 2024: R+47.4 2020: R+43.5 2016: R+46.3 2012: R+43.6 2008: R+40.7
Not yet ingested
- Civics
- —
Market trends
- HPI YoY
- ▼ -185.97%
- Current HPI
- 354.7469
- Rent YoY
- ▲ 0.52%
- Metro
- Panama City, FL
- State GDP YoY
- ▲ 3.28%
- F500 in state
- 36
Industry mix (Fortune 500 HQ in FL)
| Industry | F500 HQs | Revenue |
|---|---|---|
| Industrial Technology | 2 | $29B |
|
||
| Insurance | 2 | $17B |
|
||
| Retail | 1 | $60B |
|
||
| Technology Distribution | 1 | $58B |
|
||
| Homebuilding | 1 | $35B |
|
||
| Technology Manufacturing | 1 | $35B |
|
||
Price history
+408.2% since first listed3 events — show timeline
- 2026-06-02 Price Changed $279,000 CPARMLS
- 2026-05-07 Listed $289,000 CPARMLS
- 1999-07-01 Sold (Public Records) $54,900 Public Records
Property tax history
+2.2%/yrLatest (2025): $377 · +2.3% YoY. Source: county tax records.
Cash-flow waterfall
monthlySold comps — $/sqft
last 12 mo · ≤1 miLoading sold comps…