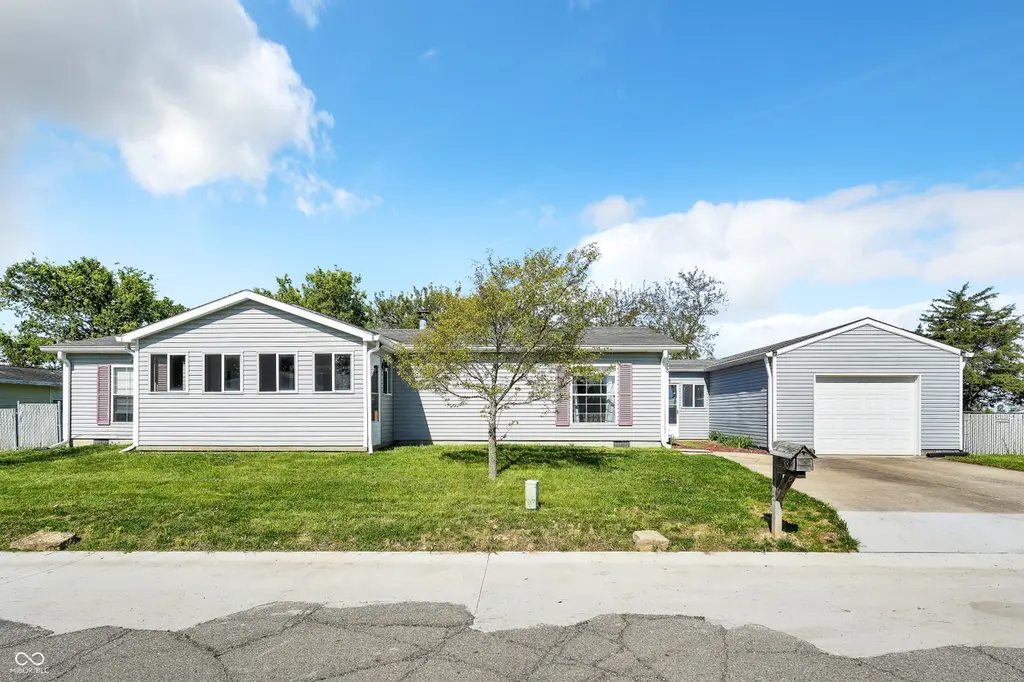
38 Fountain Lake Dr · Greenfield, IN
Flood risk 1/10 · Minimal
- FEMA flood zone
- X (unshaded)
- Chance of flooding over 30 yrs
- 0.0%
- Est. flood insurance / yr
- $507 – $1,088
Fire risk 1/10 · Minimal
- Est. fire insurance / yr
- $717 – $1,331
Heat risk 3/10 · Minor
- Hot days now (above 102°F)
- 7 days/yr
- Hot days in 30 yrs
- 18 days/yr
Wind risk 2/10 · Minimal
- Chance of severe wind over 30 yrs
- 1.0%
Air-quality risk 2/10 · Minimal
- Unhealthy air days now
- 1 days/yr
- Unhealthy air days in 30 yrs
- 2 days/yr
Risk factors via First Street. Map © Google.
Why this score? — see what drove the C grade
The composite is a weighted blend of 9 inputs, each scored 0–100. Each bar is that input's sub-score; the figure is the points it added to the 100-point composite (weight × sub-score).
- Cash flow +22.1/30.0
- ARV discount +11.0/15.0
- DSCR +7.1/10.0
- 1% rule +4.8/10.0
- Schools +4.0/10.0
- Livability +3.7/5.0
- Rent growth +3.2/5.0
- Condition / age +2.5/5.0
- Appreciation +0.0/10.0
$179,900
🖨 Deal sheet (PDF) 📄 Offer letter ✓ Due diligence
Listing remarks MLS
Totally updated and move-in ready. 3 Bedroom, 2 Bath fully fenced in Backyard. 40x16 bumper to bumper garage with plenty of workspace. Above ground pool.
Key facts
- Covered porch
- Covered breezeway
- Attached garage
Tags
Property features AI
Finance
- Other: Property is residential (manufactured) with mandatory fee ownership type; GPS-friendly directions
- HOA & community: HOA with a $25 monthly fee; HOA covers entrance/common area maintenance, snow removal, and sewer
Exterior
- Parking: Attached garage with keyless entry (2-car, approximately 640 sq ft)
- Security: Security system; Smoke detectors; Carbon monoxide detectors
- Utilities: Private water source; Community sewer; Cable available; Water connected; Sump pump
- Home design: Manufactured home; One level
- Construction: Vinyl siding; Block foundation
- Exterior features: Covered patio/breeze way; Mini barn; Full yard fencing; Mature trees; Street lights
Interior
- Kitchen: Dishwasher; Microwave; Electric oven; Range hood; Electric water heater; Water softener (owned)
- Bedrooms: 3 bedrooms on the main level; Primary bedroom with walk-in closet
- Flooring: Luxury vinyl plank flooring in kitchen and dining areas
- Bathrooms: 2 full bathrooms on the main level; Primary bath with full shower stall and double sinks
- Heating & cooling: Heat pump heating; Electric heating; Heat pump cooling
- Interior features: Vaulted ceilings; Eat-in kitchen; Pantry; Smart thermostat; Wood-burning fireplace (1)
- Laundry & utility: Main-level laundry
Neighborhood map
What this means for you Summary
Snapshot
- This is a 3-bed/2.0-bath manufactured listed at $180k.
Deal economics
- At list price, monthly cash flow is $288 ($3k/yr) — positive.
- The deal already cash-flows at list — no discount required.
- To meet the 1% rule (rent ≥ 1% of price), the offer needs to be $176k (2.3% below list).
- Recommended offer: $176k (2.3% below list) — sets the bar for 1% rule.
- Cap rate 8.2% vs local median 4.7% in Greenfield — top-decile yield for the area; either an underpriced asset or a hidden risk that comps aren't pricing in. Stress-test before assuming the spread holds.
Location & tenants
- Location reads 73/100 on livability (#88 in IN) — a middle-class / working-renter tenant base. Strengths: cost of living A+, housing A+; Watch: amenities F, commute F.
- Greenfield-Central Community Schools (other): math 47% / reading 45% proficiency, ranked #83 of 301 in IN (top 28%) — families likely to look elsewhere, expect single-tenant / working-renter base with shorter leases.
- Zoned schools: Greenfield-Central High School (math 37% / reading 65%, grade D+, #115 of 369 statewide, top 31%, 1,462 students, 35% FRL).
- Market conditions: Rents rising (+2.9%/yr); 481 active listings in the ZIP; solid renter incomes; 1,091 units permitted in Hancock County in 2024 (0 in 5+ unit buildings).
Forward outlook
- Local home prices are declining (-3.0%/yr); year-one equity from $1k of loan paydown is wiped out by about $5k of value loss. Plan a longer hold.
- Hancock County population projected at +7% by 2050 — modest demand growth; plan on rents tracking national, not racing it.
Negotiation context
- Only 3 days on market — expect competitive offers; lowballing is unlikely to land.
- 5 sale attempts since 25y ago with the ask held roughly flat each time — persistent listings suggest the price (not the market) is what's stuck; bring a comps-based counter.
- Current owner paid $127k; 42% above their basis — modest negotiation headroom, anchor on the comps not their cost.
Questions for the listing agent
- What does the HOA fee cover, when was the last increase, and are there any pending special assessments or reserve-fund shortfalls?
- Is there a deadline driving the sale (1031 exchange, divorce, estate, relocation)? That informs how much negotiation room exists.
- Schools are B-rated — typically a magnet for longer-tenancy family renters. What's the average tenant stay here, and is there a school-zone premium baked into asking?
- What's the average days-on-market for RENTAL listings here right now (not sales)? A rising rental-DOM trend means longer vacancies and softer asking-rent achievability than the comps imply.
- What's the recent tenant-quality profile in this submarket — average credit score on applications, eviction rate, late-payment / NSF rate, and stable-employment percentage? A property-management company in the area should have these aggregated.
- How much new for-sale + rental construction is in the pipeline within 1–3 miles? Heavy new supply typically softens prices + rents 12–24 months out; constrained supply supports both.
Investment metrics
- 1% rule
- 0.98% ✗
- Cap rate
- 8.22%
- Cash-on-cash
- 6.86%
- DSCR
- 1.31
- GRM
- 8.5
CMA / ARV
- ARV (on-the-fly)
- $195,104
- Comps found
- 2
Show comp detail 2 sales within ~0.75 mi
| Address | Dist | Beds/Ba | Sqft | Sold | Price | $/sf | Match |
|---|---|---|---|---|---|---|---|
| 14 Fountain Lake Dr | 0.11mi | 3/2.0 | 1,344 (-8%) | 12mo | $180,000 | $134 | 72 |
| 93 Fountain Lake Dr | 0.24mi | 3/2.0 | 1,344 (-8%) | 14mo | $170,000 | $126 | 64 |
Match score weights: distance 35% · size 25% · config 20% · recency 20%. Top-matched comps best support the ARV.
Projected returns pro-forma
-3.0% appreciation · 2.88% rent growth · sell at horizon
- IRR
- -5.9%
- Equity multiple
- 0.78×
- Total profit
- $-11,071
- Equity at exit
- $26,824
- IRR
- 3.5%
- Equity multiple
- 1.26×
- Total profit
- $12,876
- Equity at exit
- $15,554
Cash invested: $50,372 (down + closing). Projections, not guarantees.
Landlord ↔ Tenant lean methodology
- Overall (STATE)
- 90 Strongly Landlord-Friendly
- State Indiana
- 90 Strongly Landlord-Friendly · R+11
- County
- — inherits STATE
- City
- — inherits STATE
ZIP-level market 46140
- Rents YoY
- 2.9%
- Active inventory
- 481
- Price-to-rent
- 8.5×
Monthly cashflow live
- Estimated rent
- $1,758 medium interval (Pro) →
- Mortgage (P&I)
- −$943
- Tax from tax record
- −$57 /mo · $685/yr
- Insurance
- −$75
- HOA
- −$25
- Vacancy / Maint / Mgmt
- −$369
- Net cashflow
- $288
Break-even live
Sensitivity live
| Price | -10% $390 | -5% $339 | +0% $288 | +5% $237 | +10% $186 |
|---|---|---|---|---|---|
| Rent | -10% $149 | -5% $219 | +0% $288 | +5% $358 | +10% $427 |
| Rate | -1.0pp $379 | -0.5pp $334 | base $288 | +0.5pp $242 | +1.0pp $194 |
UW: 25.0% down · 7.5% · 30yr · 1.5% tax · 5.0% vac · 8.0% maint · 8.0% mgmt
Financing live
Cash to close
- Down payment
- $44,975
- Closing costs
- $5,397
- Reserves months
- —
- Total cash needed
- —
Loan-product check · same deal, 3 products live
Conventional
25% down · 7.5% · 30yr
- Down + closing
- —
- Monthly P&I
- —
- Monthly cashflow
- —
- DSCR
- —
- Eligible?
- —
Personal DTI + credit; lowest rate.
DSCR
20% down · 8.5% · 30yr
- Down + closing
- —
- Monthly P&I
- —
- Monthly cashflow
- —
- DSCR
- —
- Eligible?
- —
No personal income docs; deal must DSCR.
Hard money
10% down · 12.0% · 12mo
- Down + closing
- —
- Monthly P&I
- —
- Monthly cashflow
- —
- DSCR
- —
- Eligible?
- —
Short-term bridge; refi at stabilization.
HOA detail
- Monthly dues
- $25 · $300/yr
- Likely covers
- pool
Listing history 14 events
-
2026-05-15status Pending
-
2026-05-12$179,900 Active
-
2020-04-10soldstatus $127,000 Sold 153-char remark
Show marketing remark (153 chars)
Totally updated and move-in ready. 3 Bedroom, 2 Bath fully fenced in Backyard. 40x16 bumper to bumper garage with plenty of workspace. Above ground pool.
-
2020-03-02status Pending 153-char remark
Show marketing remark (153 chars)
Totally updated and move-in ready. 3 Bedroom, 2 Bath fully fenced in Backyard. 40x16 bumper to bumper garage with plenty of workspace. Above ground pool.
-
2020-02-28$125,000 Active 153-char remark
Show marketing remark (153 chars)
Totally updated and move-in ready. 3 Bedroom, 2 Bath fully fenced in Backyard. 40x16 bumper to bumper garage with plenty of workspace. Above ground pool.
-
2013-06-25historical 336-char remark
Show marketing remark (336 chars)
With a little TLC this home will be move in ready, Offers fantastic floorplan, Great room with fireplace, dream kitchen with soo many cabinets and counterspace, master bedroom with walk in closet. Enclosed front porch plus breezeway from utility room to garage. Community access to lake for fishing, golf course nearby. Immed possession
-
2013-06-21soldstatus $21,000 336-char remark
Show marketing remark (336 chars)
With a little TLC this home will be move in ready, Offers fantastic floorplan, Great room with fireplace, dream kitchen with soo many cabinets and counterspace, master bedroom with walk in closet. Enclosed front porch plus breezeway from utility room to garage. Community access to lake for fishing, golf course nearby. Immed possession
-
2013-02-28$21,000 336-char remark
Show marketing remark (336 chars)
With a little TLC this home will be move in ready, Offers fantastic floorplan, Great room with fireplace, dream kitchen with soo many cabinets and counterspace, master bedroom with walk in closet. Enclosed front porch plus breezeway from utility room to garage. Community access to lake for fishing, golf course nearby. Immed possession
-
2009-02-02soldstatus $22,470
-
2007-05-31soldstatus $81,900
-
2002-08-13$81,900
-
2001-03-01soldstatus $70,900
-
2001-02-28soldstatus $72,900
-
2001-01-29$72,900
ⓘ Source: listings_history table (triggers on properties + properties_extension) + one-shot
backfill from property_details.listing_events for pre-trigger history.
Tax reassessment forecast IN · Partial reset (capped growth)
- Current annual tax
- $685 · $57/mo
- Projected year-2 tax
- $1,107 · $92/mo
- Expected delta
- +$422/yr (+$35/mo · 61.7%)
ⓘ Screening estimate from a state-policy table — verify with the county assessor before closing.
Climate risk First Street
- Flood 1/10 Low FEMA zone X (unshaded) · 0% chance over 30 yrs
- Wildfire 1/10 Low
- Heat 3/10 Moderate 7 d/yr ≥102°F today · 18 d/yr by 30 yrs out
- Wind 2/10 Low 100% chance of damaging wind over 30 yrs
- Air quality 2/10 Low 1 unhealthy d/yr today · 2 by 30 yrs out
Nearby sold comps map
Loading sold comps map…
Walkable amenities ~0.75 mi
Loading nearby amenities…
Taxation est. · year 1
- Rental income
- $21,093
- − Mortgage interest
- −$10,077
- − Property taxes
- −$685
- − Insurance
- −$900
- − Repairs & maintenance
- −$1,687
- − Management
- −$1,687
- − HOA
- −$300
- − Depreciation
- −$5,233
- Taxable income
- $523
- Est. tax owed @ 24.0%
- −$126
- After-tax cash flow
- $3,332/yr
For passive investors: Depreciation is non-cash, so a rental often shows a tax loss while cash-flowing — sheltering income. Rental losses are passive: they offset passive income freely, and up to $25,000/yr can offset ordinary (W-2) income if you actively participate and your MAGI is under $100k (phasing out to $0 by $150k); unused losses carry forward. On sale, claimed depreciation is recaptured at up to 25%, and gains may owe capital-gains tax (a 1031 exchange can defer both). Figures are a year-1 estimate at your 24.0% rate — not tax advice; consult a CPA.
Schools (NCES district)
- District
- Greenfield-Central Community Schools
- NCES district ID
- 1804050
- Math proficiency
- 47% ▼ -12.00%
- Reading proficiency
- 45% ▼ -11.00%
- Median HH income
- $55,533
- Composite
- 40.01/100
- National rank
- #3827
- State rank
- #83 of 301 in IN
Livability — Greenfield
- Score
- 73/100
- State rank
- #88
- US rank
- #5094
Category grades
Schools grade is shown separately in the Schools card above.
Census & demographics
- County
- Hancock County · 59,521 people
- City population
- 43,511
- Metro
- Indianapolis-Carmel-Anderson, IN
- Population (ZIP)
- 43,511
- Household income
- $83,056
- Rent vs Own
- Severe rent burden
- 795.0
Population outlook (Hancock County) Hauer SSP2
- Today (2025)
- 77,820 people
- By 2030
- 79,914 · +2.7%
- By 2040
- 82,734 · +6.3%
- By 2050
- 83,348 · +7.1%
- By 2075
- 82,439 · +5.9%
- By 2100
- 74,181 · -4.7%
Race, ethnicity, and origin ACS 2023
- Neighborhood character
- Predominantly White (92%)
- Race & ethnicity
- White 92% Two or more races 5% Hispanic / Latino 3% Black 1%
- Common ancestry
- Italian 3% Lithuanian 3% Slovak 1%
- Foreign-born
- 3% · Canada
- Languages at home
- 96% English-only · Spanish 2% Other Indo-European 1%
Political lean MEDSL · Hancock
- 2024 margin
- Solid R (+33.7) · D 32.2% · R 65.9% · Other 1.9%
- 2008→2024 swing
- -4.1pp toward R · 2008: -29.6pp · 2024: -33.7pp
- All cycles
- 2024: R+33.7 2020: R+37.5 2016: R+44.8 2012: R+41.0 2008: R+29.6
Not yet ingested
- Civics
- —
Market trends
- HPI YoY
- ▼ -131.67%
- Current HPI
- 225.0367
- Rent YoY
- ▲ 2.88%
- Metro
- Indianapolis-Carmel-Anderson, IN
- State GDP YoY
- ▲ 2.90%
- F500 in state
- 18
Industry mix (Fortune 500 HQ in IN)
| Industry | F500 HQs | Revenue |
|---|---|---|
| Industrial Machinery | 2 | $37B |
|
||
| Healthcare | 1 | $177B |
|
||
| Pharmaceuticals | 1 | $45B |
|
||
| Metals / Steel | 1 | $18B |
|
||
| Agriculture | 1 | $17B |
|
||
| Packaging | 1 | $12B |
|
||
Price history
+146.8% since first listed14 events — show timeline
- 2026-05-15 Pending — MIBOR as Distributed by MLS Grid
- 2026-05-12 Listed $179,900 MIBOR as Distributed by MLS Grid
- 2020-04-10 Sold (MLS) $127,000 MIBOR as Distributed by MLS Grid
- 2020-03-02 Pending — MIBOR as Distributed by MLS Grid
- 2020-02-28 Listed $125,000 MIBOR as Distributed by MLS Grid
- 2013-06-25 Listing Removed — MIBOR as Distributed by MLS Grid
- 2013-06-21 Sold (MLS) $21,000 MIBOR as Distributed by MLS Grid
- 2013-02-28 Listed $21,000 MIBOR as Distributed by MLS Grid
- 2009-02-02 Sold (Public Records) $22,470 Public Records
- 2007-05-31 Sold (MLS) $81,900 MIBOR as Distributed by MLS Grid
- 2002-08-13 Listed $81,900 MIBOR as Distributed by MLS Grid
- 2001-03-01 Sold (Public Records) $70,900 Public Records
- 2001-02-28 Sold (MLS) $72,900 MIBOR as Distributed by MLS Grid
- 2001-01-29 Listed $72,900 MIBOR as Distributed by MLS Grid
Property tax history
+6.7%/yrLatest (2025): $685 · -6.2% YoY. Source: county tax records.
Cash-flow waterfall
monthlySold comps — $/sqft
last 12 mo · ≤1 miLoading sold comps…