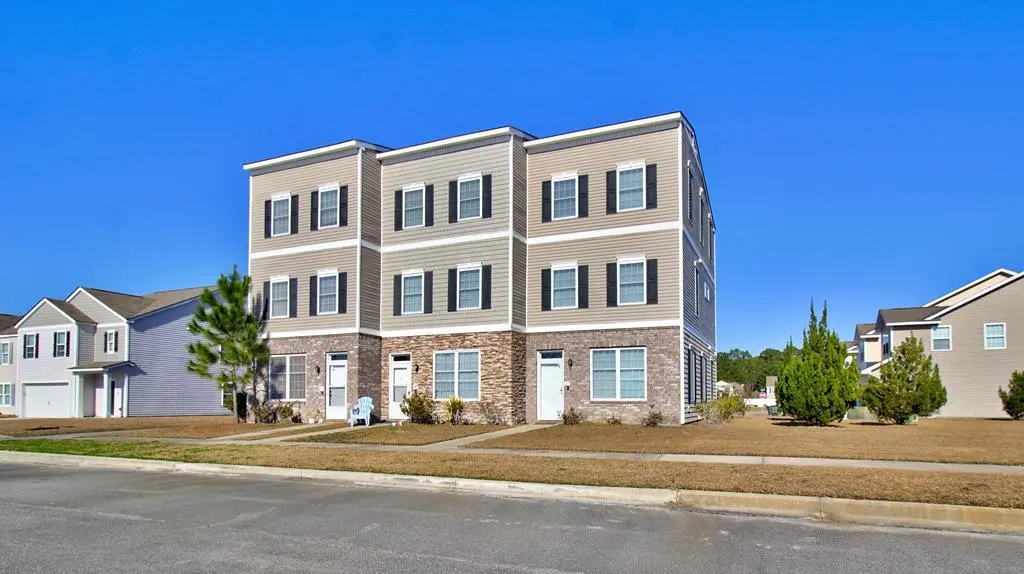
127 Davila St · Hinesville, GA
Flood risk 1/10 · Minimal
- FEMA flood zone
- X (shaded)
- Chance of flooding over 30 yrs
- 0.0%
- Est. flood insurance / yr
- $507 – $1,088
Fire risk 3/10 · Minor
- Est. fire insurance / yr
- $963 – $1,789
Heat risk 9/10 · Severe
- Hot days now (above 111°F)
- 7 days/yr
- Hot days in 30 yrs
- 19 days/yr
Wind risk 8/10 · Major
- Chance of severe wind over 30 yrs
- 98.0%
Air-quality risk 2/10 · Minimal
- Unhealthy air days now
- 2 days/yr
- Unhealthy air days in 30 yrs
- 2 days/yr
Risk factors via First Street. Map © Google.
Why this score? — see what drove the D grade
The composite is a weighted blend of 9 inputs, each scored 0–100. Each bar is that input's sub-score; the figure is the points it added to the 100-point composite (weight × sub-score).
- Cash flow +14.0/30.0
- ARV discount +7.5/15.0
- 1% rule +4.4/10.0
- DSCR +4.3/10.0
- Rent growth +3.9/5.0
- Livability +3.7/5.0
- Condition / age +2.5/5.0
- Schools +2.0/10.0
- Appreciation +0.0/10.0
$235,000
🖨 Deal sheet (PDF) 📄 Offer letter ✓ Due diligence
Listing remarks MLS
WOW! This home is right outside the commercial gate of Fort Stewart and sits on a corner lot with a lot of green space. There is LAMINATE WOOD FLOORING through the downstairs. It has 4 bedrooms and 2.5 baths. The kitchen features STAINLESS STEEL APPLIANCES, built in microwave and a pantry. The master bathroom has a GARDEN TUB and SEPARATE SHOWER. Out back is a one car GARAGE. There is additional parking in front of the house. On a hot summer day, the whole family can enjoy the COMMUNITY POOL! Don't delay, call for your showing appointment today!
Key facts
- 3 story townhome
- Laundry room
- Playground access
Tags
Property features AI
Finance
- HOA & community: Homeowners association with an annual fee of $900 (approximately $75/month); Subdivision: Liberty Park; Community amenities include a playground and a pool
Exterior
- Parking: 1 total parking space; 1 covered parking space; 1-car garage
- Utilities: Public water; Public sewer
- Home design: Single family residence; Residential property; Three or more levels
- Construction: Vinyl siding; Slab foundation
- Exterior features: Landscaped lot; Paved road frontage on a city street; No exterior amenities listed; Shingle roof
Interior
- Kitchen: Dishwasher; Electric range; Microwave; Refrigerator
- Bedrooms: Total rooms: 6
- Bathrooms: 2 full bathrooms; 1 half bathroom
- Heating & cooling: Central heating; Central air conditioning
- Interior features: Electric water heater; Dishwasher; Electric range; Microwave; Refrigerator; No fireplace
- Laundry & utility: Electric water heater
Neighborhood map
What this means for you Summary
Snapshot
- This is a 4-bed/2.5-bath condo listed at $235k.
Deal economics
- At list price, monthly cash flow is $32 ($387/yr) — positive.
- The deal already cash-flows at list — no discount required.
- To meet the 1% rule (rent ≥ 1% of price), the offer needs to be $221k (5.8% below list).
- Recommended offer: $221k (5.8% below list) — sets the bar for 1% rule.
- Cap rate 6.5% vs local median 5.2% in Hinesville — meaningfully above typical; check what's discounted (condition, days-on-market, listing class) to confirm the premium yield is real.
Location & tenants
- Location reads 73/100 on livability (#51 in GA) — a middle-class / working-renter tenant base. Strengths: cost of living A+, housing A+, health & safety A+; Watch: commute D+, crime F, employment D-.
- Liberty County (urban): math 19% / reading 28% proficiency, ranked #133 of 174 in GA (top 76%) — low school quality limits family demand, transient renter base, plan for 1-2y turnover.
- Zoned schools: Waldo Pafford Elementary School (math 21% / reading 26%, grade F, #790 of 1,228 statewide, top 65%, 831 students, 70% FRL); Snelson-Golden Middle School (math 13% / reading 24%, grade F, #372 of 470 statewide, top 80%, 876 students, 76% FRL); Bradwell Institute (math 12% / reading 27%, grade F, #243 of 424 statewide, top 59%, 1,755 students, 68% FRL) — zoned schools average 71% FRL vs 54% district-wide (17 pts higher); higher-poverty schools than district average — tighter screening recommended.
- Market conditions: Rents rising fast (+5.4%/yr); 639 active listings in the ZIP; 9 comparable units currently listed for rent nearby; rentals lingering (median 46d on market — plan ~5-8 weeks vacancy on turnover, expect pricing pressure); 100% of comp listings sitting > 30 days — soft ceiling on asking rent; 471 units permitted in Liberty County in 2024 (0 in 5+ unit buildings).
- This rent runs 44% of the median local income ($60k/yr) — at the standard rent-burdened threshold; future hikes will face affordability resistance.
Forward outlook
- Local home prices are declining (-3.0%/yr); year-one equity from $2k of loan paydown is wiped out by about $7k of value loss. Plan a longer hold.
- Liberty County population projected to shrink 8% by 2050 — rents likely to lag national; underwrite the cash flow, not the appreciation.
Negotiation context
- It's been on market 18 days — a 2% lower offer ($231k) is reasonable based on typical stale-listing flexibility.
- 7 sale attempts since 18y ago with the ask held roughly flat each time — persistent listings suggest the price (not the market) is what's stuck; bring a comps-based counter.
Risks & watch-outs
- Climate carrying-cost: severe wind risk, 98% chance of damaging wind over 30y; extreme-heat days projected 7→19/yr by 2055 (HVAC capex compounding) — expect insurance premiums to compound above CPI over the hold.
Questions for the listing agent
- What does the HOA fee cover, when was the last increase, and are there any pending special assessments or reserve-fund shortfalls?
- Any open or pending special assessments — roof, HVAC, plumbing, elevator, façade? What's the per-unit balance and payoff schedule, and is the seller paying it off at close or rolling it to the buyer?
- Is there a deadline driving the sale (1031 exchange, divorce, estate, relocation)? That informs how much negotiation room exists.
- Schools are D-rated, which usually means shorter tenancies and higher turnover. Who's the typical renter profile here, and what's been the actual vacancy rate?
- Crime grade is F in this area — have there been break-ins, vandalism, or insurance claims at this property in the last 3 years? What carrier currently insures it and at what premium?
- The area grade is low — what's the realistic commute time and amenity access for the typical tenant pool here? Any planned neighborhood developments (good or bad) we should know about?
- What's the average days-on-market for RENTAL listings here right now (not sales)? A rising rental-DOM trend means longer vacancies and softer asking-rent achievability than the comps imply.
- What's the recent tenant-quality profile in this submarket — average credit score on applications, eviction rate, late-payment / NSF rate, and stable-employment percentage? A property-management company in the area should have these aggregated.
- How much new apartment / multifamily construction is in the pipeline within 1–3 miles? Heavy new supply (>2% of stock underway) typically softens rents 12–24 months out; light construction supports rent growth.
Investment metrics
- 1% rule
- 0.94% ✗
- Cap rate
- 6.46%
- Cash-on-cash
- 0.59%
- DSCR
- 1.03
- GRM
- 8.8
CMA / ARV
No comps found within radius.
Projected returns pro-forma
-3.0% appreciation · 5.41% rent growth · sell at horizon
- IRR
- -12.5%
- Equity multiple
- 0.54×
- Total profit
- $-30,439
- Equity at exit
- $35,039
- IRR
- 0.0%
- Equity multiple
- 1.00×
- Total profit
- $208
- Equity at exit
- $20,319
Cash invested: $65,800 (down + closing). Projections, not guarantees.
Landlord ↔ Tenant lean methodology
- Overall (STATE)
- 90 Strongly Landlord-Friendly
- State Georgia
- 90 Strongly Landlord-Friendly · R+3
- County
- — inherits STATE
- City
- — inherits STATE
ZIP-level market 31313
- Home prices YoY
- -27.1%
- Rents YoY
- 5.4%
- Active inventory
- 639
- Price-to-rent
- 8.8×
Monthly cashflow live
- Estimated rent
- $2,214 high interval (Pro) →
- Mortgage (P&I)
- −$1,232
- Tax from tax record
- −$312 /mo · $3,740/yr
- Insurance
- −$98
- HOA
- −$75
- Vacancy / Maint / Mgmt
- −$465
- Net cashflow
- $32
Break-even live
Sensitivity live
| Price | -10% $165 | -5% $99 | +0% $32 | +5% $-34 | +10% $-101 |
|---|---|---|---|---|---|
| Rent | -10% $-143 | -5% $-55 | +0% $32 | +5% $120 | +10% $207 |
| Rate | -1.0pp $151 | -0.5pp $92 | base $32 | +0.5pp $-29 | +1.0pp $-91 |
UW: 25.0% down · 7.5% · 30yr · 1.5% tax · 5.0% vac · 8.0% maint · 8.0% mgmt
Financing live
Cash to close
- Down payment
- $58,750
- Closing costs
- $7,050
- Reserves months
- —
- Total cash needed
- —
Loan-product check · same deal, 3 products live
Conventional
25% down · 7.5% · 30yr
- Down + closing
- —
- Monthly P&I
- —
- Monthly cashflow
- —
- DSCR
- —
- Eligible?
- —
Personal DTI + credit; lowest rate.
DSCR
20% down · 8.5% · 30yr
- Down + closing
- —
- Monthly P&I
- —
- Monthly cashflow
- —
- DSCR
- —
- Eligible?
- —
No personal income docs; deal must DSCR.
Hard money
10% down · 12.0% · 12mo
- Down + closing
- —
- Monthly P&I
- —
- Monthly cashflow
- —
- DSCR
- —
- Eligible?
- —
Short-term bridge; refi at stabilization.
Rent comps 9 comps
| Address | Beds | Baths | Sqft | Rent | $/sqft | DOM | Units | Dist |
|---|---|---|---|---|---|---|---|---|
| 403 Valdez Ct Hinesville, GA | 3.0 | 2.5 | 1810 | $2,000 | $1.10 | 45d | 1 | 0.05mi |
| 501 Burke Dr Hinesville, GA | 1.0–3.0 | 1.0–2.0 | 1132 | $1,891 | $1.67 | 45d | 18 | 0.22mi |
| 34 Wythe St Hinesville, GA | 4.0 | 2.5 | 1978 | $2,200 | $1.11 | 45d | 1 | 0.23mi |
| 195 Courage Way Hinesville, GA | 3.0 | 2.5 | 1746 | $2,200 | $1.26 | 45d | 1 | 0.80mi |
| 222 Courage Way Hinesville, GA | 4.0 | 3.0 | 1984 | $2,150 | $1.08 | 45d | 1 | 0.84mi |
| 326 Joann Lewis Ln Hinesville, GA | 4.0 | 3.0 | 1793 | $2,150 | $1.20 | 45d | 1 | 0.93mi |
| 600 Brightleaf Cir Hinesville, GA | 3.0 | 2.5 | 1603 | $2,300 | $1.43 | 45d | 1 | 0.99mi |
| 1300 Independence Place Dr Hinesville, GA | 1.0–4.0 | 1.0–4.0 | 862 | $1,830 | $2.12 | 45d | 23 | 1.22mi |
| 264 Marron Way Hinesville, GA | 4.0 | 2.5 | 1997 | $2,200 | $1.10 | 45d | 1 | 1.46mi |
HOA detail condo
- Monthly dues
- $75 · $900/yr
- Likely covers
- pool
- Assessments
- None detected in remarks — confirm with the listing agent.
Listing history 14 events
-
2026-06-21days on market $235,000 Active 18 DOM
-
2026-06-19days on market $235,000 Active 16 DOM
-
2026-06-18days on market $235,000 Active 15 DOM
-
2026-06-17days on market $235,000 Active 14 DOM
-
2026-06-16days on market $235,000 Active 13 DOM
-
2026-06-15days on market $235,000 Active 12 DOM
-
2026-06-14days on market $235,000 Active 10 DOM
-
2026-06-13days on market $235,000 Active 9 DOM
-
2026-06-10days on market $235,000 Active 7 DOM
-
2026-06-09days on market $235,000 Active 6 DOM
-
2026-06-08days on market $235,000 Active 5 DOM
-
2026-06-07days on market $235,000 Active 4 DOM
-
2026-06-05remarks 699-char remark
-
2026-06-05$235,000 Active 1 DOM
ⓘ Source: listings_history table (triggers on properties + properties_extension) + one-shot
backfill from property_details.listing_events for pre-trigger history.
Tax reassessment forecast GA · Resets to sale price
- Current annual tax
- $3,740 · $312/mo
- Projected year-2 tax
- $3,740 · $312/mo
- Expected delta
- $0/yr ($0/mo · 0.0%)
ⓘ Screening estimate from a state-policy table — verify with the county assessor before closing.
Climate risk First Street
- Flood 1/10 Low FEMA zone X (shaded) · 0% chance over 30 yrs
- Wildfire 3/10 Moderate
- Heat 9/10 Extreme 7 d/yr ≥111°F today · 19 d/yr by 30 yrs out
- Wind 8/10 Severe 98% chance of damaging wind over 30 yrs
- Air quality 2/10 Low 2 unhealthy d/yr today · 2 by 30 yrs out
Nearby sold comps map
Loading sold comps map…
Walkable amenities ~0.75 mi
Loading nearby amenities…
Taxation est. · year 1
- Rental income
- $26,570
- − Mortgage interest
- −$13,164
- − Property taxes
- −$3,740
- − Insurance
- −$1,175
- − Repairs & maintenance
- −$2,126
- − Management
- −$2,126
- − HOA
- −$900
- − Depreciation
- −$6,836
- Taxable loss
- −$3,496
- Est. tax savings @ 24.0%
- +$839
- After-tax cash flow
- $1,226/yr
For passive investors: Depreciation is non-cash, so a rental often shows a tax loss while cash-flowing — sheltering income. Rental losses are passive: they offset passive income freely, and up to $25,000/yr can offset ordinary (W-2) income if you actively participate and your MAGI is under $100k (phasing out to $0 by $150k); unused losses carry forward. On sale, claimed depreciation is recaptured at up to 25%, and gains may owe capital-gains tax (a 1031 exchange can defer both). Figures are a year-1 estimate at your 24.0% rate — not tax advice; consult a CPA.
Schools (NCES district)
- District
- Liberty County
- NCES district ID
- 1303300
- Math proficiency
- 19% ▼ -16.00%
- Reading proficiency
- 28% ▼ -13.00%
- Median HH income
- $43,911
- Composite
- 20.2/100
- National rank
- #8630
- State rank
- #133 of 174 in GA
Livability — Hinesville
- Score
- 73/100
- State rank
- #51
- US rank
- #5200
Category grades
Schools grade is shown separately in the Schools card above.
Census & demographics
- Census place
- Hinesville, GA
- County
- Liberty County · 58,565 people
- City population
- 42,838
- Metro
- Hinesville, GA
- Population (ZIP)
- 42,838
- Household income
- $60,233
- Rent vs Own
- Severe rent burden
- 1693.0
Population outlook (Liberty County) Hauer SSP2
- Today (2025)
- 58,689 people
- By 2030
- 57,670 · -1.7%
- By 2040
- 55,750 · -5.0%
- By 2050
- 54,155 · -7.7%
- By 2075
- 58,947 · +0.4%
- By 2100
- 66,919 · +14.0%
Race, ethnicity, and origin ACS 2023
- Neighborhood character
- Diverse neighborhood (Simpson 0.67)
- Race & ethnicity
- Black 47% White 31% Hispanic / Latino 13% Two or more races 11% Asian 2%
- Hispanic origin (detail)
- Mexican 4% Puerto Rican 7%
- Common ancestry
- Slovak 1% Italian 1% Lithuanian 1%
- Foreign-born
- 7% · Canada, South Korea
- Languages at home
- 86% English-only · Spanish 7% Other Indo-European 2% German/W. Germanic 1%
Political lean MEDSL · Liberty
- 2024 margin
- D (+17.4) · D 58.5% · R 41.0%
- 2008→2024 swing
- -10.9pp toward R · 2008: 28.4pp · 2024: 17.4pp
- All cycles
- 2024: D+17.4 2020: D+24.1 2016: D+21.2 2012: D+30.2 2008: D+28.4
Not yet ingested
- Civics
- —
Market trends
- HPI YoY
- ▼ -77.50%
- Current HPI
- 208.0927
- Rent YoY
- ▲ 5.41%
- Metro
- Hinesville, GA
- State GDP YoY
- ▲ 2.66%
- F500 in state
- 28
Industry mix (Fortune 500 HQ in GA)
| Industry | F500 HQs | Revenue |
|---|---|---|
| Paper / Packaging | 2 | $29B |
|
||
| Retail | 1 | $160B |
|
||
| Transportation / Logistics | 1 | $91B |
|
||
| Airlines | 1 | $62B |
|
||
| Consumer Goods | 1 | $47B |
|
||
| Utilities | 1 | $25B |
|
||
Price history
+32.1% since first listed18 events — show timeline
- 2026-06-03 Listed $235,000 HABR
- 2024-08-07 Sold (Public Records) $293,000 Public Records
- 2020-08-03 Sold (Public Records) $123,000 Public Records
- 2020-07-29 Sold (MLS) $123,000 HABR
- 2020-07-29 Sold (MLS) $123,000 Hive MLS
- 2020-03-17 Listed $128,900 HABR
- 2020-03-17 Listed $128,900 Hive MLS
- 2018-05-10 Sold (Public Records) $112,000 Public Records
- 2018-05-08 Sold (MLS) $112,000 Hive MLS
- 2018-05-07 Sold (MLS) $112,000 GAMLS
- 2018-03-05 Listed $120,000 GAMLS
- 2018-03-05 Listed $120,000 Hive MLS
- 2016-03-03 Delisted — HABR
- 2015-10-09 Listed $143,500 HABR
- 2015-09-08 Sold (Public Records) $127,600 Public Records
- 2012-10-15 Sold (Public Records) $417,427 Public Records
- 2008-09-12 Listing Removed — GIAR
- 2008-04-02 Listed $177,900 GIAR
Property tax history
+4.6%/yrLatest (2025): $3,740 · +0.6% YoY. Source: county tax records.
Cash-flow waterfall
monthlySold comps — $/sqft
last 12 mo · ≤1 miLoading sold comps…