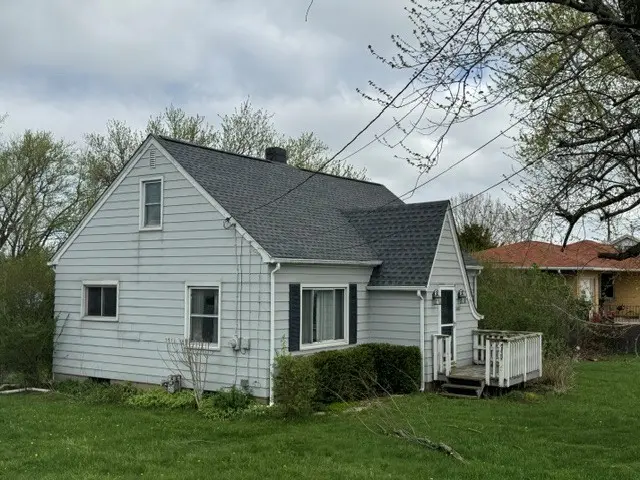
2222 W 38th St · Erie, PA
Flood risk 1/10 · Minimal
- FEMA flood zone
- X (unshaded)
- Chance of flooding over 30 yrs
- 0.0%
- Est. flood insurance / yr
- $473 – $860
Fire risk 1/10 · Minimal
- Est. fire insurance / yr
- $511 – $949
Heat risk 2/10 · Minimal
- Hot days now (above 90°F)
- 7 days/yr
- Hot days in 30 yrs
- 16 days/yr
Wind risk 1/10 · Minimal
- Chance of severe wind over 30 yrs
- —
Air-quality risk 2/10 · Minimal
- Unhealthy air days now
- 1 days/yr
- Unhealthy air days in 30 yrs
- 3 days/yr
Risk factors via First Street. Map © Google.
Why this score? — see what drove the B+ grade
The composite is a weighted blend of 9 inputs, each scored 0–100. Each bar is that input's sub-score; the figure is the points it added to the 100-point composite (weight × sub-score).
- Cash flow +30.0/30.0
- ARV discount +15.0/15.0
- DSCR +10.0/10.0
- 1% rule +9.5/10.0
- Schools +4.8/10.0
- Livability +4.2/5.0
- Rent growth +2.5/5.0
- Condition / age +2.5/5.0
- Appreciation +0.0/10.0
$150,000
🖨 Deal sheet (PDF) 📄 Offer letter ✓ Due diligence
Listing remarks
SW Millcreek cape cod with 4 bedrooms and 2 full baths - pretty back yard fenced in and room for your garden. Conveniently located and located near shopping and McDowell school campus. White kitchen with hi-mac countertop, stainless appliances and beautiful hardwood flooring. Full basement partially finished - bring those finishing touches and make this home yours!
Key facts
- Stainless appliances
- White kitchen
- Room for your garden
Tags
Neighborhood map
What this means for you Summary
Snapshot
- This is a 3-bed/1.0-bath single-family listed at $150k.
Deal economics
- At list price, monthly cash flow is $673 ($8k/yr) — positive.
- The deal already cash-flows at list — no discount required.
- Meets the 1% rule at list price ($2k rent vs $150k).
- Cap rate 11.7% vs local median 5.1% in Erie — top-decile yield for the area; either an underpriced asset or a hidden risk that comps aren't pricing in. Stress-test before assuming the spread holds.
Location & tenants
- Location reads 83/100 on livability (#109 in PA, #840 nationally) — a professional / high-income tenant draw. Strengths: amenities A+, commute A+, cost of living A+; Watch: crime D+, employment F.
- Millcreek Township SD (suburban): math 46% / reading 65% proficiency, ranked #105 of 539 in PA (top 20%) — acceptable for families but not a draw, mixed tenant base, ~2y average lease.
- Zoned schools: Grandview El Sch (math 55% / reading 69%, grade B, #313 of 1,518 statewide, top 24%, 659 students, 46% FRL); Walnut Creek Ms (math 43% / reading 72%, grade B, #61 of 512 statewide, top 13%, 449 students, 31% FRL); Mcdowell Hs (math 76% / reading 50%, grade B-, #72 of 437 statewide, top 16%, 2,205 students, 40% FRL).
- Market conditions: 99 active listings in the ZIP; 7 comparable units currently listed for rent nearby; rentals lingering (median 46d on market — plan ~5-8 weeks vacancy on turnover, expect pricing pressure); 100% of comp listings sitting > 30 days — soft ceiling on asking rent; solid renter incomes; 364 units permitted in Erie County in 2024 (188 in 5+ unit buildings).
- This rent runs 32% of the median local income ($81k/yr) — at the standard rent-burdened threshold; future hikes will face affordability resistance.
Forward outlook
- Local home prices are declining (-3.0%/yr); year-one equity from $1k of loan paydown is wiped out by about $4k of value loss. Plan a longer hold.
- Erie County population projected at -14% by 2050 — secular population decline; favor cash flow + early exit over multi-decade hold.
- At projected returns (-3.0% appreciation + 3.0% rent growth), your $42k cash investment doubles in ~7 years — after that, you're playing with house money.
Negotiation context
- Only 8 days on market — expect competitive offers; lowballing is unlikely to land.
- Current owner paid $81k; list at $150k implies a 85% gain — meaningful room to come down on a strong offer.
Risks & watch-outs
- Watch-outs: built in 1954 — expect roof / HVAC / electrical / plumbing capex.
Questions for the listing agent
- Built in 1954 — when were the roof, HVAC, electrical panel, plumbing, and water heater last replaced?
- Is there a deadline driving the sale (1031 exchange, divorce, estate, relocation)? That informs how much negotiation room exists.
- Crime grade is D in this area — have there been break-ins, vandalism, or insurance claims at this property in the last 3 years? What carrier currently insures it and at what premium?
- What's the average days-on-market for RENTAL listings here right now (not sales)? A rising rental-DOM trend means longer vacancies and softer asking-rent achievability than the comps imply.
- What's the recent tenant-quality profile in this submarket — average credit score on applications, eviction rate, late-payment / NSF rate, and stable-employment percentage? A property-management company in the area should have these aggregated.
- How much new for-sale + rental construction is in the pipeline within 1–3 miles? Heavy new supply typically softens prices + rents 12–24 months out; constrained supply supports both.
Investment metrics
- 1% rule
- 1.45% ✓
- Cap rate
- 11.68%
- Cash-on-cash
- 19.24%
- DSCR
- 1.86
- GRM
- 5.7
CMA / ARV
- ARV (on-the-fly)
- $192,399
- Comps found
- 12
Show comp detail 12 sales within ~0.75 mi
| Address | Dist | Beds/Ba | Sqft | Sold | Price | $/sf | Match |
|---|---|---|---|---|---|---|---|
| 2222 W 38th St | 0.00mi | 4/2.0 (+1) | 1,087 (0%) | 1mo | $160,000 | $147 | 90 |
| 2114 Canton Ave | 0.21mi | 3/1.0 | 1,104 (+2%) | 1mo | $153,000 | $139 | 87 |
| 3723 Court Ave | 0.03mi | 3/1.0 | 1,162 (+7%) | 7mo | $85,000 | $73 | 82 |
| 2408 W 36th St | 0.29mi | 3/1.5 | 1,114 (+2%) | 3mo | $279,900 | $251 | 78 |
| 3001 Highland Rd | 0.57mi | 3/1.0 | 1,139 (+5%) | 1mo | $240,000 | $211 | 65 |
| 3621 Ellsworth Ave | 0.59mi | 4/2.0 (+1) | 1,136 (+4%) | 7mo | $210,000 | $185 | 50 |
| 2936 Rudolph Ave | 0.62mi | 2/1.5 (-1) | 996 (-8%) | 1mo | $191,500 | $192 | 49 |
| 2918 Hudson Rd | 0.72mi | 3/1.0 | 1,199 (+10%) | 2mo | $162,900 | $136 | 48 |
| 3025 Berkley Rd | 0.58mi | 3/2.0 | 1,206 (+11%) | 5mo | $175,000 | $145 | 47 |
| 4041 Calico Dr | 0.71mi | 3/2.0 | 1,167 (+7%) | 6mo | $275,000 | $236 | 46 |
| 4002 Harvard Rd | 0.63mi | 3/2.0 | 1,200 (+10%) | 4mo | $212,000 | $177 | 45 |
| 1949 W 36th St | 0.36mi | 4/2.0 (+1) | 1,247 (+15%) | 6mo | $168,400 | $135 | 44 |
Match score weights: distance 35% · size 25% · config 20% · recency 20%. Top-matched comps best support the ARV.
Projected returns pro-forma
-3.0% appreciation · 3.0% rent growth · sell at horizon
- IRR
- 11.2%
- Equity multiple
- 1.44×
- Total profit
- $18,618
- Equity at exit
- $22,365
- IRR
- 20.2%
- Equity multiple
- 2.70×
- Total profit
- $71,589
- Equity at exit
- $12,969
Cash invested: $42,000 (down + closing). Projections, not guarantees.
Landlord ↔ Tenant lean methodology
- Overall (STATE)
- 62 Landlord-Friendly
- State Pennsylvania
- 62 Landlord-Friendly · EVEN
- County
- — inherits STATE
- City
- — inherits STATE
ZIP-level market 16506
- Active inventory
- 99
- Price-to-rent
- 5.7×
Monthly cashflow live
- Estimated rent
- $2,174 high interval (Pro) →
- Mortgage (P&I)
- −$787
- Tax from tax record
- −$195 /mo · $2,341/yr
- Insurance
- −$62
- HOA
- −$0
- Vacancy / Maint / Mgmt
- −$457
- Net cashflow
- $673
Break-even live
Sensitivity live
| Price | -10% $758 | -5% $716 | +0% $673 | +5% $631 | +10% $588 |
|---|---|---|---|---|---|
| Rent | -10% $502 | -5% $587 | +0% $673 | +5% $759 | +10% $845 |
| Rate | -1.0pp $749 | -0.5pp $712 | base $673 | +0.5pp $635 | +1.0pp $595 |
UW: 25.0% down · 7.5% · 30yr · 1.5% tax · 5.0% vac · 8.0% maint · 8.0% mgmt
Financing live
Cash to close
- Down payment
- $37,500
- Closing costs
- $4,500
- Reserves months
- —
- Total cash needed
- —
Loan-product check · same deal, 3 products live
Conventional
25% down · 7.5% · 30yr
- Down + closing
- —
- Monthly P&I
- —
- Monthly cashflow
- —
- DSCR
- —
- Eligible?
- —
Personal DTI + credit; lowest rate.
DSCR
20% down · 8.5% · 30yr
- Down + closing
- —
- Monthly P&I
- —
- Monthly cashflow
- —
- DSCR
- —
- Eligible?
- —
No personal income docs; deal must DSCR.
Hard money
10% down · 12.0% · 12mo
- Down + closing
- —
- Monthly P&I
- —
- Monthly cashflow
- —
- DSCR
- —
- Eligible?
- —
Short-term bridge; refi at stabilization.
Rent comps 7 comps
| Address | Beds | Baths | Sqft | Rent | $/sqft | DOM | Units | Dist |
|---|---|---|---|---|---|---|---|---|
| 2857 Willowood Dr Unit 2901 Erie, PA | 2.0 | 1.5 | 1300 | $1,750 | $1.35 | 45d | 1 | 0.78mi |
| 4500 Hammocks Dr Erie, PA | 2.0–3.0 | 2.0 | 1312 | $3,270 | $2.49 | 45d | 7 | 0.79mi |
| 4536 Hammocks Dr Unit 542401 Erie, PA | 2.0 | 2.0 | 1327 | $2,160 | $1.63 | 45d | 1 | 0.80mi |
| 4536 Hammocks Dr Unit 536404 Erie, PA | 3.0 | 2.0 | 1416 | $2,290 | $1.62 | 45d | 1 | 0.80mi |
| 4536 Hammocks Dr Unit 536204 Erie, PA | 3.0 | 2.0 | 1416 | $2,275 | $1.61 | 45d | 1 | 0.80mi |
| 4024 Canterbury Dr Erie, PA | 2.0 | 1.5 | 1044 | $1,350 | $1.29 | 45d | 1 | 1.12mi |
| 3158 W 40th St Erie, PA | 2.0 | 2.0 | 1024 | $1,280 | $1.25 | 45d | 1 | 1.20mi |
Listing history 4 events
-
2026-04-24status Pending
-
2026-04-16$150,000 Active
-
2005-05-04soldstatus $81,000
-
1995-08-22soldstatus $77,500
ⓘ Source: listings_history table (triggers on properties + properties_extension) + one-shot
backfill from property_details.listing_events for pre-trigger history.
Tax reassessment forecast PA · Partial reset (capped growth)
- Current annual tax
- $2,341 · $195/mo
- Projected year-2 tax
- $2,355 · $196/mo
- Expected delta
- +$15/yr (+$1/mo · 0.6%)
ⓘ Screening estimate from a state-policy table — verify with the county assessor before closing.
Climate risk First Street
- Flood 1/10 Low FEMA zone X (unshaded) · 0% chance over 30 yrs
- Wildfire 1/10 Low
- Heat 2/10 Low 7 d/yr ≥90°F today · 16 d/yr by 30 yrs out
- Wind 1/10 Low
- Air quality 2/10 Low 1 unhealthy d/yr today · 3 by 30 yrs out
Nearby sold comps map
Loading sold comps map…
Walkable amenities ~0.75 mi
Loading nearby amenities…
Taxation est. · year 1
- Rental income
- $26,090
- − Mortgage interest
- −$8,402
- − Property taxes
- −$2,341
- − Insurance
- −$750
- − Repairs & maintenance
- −$2,087
- − Management
- −$2,087
- − Depreciation
- −$4,364
- Taxable income
- $6,058
- Est. tax owed @ 24.0%
- −$1,454
- After-tax cash flow
- $6,626/yr
For passive investors: Depreciation is non-cash, so a rental often shows a tax loss while cash-flowing — sheltering income. Rental losses are passive: they offset passive income freely, and up to $25,000/yr can offset ordinary (W-2) income if you actively participate and your MAGI is under $100k (phasing out to $0 by $150k); unused losses carry forward. On sale, claimed depreciation is recaptured at up to 25%, and gains may owe capital-gains tax (a 1031 exchange can defer both). Figures are a year-1 estimate at your 24.0% rate — not tax advice; consult a CPA.
Schools (NCES district)
- District
- Millcreek Township SD
- NCES district ID
- 4215330
- Math proficiency
- 46% ▼ -13.00%
- Reading proficiency
- 65% ▼ -9.00%
- Median HH income
- $55,734
- Composite
- 47.82/100
- National rank
- #2224
- State rank
- #105 of 539 in PA
Livability — Erie
- Score
- 83/100
- State rank
- #109
- US rank
- #840
Category grades
Schools grade is shown separately in the Schools card above.
Census & demographics
- County
- Erie County · 92,215 people
- City population
- 92,215
- Metro
- Erie, PA
- Population (ZIP)
- 24,070
- Household income
- $81,060
- Rent vs Own
- Severe rent burden
- 894.0
Population outlook (Erie County) Hauer SSP2
- Today (2025)
- 272,159 people
- By 2030
- 266,299 · -2.2%
- By 2040
- 250,987 · -7.8%
- By 2050
- 234,925 · -13.7%
- By 2075
- 199,164 · -26.8%
- By 2100
- 162,985 · -40.1%
Race, ethnicity, and origin ACS 2023
- Neighborhood character
- Predominantly White (88%)
- Race & ethnicity
- White 88% Two or more races 5% Asian 4% Black 2% Hispanic / Latino 2%
- Common ancestry
- Romanian 11% Italian 2% Lithuanian 1%
- Foreign-born
- 5% · Canada, China
- Languages at home
- 93% English-only · Other Indo-European 2% Spanish 1% Russian/Polish/Slavic 1%
Political lean MEDSL · Erie
- 2024 margin
- Toss-up / Even · D 49.0% · R 50.0%
- 2008→2024 swing
- -20.9pp toward R · 2008: 19.9pp · 2024: -1.0pp
- All cycles
- 2024: R+1.0 2020: D+1.0 2016: R+2.0 2012: D+16.9 2008: D+19.9
Not yet ingested
- Civics
- —
Market trends
- HPI YoY
- ▼ -152.21%
- Current HPI
- 228.7506
- Rent YoY
- —
- Metro
- Erie, PA
- State GDP YoY
- ▲ 1.68%
- F500 in state
- 34
Industry mix (Fortune 500 HQ in PA)
| Industry | F500 HQs | Revenue |
|---|---|---|
| Healthcare | 2 | $309B |
|
||
| Insurance | 2 | $27B |
|
||
| Telecommunications / Media | 1 | $124B |
|
||
| Industrial Distribution | 1 | $22B |
|
||
| Financial Services | 1 | $20B |
|
||
| Chemicals / Materials | 1 | $18B |
|
||
Price history
+93.5% since first listed4 events — show timeline
- 2026-04-24 Pending — GEBOR
- 2026-04-16 Listed $150,000 GEBOR
- 2005-05-04 Sold (Public Records) $81,000 Public Records
- 1995-08-22 Sold (Public Records) $77,500 Public Records
Property tax history
+2.5%/yrLatest (2026): $2,341 · +3.6% YoY. Source: county tax records.
Cash-flow waterfall
monthlySold comps — $/sqft
last 12 mo · ≤1 miLoading sold comps…