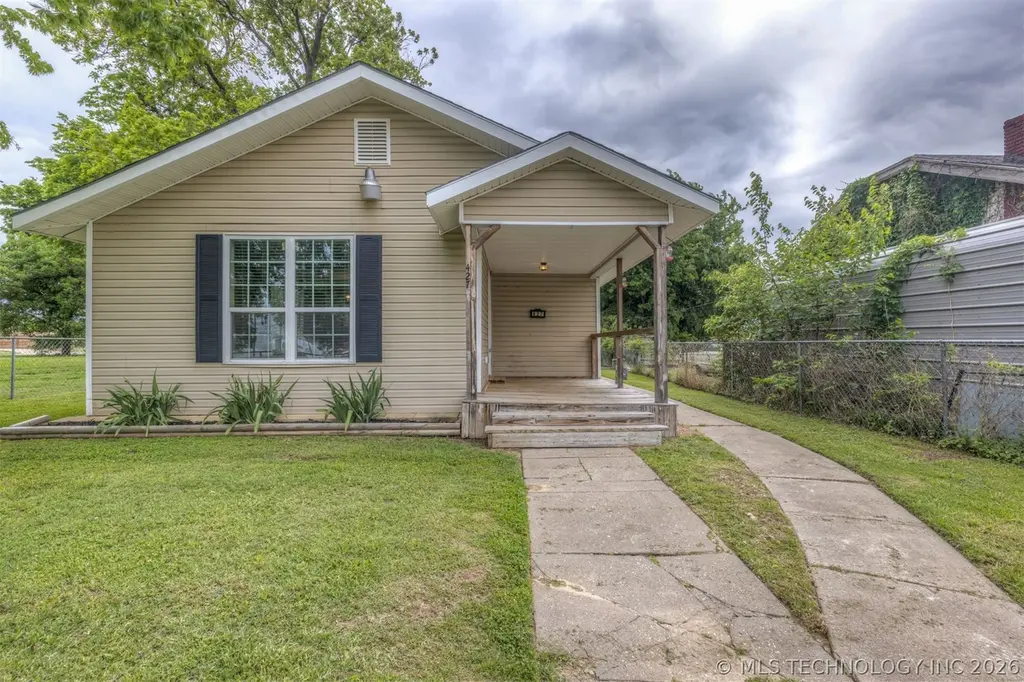
427 S Trenton Ave · Tulsa, OK
Flood risk 4/10 · Minor
- FEMA flood zone
- X (unshaded)
- Chance of flooding over 30 yrs
- 0.22%
- Est. flood insurance / yr
- $507 – $1,088
Fire risk 1/10 · Minimal
- Est. fire insurance / yr
- $2,463 – $4,575
Heat risk 6/10 · Moderate
- Hot days now (above 110°F)
- 7 days/yr
- Hot days in 30 yrs
- 18 days/yr
Wind risk 2/10 · Minimal
- Chance of severe wind over 30 yrs
- 4.0%
Air-quality risk 2/10 · Minimal
- Unhealthy air days now
- 2 days/yr
- Unhealthy air days in 30 yrs
- 2 days/yr
Risk factors via First Street. Map © Google.
Why this score? — see what drove the D- grade
The composite is a weighted blend of 9 inputs, each scored 0–100. Each bar is that input's sub-score; the figure is the points it added to the 100-point composite (weight × sub-score).
- Cash flow +16.2/30.0
- DSCR +5.0/10.0
- 1% rule +4.2/10.0
- Livability +3.8/5.0
- Rent growth +2.8/5.0
- Condition / age +2.5/5.0
- Schools +0.8/10.0
- ARV discount +0.0/15.0
- Appreciation +0.0/10.0
$212,500
🖨 Deal sheet 📄 Offer letter ✓ Due diligence
Listing remarks MLS
Step into this charming 3-bed, 2-bath home, freshly updated and ready for you! Featuring new windows, flooring, and paint, the interior feels bright and inviting. The kitchen shines with modern cabinets, granite countertops, and stainless steel appliances. Both bathrooms showcase new tile for a contemporary feel. Stay cozy with a new hot water heater and AC unit. Outside, a lovely landscape complements the brand-new back deck. This home offers style, function, and a turnkey experience for its new owners.
Key facts
- Updated bathrooms
- Updated kitchen
- 7,000 sq ft lot
Tags
Property features AI
Exterior
- Security: Smoke detector(s); No safety shelter
- Utilities: Electricity available; Natural gas available; Public water; Public sewer
- Home design: Single-story; Faces west; Crawlspace foundation
- Construction: Built from vinyl siding and wood frame; Asphalt/fiberglass roof
- Exterior features: Covered porch; Porch; Storage structure; Chain link full fencing
Interior
- Kitchen: Oven; Range; Dishwasher; Refrigerator; Disposal; Granite counters
- Flooring: Laminate flooring; Tile flooring
- Bathrooms: 2 full bathrooms
- Heating & cooling: Central heating (gas); Central air conditioning
- Interior features: Granite counters; Ceiling fan(s); Electric range connection; Gas oven connection; Vinyl windows
- Laundry & utility: Washer hookup; Electric dryer hookup; Washer; Dryer; Electric water heater
Neighborhood map
What this means for you Summary
Snapshot
- This is a 3-bed/1.0-bath single-family listed at $212k.
Deal economics
- At list price, monthly cash flow is $111 ($1k/yr) — positive.
- The deal already cash-flows at list — no discount required.
- To meet the 1% rule (rent ≥ 1% of price), the offer needs to be $195k (8.1% below list).
- Recommended offer: $195k (8.1% below list) — sets the bar for 1% rule.
- Cap rate 6.9% vs local median 3.9% in Tulsa — top-decile yield for the area; either an underpriced asset or a hidden risk that comps aren't pricing in. Stress-test before assuming the spread holds.
Location & tenants
- Location reads 75/100 on livability (#13 in OK, #4,058 nationally) — a middle-class / working-renter tenant base. Strengths: amenities A+, commute A+, cost of living A+; Watch: schools F, crime F, employment D-.
- Tulsa (urban): math 7% / reading 12% proficiency, ranked #250 of 270 in OK (top 93%) — low school quality limits family demand, transient renter base, plan for 1-2y turnover; 76% free/reduced lunch — lower-income household profile, screen leases tightly.
- Market conditions: Rents rising (+1.2%/yr); 30 active listings in the ZIP; 40 comparable units currently listed for rent nearby; rentals leasing fast (median 12d on market — plan ~1-2 weeks tenant-placement turnaround); 2,818 units permitted in Tulsa County in 2024 (518 in 5+ unit buildings).
- This rent runs 34% of the median local income ($68k/yr) — at the standard rent-burdened threshold; future hikes will face affordability resistance.
Forward outlook
- Local home prices are declining (-3.0%/yr); year-one equity from $1k of loan paydown is wiped out by about $6k of value loss. Plan a longer hold.
- Tulsa County population projected at +30% by 2050 — long-run rental-demand tailwind backs the buy-and-hold thesis.
Negotiation context
- It's been on market 57 days — a 3% lower offer ($206k) is reasonable based on typical stale-listing flexibility.
- 4 sale attempts since 3y ago; this cycle's ask has dropped $18k (8%) from the opening price — seller is motivated, your offer sets the floor, not the list.
Risks & watch-outs
- Watch-outs: built in 1910 — expect roof / HVAC / electrical / plumbing capex.
- Climate carrying-cost: extreme-heat days projected 7→18/yr by 2055 (HVAC capex compounding) — expect insurance premiums to compound above CPI over the hold.
Questions for the listing agent
- It's been on market 57 days. Have you received any prior offers? Is the seller open to a 8% concession, seller financing, or rate buy-down credit?
- Built in 1910 — when were the roof, HVAC, electrical panel, plumbing, and water heater last replaced?
- Is there a deadline driving the sale (1031 exchange, divorce, estate, relocation)? That informs how much negotiation room exists.
- Schools are F-rated, which usually means shorter tenancies and higher turnover. Who's the typical renter profile here, and what's been the actual vacancy rate?
- Crime grade is F in this area — have there been break-ins, vandalism, or insurance claims at this property in the last 3 years? What carrier currently insures it and at what premium?
- The area grade is low — what's the realistic commute time and amenity access for the typical tenant pool here? Any planned neighborhood developments (good or bad) we should know about?
- What's the average days-on-market for RENTAL listings here right now (not sales)? A rising rental-DOM trend means longer vacancies and softer asking-rent achievability than the comps imply.
- What's the recent tenant-quality profile in this submarket — average credit score on applications, eviction rate, late-payment / NSF rate, and stable-employment percentage? A property-management company in the area should have these aggregated.
- How much new for-sale + rental construction is in the pipeline within 1–3 miles? Heavy new supply typically softens prices + rents 12–24 months out; constrained supply supports both.
Investment metrics
- 1% rule
- 0.92% ✗
- Cap rate
- 6.92%
- Cash-on-cash
- 2.25%
- DSCR
- 1.10
- GRM
- 9.1
CMA / ARV
- ARV (on-the-fly)
- $174,080
- Comps found
- 12
Show comp detail 12 sales within ~0.75 mi
| Address | Dist | Beds/Ba | Sqft | Sold | Price | $/sf | Match |
|---|---|---|---|---|---|---|---|
| 1739 E 8th St | 0.39mi | 3/2.0 | 1,248 (-2%) | 2mo | $110,000 | $88 | 72 |
| 410 S Xanthus Ave | 0.29mi | 3/2.0 | 1,344 (+5%) | 3mo | $245,000 | $182 | 72 |
| 601 S Yorktown Ave | 0.44mi | 3/2.0 | 1,300 (+2%) | 6mo | $235,000 | $181 | 68 |
| 1737 E 8th St | 0.39mi | 2/2.0 (-1) | 1,245 (-3%) | 2mo | $100,000 | $80 | 67 |
| 56 N Xanthus Ave | 0.57mi | 2/1.0 (-1) | 1,310 (+2%) | 1mo | $127,000 | $97 | 64 |
| 1020 S Quincy Ave | 0.51mi | 2/1.0 (-1) | 1,194 (-7%) | 1mo | $103,500 | $87 | 59 |
| 333 S Zunis Ave | 0.46mi | 3/2.0 | 1,162 (-9%) | 7mo | $120,000 | $103 | 53 |
| 2125 E 2nd St | 0.49mi | 3/2.0 | 1,414 (+10%) | 3mo | $230,000 | $163 | 53 |
| 2236 E 7th St | 0.60mi | 2/1.0 (-1) | 1,216 (-5%) | 12mo | $140,000 | $115 | 48 |
| 714 N Quincy Ave | 0.74mi | 3/2.0 | 1,240 (-3%) | 10mo | $195,000 | $157 | 47 |
| 1123 S Newport Ave | 0.73mi | 3/2.0 | 1,472 (+15%) | 0mo | $200,000 | $136 | 37 |
| 2504 E 4th St | 0.73mi | 2/1.0 (-1) | 1,093 (-15%) | 4mo | $179,000 | $164 | 33 |
Match score weights: distance 35% · size 25% · config 20% · recency 20%. Top-matched comps best support the ARV.
Projected returns pro-forma
-3.0% appreciation · 1.21% rent growth · sell at horizon
- IRR
- -14.7%
- Equity multiple
- 0.48×
- Total profit
- $-30,785
- Equity at exit
- $31,684
- IRR
- -9.2%
- Equity multiple
- 0.47×
- Total profit
- $-31,320
- Equity at exit
- $18,373
Cash invested: $59,500 (down + closing). Projections, not guarantees.
Landlord ↔ Tenant lean methodology
- Overall (STATE)
- 83 Strongly Landlord-Friendly
- State Oklahoma
- 83 Strongly Landlord-Friendly · R+20
- County
- — inherits STATE
- City
- — inherits STATE
ZIP-level market 74120
- Home prices YoY
- -29.1%
- Rents YoY
- 1.2%
- Active inventory
- 30
- Price-to-rent
- 9.1×
Monthly cashflow live
- Estimated rent
- $1,953 high interval (Pro) →
- Mortgage (P&I)
- −$1,114
- Tax from tax record
- −$228 /mo · $2,742/yr
- Insurance
- −$89
- HOA
- −$0
- Vacancy / Maint / Mgmt
- −$410
- Net cashflow
- $111
Break-even live
UW: 25.0% down · 7.5% · 30yr · 1.5% tax · 5.0% vac · 8.0% maint · 8.0% mgmt
Financing live
Cash to close
- Down payment
- $53,125
- Closing costs
- $6,375
- Reserves months
- —
- Total cash needed
- —
Loan-product check · same deal, 3 products live
Conventional
25% down · 7.5% · 30yr
- Down + closing
- —
- Monthly P&I
- —
- Monthly cashflow
- —
- DSCR
- —
- Eligible?
- —
Personal DTI + credit; lowest rate.
DSCR
20% down · 8.5% · 30yr
- Down + closing
- —
- Monthly P&I
- —
- Monthly cashflow
- —
- DSCR
- —
- Eligible?
- —
No personal income docs; deal must DSCR.
Hard money
10% down · 12.0% · 12mo
- Down + closing
- —
- Monthly P&I
- —
- Monthly cashflow
- —
- DSCR
- —
- Eligible?
- —
Short-term bridge; refi at stabilization.
Rent comps 40 comps
| Address | Beds | Baths | Sqft | Rent | $/sqft | DOM | Units | Dist |
|---|---|---|---|---|---|---|---|---|
| 624 S Peoria Ave Tulsa, OK | 3.0 | 1.0–2.5 | 1521 | $3,995 | $2.63 | 1d | 10 | 0.46mi |
| 1122 S Xanthus Pl Tulsa, OK | 2.0 | 1.0 | 1000 | $1,245 | $1.25 | 3d | 1 | 0.64mi |
| 1201 S Rockford Ave Unit 11 Tulsa, OK | 2.0 | 1.5 | 920 | $885 | $0.96 | 23d | 1 | 0.66mi |
| 1201 S Rockford Ave Unit 7 Tulsa, OK | 2.0 | 1.5 | 920 | $875 | $0.95 | 3d | 1 | 0.66mi |
| 2219 E 11th St Tulsa, OK | 1.0–3.0 | 1.0–3.0 | 1136 | $2,787 | $2.45 | 1d | 10 | 0.71mi |
| 2435 E 10th St Tulsa, OK | 3.0 | 1.0 | 1040 | $1,650 | $1.59 | 3d | 1 | 0.80mi |
| 2509 E 7th St Tulsa, OK | 3.0 | 2.0 | 1161 | $1,815 | $1.56 | 11d | 1 | 0.81mi |
| 2532 E 4th St Tulsa, OK | 2.0 | 2.0 | 1088 | $800 | $0.74 | 23d | 1 | 0.81mi |
| 211 S Greenwood Ave Tulsa, OK | 1.0–2.0 | 1.0–2.0 | 933 | $2,344 | $2.51 | 1d | 3 | 0.85mi |
| 2529 E Admiral Pl Unit A Tulsa, OK | 2.0 | 1.0 | 1100 | $1,295 | $1.18 | 23d | 1 | 0.91mi |
| 2319 E 13th St Tulsa, OK | 2.0 | 1.0 | 875 | $1,400 | $1.60 | 23d | 1 | 0.91mi |
| 1005 N Quincy Ave Unit A Tulsa, OK | 3.0 | 2.0 | 1303 | $1,450 | $1.11 | 2d | 1 | 0.92mi |
| 401 S Elgin Ave Tulsa, OK | 1.0–2.0 | 1.0–2.0 | 770 | $1,499 | $1.95 | 23d | 3 | 0.93mi |
| 505 E 2nd St S Tulsa, OK | 2.0 | 2.0 | 1087 | $2,180 | $2.01 | 2d | 1 | 0.94mi |
| 1411 S Quaker Ave Tulsa, OK | 2.0 | 1.5–2.5 | 1200 | $2,049 | $1.71 | 14d | 2 | 0.95mi |
| 1428 S Quincy Ave Unit C Tulsa, OK | 2.0 | 2.5 | 1756 | $3,700 | $2.11 | 3d | 1 | 0.96mi |
| 1214 S Elgin Ave Unit 5 Tulsa, OK | 2.0 | 1.0 | 1200 | $1,450 | $1.21 | 23d | 1 | 0.98mi |
| 1025 N Quincy Ave Unit A Tulsa, OK | 3.0 | 2.0 | 1303 | $1,450 | $1.11 | 23d | 1 | 0.98mi |
| 415 E 2nd St S Tulsa, OK | 1.0–2.0 | 1.0–2.0 | 807 | $2,180 | $2.70 | 1d | 28 | 1.00mi |
| 1139 S Birmingham Ave Tulsa, OK | 3.0 | 2.0 | 1725 | $2,100 | $1.22 | 23d | 1 | 1.05mi |
| 420 E Archer St Tulsa, OK | 1.0–2.0 | 1.0–2.5 | 1159 | $3,646 | $3.15 | 1d | 30 | 1.07mi |
| 310 E 1st St Tulsa, OK | 1.0–2.0 | 1.0–2.0 | 1110 | $2,870 | $2.58 | 19d | 5 | 1.07mi |
| 310 E 1st St Tulsa, OK | 1.0–2.0 | 1.0–2.0 | 1226 | $2,870 | $2.34 | 1d | 4 | 1.07mi |
| 1008 E King Pl Tulsa, OK | 3.0 | 1.0 | 1284 | $1,295 | $1.01 | 1d | 1 | 1.09mi |
| 2808 E 1st Pl Unit P21-Q Tulsa, OK | 2.0 | 1.0 | 1025 | $1,250 | $1.22 | 23d | 1 | 1.15mi |
| 6 E 5th St Unit 105 Tulsa, OK | 2.0 | 2.0 | 1361 | $2,450 | $1.80 | 21d | 1 | 1.18mi |
| 6 E 5th St Tulsa, OK | 1.0–2.0 | 1.0–2.0 | 1103 | $2,500 | $2.27 | 15d | 4 | 1.18mi |
| 6 E 5th St Unit 703 Tulsa, OK | 2.0 | 2.0 | 962 | $1,731 | $1.80 | 21d | 1 | 1.18mi |
| 720 N Columbia Ave Tulsa, OK | 3.0 | 1.0 | 1233 | $1,150 | $0.93 | 3d | 1 | 1.19mi |
| 9 E 4th St Tulsa, OK | 3.0 | 1.0–2.0 | 894 | $2,499 | $2.80 | 1d | 5 | 1.20mi |
| 1616 S Peoria Ave #4 Tulsa, OK | 2.0 | 2.5 | 1688 | $1,900 | $1.13 | 23d | 1 | 1.21mi |
| 420 S Main St Tulsa, OK | 2.0 | 1.0–2.0 | 1291 | $2,700 | $2.09 | 1d | 13 | 1.23mi |
| 223 S Evanston Ave Tulsa, OK | 3.0 | 2.0 | 1220 | $1,395 | $1.14 | 23d | 1 | 1.23mi |
| 324 S Main St Tulsa, OK | 1.0–2.0 | 1.0–2.0 | 757 | $1,807 | $2.39 | 1d | 6 | 1.24mi |
| 1736 S Xanthus Ave Tulsa, OK | 2.0 | 1.0 | 1328 | $1,450 | $1.09 | 3d | 1 | 1.29mi |
| 406 S Boulder Ave Tulsa, OK | 1.0–2.0 | 1.0–2.0 | 1082 | $2,906 | $2.69 | 15d | 3 | 1.30mi |
| 403 S Cheyenne Ave Tulsa, OK | 2.0 | 1.0–2.0 | 750 | $1,799 | $2.40 | 1d | 8 | 1.34mi |
| 44 S Florence Ave Tulsa, OK | 2.0 | 1.0 | 1080 | $1,450 | $1.34 | 23d | 1 | 1.35mi |
| 2508 E 17th St Tulsa, OK | 2.0 | 1.0 | 1180 | $1,600 | $1.36 | 14d | 1 | 1.41mi |
| 1000 S Denver Ave Tulsa, OK | 1.0–2.0 | 1.0–2.0 | 940 | $1,546 | $1.64 | 1d | 19 | 1.44mi |
Listing history 31 events
-
2026-06-18days on market $212,500 Active 57 DOM
-
2026-06-17days on market $212,500 Active 56 DOM
-
2026-06-16days on market $212,500 Active 55 DOM
-
2026-06-15days on market $212,500 Active 54 DOM
-
2026-06-13days on market $212,500 Active 52 DOM
-
2026-06-10days on market $212,500 Active 49 DOM
-
2026-06-09days on market $212,500 Active 48 DOM
-
2026-06-08days on market $212,500 Active 47 DOM
-
2026-06-07days on market $212,500 Active 46 DOM
-
2026-06-05pricedays on market $212,500 Active 43 DOM
-
2026-06-03days on market $215,000 Active 42 DOM
-
2026-06-02days on market $215,000 Active 41 DOM
-
2026-06-01days on market $215,000 Active 40 DOM
-
2026-05-31days on market $215,000 Active 39 DOM
-
2026-05-02price $215,000
-
2026-04-22$230,000 Active
-
2024-06-21soldstatus $186,000
-
2024-06-14soldstatus $186,000 Closed 509-char remark
Show marketing remark (509 chars)
Step into this charming 3-bed, 2-bath home, freshly updated and ready for you! Featuring new windows, flooring, and paint, the interior feels bright and inviting. The kitchen shines with modern cabinets, granite countertops, and stainless steel appliances. Both bathrooms showcase new tile for a contemporary feel. Stay cozy with a new hot water heater and AC unit. Outside, a lovely landscape complements the brand-new back deck. This home offers style, function, and a turnkey experience for its new owners.
-
2024-05-16status Pending 509-char remark
Show marketing remark (509 chars)
Step into this charming 3-bed, 2-bath home, freshly updated and ready for you! Featuring new windows, flooring, and paint, the interior feels bright and inviting. The kitchen shines with modern cabinets, granite countertops, and stainless steel appliances. Both bathrooms showcase new tile for a contemporary feel. Stay cozy with a new hot water heater and AC unit. Outside, a lovely landscape complements the brand-new back deck. This home offers style, function, and a turnkey experience for its new owners.
-
2024-05-09$187,500 Active 509-char remark
Show marketing remark (509 chars)
Step into this charming 3-bed, 2-bath home, freshly updated and ready for you! Featuring new windows, flooring, and paint, the interior feels bright and inviting. The kitchen shines with modern cabinets, granite countertops, and stainless steel appliances. Both bathrooms showcase new tile for a contemporary feel. Stay cozy with a new hot water heater and AC unit. Outside, a lovely landscape complements the brand-new back deck. This home offers style, function, and a turnkey experience for its new owners.
-
2024-04-19historical
-
2024-04-11price $194,900
-
2024-03-14price $199,900
-
2024-02-26price $204,900
-
2024-02-17price $209,900
-
2024-01-28historical $1,545
-
2024-01-26$214,900 Active
-
2023-12-18$1,545
-
2023-07-18historical
-
2022-11-17historical
-
2021-12-28soldstatus $96,000
ⓘ Source: listings_history table (triggers on properties + properties_extension) + one-shot
backfill from property_details.listing_events for pre-trigger history.
Tax reassessment forecast OK · Resets to sale price
- Current annual tax
- $2,742 · $228/mo
- Projected year-2 tax
- $2,742 · $228/mo
- Expected delta
- $0/yr ($0/mo · 0.0%)
ⓘ Screening estimate from a state-policy table — verify with the county assessor before closing.
Climate risk First Street
- Flood 4/10 Moderate FEMA zone X (unshaded) · 22% chance over 30 yrs
- Wildfire 1/10 Low
- Heat 6/10 Major 7 d/yr ≥110°F today · 18 d/yr by 30 yrs out
- Wind 2/10 Low 4% chance of damaging wind over 30 yrs
- Air quality 2/10 Low 2 unhealthy d/yr today · 2 by 30 yrs out
Nearby sold comps map
Loading sold comps map…
Walkable amenities ~0.75 mi
Loading nearby amenities…
Taxation est. · year 1
- Rental income
- $23,436
- − Mortgage interest
- −$11,903
- − Property taxes
- −$2,742
- − Insurance
- −$1,062
- − Repairs & maintenance
- −$1,875
- − Management
- −$1,875
- − Depreciation
- −$6,182
- Taxable loss
- −$2,203
- Est. tax savings @ 24.0%
- +$529
- After-tax cash flow
- $1,866/yr
For passive investors: Depreciation is non-cash, so a rental often shows a tax loss while cash-flowing — sheltering income. Rental losses are passive: they offset passive income freely, and up to $25,000/yr can offset ordinary (W-2) income if you actively participate and your MAGI is under $100k (phasing out to $0 by $150k); unused losses carry forward. On sale, claimed depreciation is recaptured at up to 25%, and gains may owe capital-gains tax (a 1031 exchange can defer both). Figures are a year-1 estimate at your 24.0% rate — not tax advice; consult a CPA.
Schools (NCES district)
- District
- Tulsa
- NCES district ID
- 4030240
- Math proficiency
- 7% ▼ -9.00%
- Reading proficiency
- 12% ▼ -7.00%
- Median HH income
- $37,895
- Composite
- 8.04/100
- National rank
- #9919
- State rank
- #250 of 270 in OK
Livability — Tulsa
- Score
- 75/100
- State rank
- #13
- US rank
- #4058
Category grades
Schools grade is shown separately in the Schools card above.
Census & demographics
- Census place
- Tulsa, OK
- County
- Tulsa County · 640,811 people
- City population
- 389,418
- Metro
- Tulsa, OK
- Population (ZIP)
- 5,195
- Household income
- $68,255
- Rent vs Own
- Severe rent burden
- 395.0
Population outlook (Tulsa County) Hauer SSP2
- Today (2025)
- 723,846 people
- By 2030
- 766,033 · +5.8%
- By 2040
- 851,386 · +17.6%
- By 2050
- 938,389 · +29.6%
- By 2075
- 1,166,011 · +61.1%
- By 2100
- 1,350,277 · +86.5%
Race, ethnicity, and origin ACS 2023
- Neighborhood character
- Predominantly White (72%)
- Race & ethnicity
- White 72% Hispanic / Latino 11% Two or more races 11% Native American 4% Black 4% Asian 2%
- Hispanic origin (detail)
- Mexican 9%
- Common ancestry
- Italian 4% Lithuanian 3% Romanian 2%
- Foreign-born
- 7% · Canada, South Korea, China
- Languages at home
- 89% English-only · Spanish 8% Other Indo-European 1% Korean 1%
Political lean MEDSL · Tulsa
- 2024 margin
- R (+15.2) · D 41.3% · R 56.5% · Other 2.2%
- 2008→2024 swing
- +9.2pp toward D · 2008: -24.5pp · 2024: -15.2pp
- All cycles
- 2024: R+15.2 2020: R+15.6 2016: R+22.9 2012: R+27.4 2008: R+24.5
Not yet ingested
- Civics
- —
Market trends
- HPI YoY
- ▼ -116.41%
- Current HPI
- 283.1716
- Rent YoY
- ▲ 1.21%
- Metro
- Tulsa, OK
- State GDP YoY
- ▲ 1.55%
- F500 in state
- 6
Industry mix (Fortune 500 HQ in OK)
| Industry | F500 HQs | Revenue |
|---|---|---|
| Energy | 3 | $48B |
|
||
Price history
+124.0% since first listed17 events — show timeline
- 2026-05-02 Price Changed $215,000 MLS Technology, Inc.
- 2026-04-22 Listed $230,000 MLS Technology, Inc.
- 2024-06-21 Sold (Public Records) $186,000 Public Records
- 2024-06-14 Sold (MLS) $186,000 MLS Technology, Inc.
- 2024-05-16 Pending — MLS Technology, Inc.
- 2024-05-09 Listed $187,500 MLS Technology, Inc.
- 2024-04-19 Listing Removed — MLS Technology, Inc.
- 2024-04-11 Price Changed $194,900 MLS Technology, Inc.
- 2024-03-14 Price Changed $199,900 MLS Technology, Inc.
- 2024-02-26 Price Changed $204,900 MLS Technology, Inc.
- 2024-02-17 Price Changed $209,900 MLS Technology, Inc.
- 2024-01-28 Rental Removed $1,545 APPFOLIO
- 2024-01-26 Listed $214,900 MLS Technology, Inc.
- 2023-12-18 Listed for Rent $1,545 APPFOLIO
- 2023-07-18 Rental Removed — APPFOLIO
- 2022-11-17 Rental Removed — APPFOLIO
- 2021-12-28 Sold (Public Records) $96,000 Public Records
Property tax history
+19.4%/yrLatest (2025): $2,742 · +318.0% YoY. Source: county tax records.
Cash-flow waterfall
monthlySold comps — $/sqft
last 12 mo · ≤1 miLoading sold comps…