 🏗️ New Construction
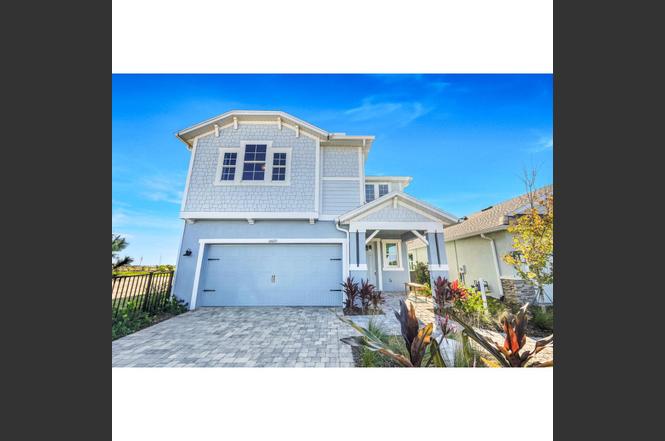
Sebring Plan · North Fort Myers, FL
Flood risk No data
- FEMA flood zone
- —
- Chance of flooding over 30 yrs
- —
- Est. flood insurance / yr
- —
Fire risk No data
- Est. fire insurance / yr
- —
Heat risk No data
- Hot days now (above threshold)
- —
- Hot days in 30 yrs
- —
Wind risk No data
- Chance of severe wind over 30 yrs
- —
Air-quality risk No data
- Unhealthy air days now
- —
- Unhealthy air days in 30 yrs
- —
Risk factors via First Street. Map © Google.
Why this score? — see what drove the F grade
The composite is a weighted blend of 9 inputs, each scored 0–100. Each bar is that input's sub-score; the figure is the points it added to the 100-point composite (weight × sub-score).
- ARV discount +7.5/15.0
- Schools +4.6/10.0
- Cash flow +4.3/30.0
- Livability +3.7/5.0
- Rent growth +3.5/5.0
- Condition / age +2.5/5.0
- Appreciation +2.4/10.0
- 1% rule +0.4/10.0
- DSCR +0.0/10.0
$409,990
🖨 Deal sheet (PDF) 📄 Offer letter ✓ Due diligence
Key facts
- Covered lanai
- Center island
- Walk-in pantry
Tags
Property features AI
Finance
- Financial info: List price available
- HOA & community: Located in Babcock Ranch (community information applicable)
Exterior
- Parking: Attached 2-car garage (2 total parking spaces)
- Home design: Single-family home (Sebring plan); New construction
- Construction: Built as part of 2025–2026 new home inventory
- Exterior features: Located in Babcock Ranch community, Punta Gorda area
Interior
- Bedrooms: 4 bedrooms
- Bathrooms: 3 full bathrooms
- Interior features: Open living area totaling 2490; Plan name: Sebring (new construction plan)
Neighborhood map
What this means for you Summary
Snapshot
- This is a 4-bed/3.0-bath single-family listed at $410k.
Deal economics
- At list price, monthly cash flow is $-2k ($-23k/yr) — negative.
- The deal already cash-flows at list — no discount required.
- To meet the 1% rule (rent ≥ 1% of price), the offer needs to be $384k (6.4% below list).
- Recommended offer: $361k (12.0% below list) — sets the bar for market timing.
Location & tenants
- Location reads 74/100 on livability (#269 in FL, #4,409 nationally) — a middle-class / working-renter tenant base. Strengths: cost of living A+, housing A+, health & safety A+; Watch: employment C-, amenities F, commute F.
- Charlotte (suburban): math 54% / reading 54% proficiency, ranked #22 of 73 in FL (top 30%) — acceptable for families but not a draw, mixed tenant base, ~2y average lease.
- Market conditions: Rents rising fast (+4.1%/yr); 1037 active listings in the ZIP; 20 comparable units currently listed for rent nearby; rentals at typical pace (median 22d on market — plan ~3-4 weeks tenant-placement turnaround); 4,585 units permitted in Charlotte County in 2024 (703 in 5+ unit buildings).
- At $3,839/mo this rent would consume 64% of the median local household income ($72k/yr) (locally 43% of renters already pay >50% of income on rent) — very limited rent-growth headroom before tenants either downsize or default.
Forward outlook
- Local home prices are declining (-3.0%/yr); year-one equity from $5k of loan paydown is wiped out by about $21k of value loss. Plan a longer hold.
- Charlotte County population projected at +24% by 2050 — long-run rental-demand tailwind backs the buy-and-hold thesis.
Negotiation context
- It's been on market 334 days — a 12% lower offer ($361k) is reasonable based on typical stale-listing flexibility.
Risks & watch-outs
- Watch-outs: property tax is 2.6% of price.
Questions for the listing agent
- What do current leases actually rent for vs. the listed asking? Can we see a recent rent roll and the last 12 months of T-12 income?
- It's been on market 334 days. Have you received any prior offers? Is the seller open to a 12% concession, seller financing, or rate buy-down credit?
- Property tax is high relative to price — has the assessment been appealed recently, and will the sale trigger a re-assessment?
- Why hasn't it sold? Are there any deal-killer items the seller is aware of (foundation, flood, title, zoning, code violations)?
- Is there a deadline driving the sale (1031 exchange, divorce, estate, relocation)? That informs how much negotiation room exists.
- The area grade is low — what's the realistic commute time and amenity access for the typical tenant pool here? Any planned neighborhood developments (good or bad) we should know about?
- What's the average days-on-market for RENTAL listings here right now (not sales)? A rising rental-DOM trend means longer vacancies and softer asking-rent achievability than the comps imply.
- What's the recent tenant-quality profile in this submarket — average credit score on applications, eviction rate, late-payment / NSF rate, and stable-employment percentage? A property-management company in the area should have these aggregated.
- How much new for-sale + rental construction is in the pipeline within 1–3 miles? Heavy new supply typically softens prices + rents 12–24 months out; constrained supply supports both.
Investment metrics
- 1% rule
- 0.54% ✗
- Cap rate
- 3.09%
- Cash-on-cash
- -11.43%
- DSCR
- 0.49
- GRM
- 15.5
CMA / ARV
- ARV (on-the-fly)
- $714,630
- Comps found
- 4
Show comp detail 4 sales within ~0.75 mi
| Address | Dist | Beds/Ba | Sqft | Sold | Price | $/sf | Match |
|---|---|---|---|---|---|---|---|
| 42223 Saddleback Trl | 0.37mi | 4/2.0 | 2,301 (-8%) | 5mo | $610,000 | $265 | 62 |
| 17709 Wayside Bnd | 0.54mi | 3/3.0 (-1) | 2,448 (-2%) | 15mo | $585,000 | $239 | 54 |
| 16952 Bridle Trl | 0.23mi | 3/3.0 (-1) | 2,245 (-10%) | 18mo | $645,000 | $287 | 53 |
| 42274 Waterfront Way | 0.55mi | 3/2.5 (-1) | 2,266 (-9%) | 11mo | $680,000 | $300 | 43 |
Match score weights: distance 35% · size 25% · config 20% · recency 20%. Top-matched comps best support the ARV.
Projected returns pro-forma
-3.0% appreciation · 4.13% rent growth · sell at horizon
- IRR
- -36.0%
- Equity multiple
- -0.16×
- Total profit
- $-232,713
- Equity at exit
- $106,554
- IRR
- -42.4%
- Equity multiple
- -0.70×
- Total profit
- $-340,174
- Equity at exit
- $61,788
Cash invested: $200,096 (down + closing). Projections, not guarantees.
Landlord ↔ Tenant lean methodology
- Overall (STATE)
- 87 Strongly Landlord-Friendly
- State Florida
- 87 Strongly Landlord-Friendly · R+3
- County
- — inherits STATE
- City
- — inherits STATE
ZIP-level market 33982
- Home prices YoY
- -1.2%
- Rents YoY
- 4.1%
- Active inventory
- 1037
- Price-to-rent
- 8.9×
Monthly cashflow live
- Estimated rent
- $3,839 high interval (Pro) →
- Mortgage (P&I)
- −$3,748
- Tax est. 1.5%
- −$893 /mo · $10,719/yr
- Insurance
- −$298
- HOA
- −$0
- Vacancy / Maint / Mgmt
- −$806
- Net cashflow
- $-1,906
Break-even live
Sensitivity live
| Price | -10% $-1,412 | -5% $-1,659 | +0% $-1,906 | +5% $-2,153 | +10% $-2,400 |
|---|---|---|---|---|---|
| Rent | -10% $-2,209 | -5% $-2,057 | +0% $-1,906 | +5% $-1,754 | +10% $-1,603 |
| Rate | -1.0pp $-1,546 | -0.5pp $-1,724 | base $-1,906 | +0.5pp $-2,091 | +1.0pp $-2,279 |
UW: 25.0% down · 7.5% · 30yr · 1.5% tax · 5.0% vac · 8.0% maint · 8.0% mgmt
Financing live
Cash to close
- Down payment
- $178,658
- Closing costs
- $21,439
- Reserves months
- —
- Total cash needed
- —
Loan-product check · same deal, 3 products live
Conventional
25% down · 7.5% · 30yr
- Down + closing
- —
- Monthly P&I
- —
- Monthly cashflow
- —
- DSCR
- —
- Eligible?
- —
Personal DTI + credit; lowest rate.
DSCR
20% down · 8.5% · 30yr
- Down + closing
- —
- Monthly P&I
- —
- Monthly cashflow
- —
- DSCR
- —
- Eligible?
- —
No personal income docs; deal must DSCR.
Hard money
10% down · 12.0% · 12mo
- Down + closing
- —
- Monthly P&I
- —
- Monthly cashflow
- —
- DSCR
- —
- Eligible?
- —
Short-term bridge; refi at stabilization.
Rent comps 20 comps
| Address | Beds | Baths | Sqft | Rent | $/sqft | DOM | Units | Dist |
|---|---|---|---|---|---|---|---|---|
| 16572 Kingwood Ln #3611 Punta Gorda, FL | 3.0 | 2.0 | 1749 | $4,500 | $2.57 | 22d | 1 | 0.35mi |
| 43038 Parkside Ct Punta Gorda, FL | 3.0 | 2.0 | 1677 | $2,500 | $1.49 | 22d | 1 | 0.37mi |
| 42098 Journey Dr Punta Gorda, FL | 3.0 | 2.0 | 2000 | $9,000 | $4.50 | 22d | 1 | 0.74mi |
| 43153 Wild Indigo Rd Punta Gorda, FL | 3.0–5.0 | 2.0–2.5 | 1919 | $2,826 | $1.47 | 22d | 25 | 0.81mi |
| 16397 Preservation Blvd Punta Gorda, FL | 4.0 | 3.5 | 2353 | $2,800 | $1.19 | 22d | 1 | 0.93mi |
| 17339 Palmetto Pass Ln Punta Gorda, FL | 3.0 | 3.0 | 2464 | $5,000 | $2.03 | 22d | 1 | 0.97mi |
| 43693 Tree Top Trl Punta Gorda, FL | 3.0 | 3.0 | 1850 | $11,000 | $5.95 | 22d | 1 | 0.98mi |
| 17604 Fallen Branch Way Punta Gorda, FL | 4.0 | 3.0 | 2027 | $2,700 | $1.33 | 22d | 1 | 1.08mi |
| 42380 Cascade Dr Punta Gorda, FL | 3.0 | 2.0 | 1662 | $2,600 | $1.56 | 22d | 1 | 1.15mi |
| 15919 Leaning Pine Ln Punta Gorda, FL | 3.0 | 3.0 | 2247 | $10,000 | $4.45 | 22d | 1 | 1.15mi |
| 42425 Cascade Dr Punta Gorda, FL | 3.0 | 2.0 | 1850 | $3,000 | $1.62 | 22d | 1 | 1.19mi |
| 15808 Leaning Pine Ln Punta Gorda, FL | 3.0 | 3.0 | 1874 | $3,950 | $2.11 | 22d | 1 | 1.27mi |
| 15635 Appalachian Dr Punta Gorda, FL | 3.0 | 3.0 | 2707 | $3,500 | $1.29 | 14d | 1 | 1.27mi |
| 15522 Olympic Ct Punta Gorda, FL | 3.0 | 3.0 | 2672 | $3,600 | $1.35 | 22d | 1 | 1.27mi |
| 15943 Grassland Ln #3912 Punta Gorda, FL | 3.0 | 2.0 | 1741 | $8,800 | $5.05 | 22d | 1 | 1.37mi |
| 15919 Grassland Ln #4211 Punta Gorda, FL | 3.0 | 2.0 | 1741 | $8,800 | $5.05 | 22d | 1 | 1.40mi |
| 15903 Grassland Ln #4411 Punta Gorda, FL | 3.0 | 2.0 | 1741 | $7,500 | $4.31 | 22d | 1 | 1.41mi |
| 16922 Sage Ter Punta Gorda, FL | 4.0 | 2.0 | 1580 | $3,500 | $2.22 | 22d | 1 | 1.41mi |
| 43270 Boardwalk Loop Punta Gorda, FL | 3.0 | 3.0 | 2247 | $10,000 | $4.45 | 22d | 1 | 1.48mi |
| 15907 Sugar Hill Dr Unit 15907 Punta Gorda, FL | 3.0 | 3.0 | 2247 | $9,500 | $4.23 | 22d | 1 | 1.48mi |
Listing history 14 events
-
2026-06-18days on market $409,990 Active 334 DOM
-
2026-06-17days on market $409,990 Active 333 DOM
-
2026-06-16days on market $409,990 Active 332 DOM
-
2026-06-15days on market $409,990 Active 331 DOM
-
2026-06-14days on market $409,990 Active 329 DOM
-
2026-06-13days on market $409,990 Active 328 DOM
-
2026-06-10days on market $409,990 Active 326 DOM
-
2026-06-09days on market $409,990 Active 325 DOM
-
2026-06-08days on market $409,990 Active 324 DOM
-
2026-06-05days on market $409,990 Active 320 DOM
-
2026-06-02days on market $409,990 Active 318 DOM
-
2026-06-01days on market $409,990 Active 317 DOM
-
2026-05-31days on market $409,990 Active 316 DOM
-
2026-05-30days on market $409,990 Active 315 DOM
ⓘ Source: listings_history table (triggers on properties + properties_extension) + one-shot
backfill from property_details.listing_events for pre-trigger history.
Nearby sold comps map
Loading sold comps map…
Walkable amenities ~0.75 mi
Loading nearby amenities…
Taxation est. · year 1
- Rental income
- $46,068
- − Mortgage interest
- −$40,030
- − Property taxes
- −$10,719
- − Insurance
- −$3,573
- − Repairs & maintenance
- −$3,685
- − Management
- −$3,685
- − Depreciation
- −$20,789
- Taxable loss
- −$36,415
- Est. tax savings @ 24.0%
- +$8,740
- After-tax cash flow
- $-14,130/yr
For passive investors: Depreciation is non-cash, so a rental often shows a tax loss while cash-flowing — sheltering income. Rental losses are passive: they offset passive income freely, and up to $25,000/yr can offset ordinary (W-2) income if you actively participate and your MAGI is under $100k (phasing out to $0 by $150k); unused losses carry forward. On sale, claimed depreciation is recaptured at up to 25%, and gains may owe capital-gains tax (a 1031 exchange can defer both). Figures are a year-1 estimate at your 24.0% rate — not tax advice; consult a CPA.
Schools (NCES district)
- District
- Charlotte
- NCES district ID
- 1200240
- Math proficiency
- 54% ▼ -6.00%
- Reading proficiency
- 54% ▼ -1.00%
- Median HH income
- $44,864
- Composite
- 45.62/100
- National rank
- #2586
- State rank
- #22 of 73 in FL
Livability — North Fort Myers
- Score
- 74/100
- State rank
- #269
- US rank
- #4409
Category grades
Schools grade is shown separately in the Schools card above.
Census & demographics
- County
- Charlotte County · 196,994 people
- City population
- 57,035
- Metro
- Punta Gorda, FL
- Population (ZIP)
- 13,006
- Household income
- $72,443
- Rent vs Own
- Severe rent burden
- 43.0
Population outlook (Charlotte County) Hauer SSP2
- Today (2025)
- 198,646 people
- By 2030
- 210,507 · +6.0%
- By 2040
- 230,857 · +16.2%
- By 2050
- 247,148 · +24.4%
- By 2075
- 281,777 · +41.8%
- By 2100
- 293,609 · +47.8%
Race, ethnicity, and origin ACS 2023
- Neighborhood character
- Predominantly White (81%)
- Race & ethnicity
- White 81% Two or more races 8% Hispanic / Latino 7% Black 7%
- Hispanic origin (detail)
- Puerto Rican 2% Cuban 3%
- Common ancestry
- Lithuanian 3% Iranian 3% Slovak 3%
- Foreign-born
- 6% · Canada, Jamaica
- Languages at home
- 93% English-only · Spanish 5% German/W. Germanic 1% Arabic 1%
Political lean MEDSL · Charlotte
- 2024 margin
- Solid R (+34.0) · D 32.7% · R 66.7%
- 2008→2024 swing
- -26.7pp toward R · 2008: -7.2pp · 2024: -34.0pp
- All cycles
- 2024: R+34.0 2020: R+26.6 2016: R+27.8 2012: R+14.3 2008: R+7.2
Not yet ingested
- Civics
- —
Market trends
- HPI YoY
- ▼ -5.25%
- Current HPI
- 448.5895
- Rent YoY
- ▲ 4.13%
- Metro
- Punta Gorda, FL
- State GDP YoY
- ▲ 3.28%
- F500 in state
- 36
Industry mix (Fortune 500 HQ in FL)
| Industry | F500 HQs | Revenue |
|---|---|---|
| Industrial Technology | 2 | $29B |
|
||
| Insurance | 2 | $17B |
|
||
| Retail | 1 | $60B |
|
||
| Technology Distribution | 1 | $58B |
|
||
| Homebuilding | 1 | $35B |
|
||
| Technology Manufacturing | 1 | $35B |
|
||
Cash-flow waterfall
monthlySold comps — $/sqft
last 12 mo · ≤1 miLoading sold comps…