 Triplex
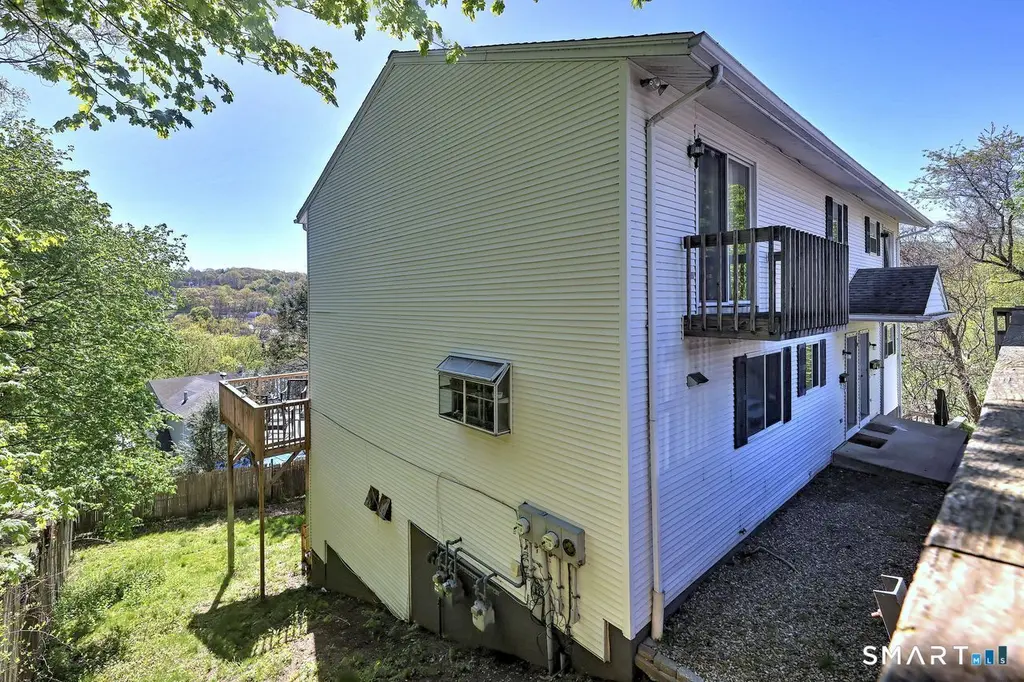
4 Oak St · Derby, CT
Flood risk 1/10 · Minimal
- FEMA flood zone
- X (unshaded)
- Chance of flooding over 30 yrs
- 0.0%
- Est. flood insurance / yr
- $473 – $860
Fire risk 1/10 · Minimal
- Est. fire insurance / yr
- $829 – $1,539
Heat risk 6/10 · Moderate
- Hot days now (above 98°F)
- 7 days/yr
- Hot days in 30 yrs
- 17 days/yr
Wind risk 6/10 · Moderate
- Chance of severe wind over 30 yrs
- 27.0%
Air-quality risk 4/10 · Minor
- Unhealthy air days now
- 4 days/yr
- Unhealthy air days in 30 yrs
- 6 days/yr
Risk factors via First Street. Map © Google.
Why this score? — see what drove the C- grade
The composite is a weighted blend of 9 inputs, each scored 0–100. Each bar is that input's sub-score; the figure is the points it added to the 100-point composite (weight × sub-score).
- Cash flow +21.8/30.0
- DSCR +7.0/10.0
- 1% rule +5.3/10.0
- ARV discount +4.8/15.0
- Livability +3.7/5.0
- Schools +2.6/10.0
- Rent growth +2.5/5.0
- Condition / age +2.5/5.0
- Appreciation +0.0/10.0
$550,000
🖨 Deal sheet (PDF) 📄 Offer letter ✓ Due diligence
Multi-family units
County records classify this as Multi-Family (2-4 Unit). Listing-text estimate: 3 units. confirmed
Listing remarks
* * * Multiple Offers received, seller is requesting Best and Final Offers by 5pm Monday 05/04. * * * Located in the heart of Derby, 4 Oak Street presents a fantastic multi-family investment opportunity just moments from the city's revitalizing downtown district. This well-maintained property features three units, each with separate utilities and washer/dryer hookups for added convenience. The lower-level unit offers 2 bedrooms and 1 bathroom, with a combination of electric heat and a gas heater, and has been recently updated with new flooring, fresh paint, and a modernized kitchen and bath. The second and third units are townhouse-style, including a spacious 2-bedroom, 1-bath layout a
Key facts
- 0.25 acre lot
- 6 parking spots
- Built 1988
Property features AI
Exterior
- Parking: Driveway parking; 6 total parking spaces
- Utilities: Public water connected; Public sewer connected
- Home design: Multi-family property (3-family)
- Construction: Frame construction; Concrete foundation; Asphalt shingle roof; Vinyl siding
- Exterior features: Balcony; Deck; Corner lot; Private driveway
Interior
- Bedrooms: 7 bedrooms total
- Bathrooms: 3 full bathrooms; 1 half bathroom
- Heating & cooling: Central air and window unit cooling; Hot air heating fueled by natural gas
- Interior features: Partial, partially finished basement; Total of 11 rooms (multi-family)
- Laundry & utility: All units have laundry hook-ups; Domestic hot water
Neighborhood map
What this means for you Summary
Snapshot
- This is a 3 × 2-bed/1-bath units multifamily listed at $550k.
Deal economics
- At list price, monthly cash flow is $853 ($10k/yr) — positive. Per door: $284/mo.
- The deal already cash-flows at list — no discount required.
- Meets the 1% rule at list price ($6k rent vs $550k).
- Cap rate 8.2% vs local median 3.8% in Derby — top-decile yield for the area; either an underpriced asset or a hidden risk that comps aren't pricing in. Stress-test before assuming the spread holds.
Location & tenants
- Location reads 74/100 on livability (#64 in CT, #4,574 nationally) — a middle-class / working-renter tenant base. Strengths: housing A+, health & safety A+, cost of living B; Watch: crime D+, employment D+, amenities F.
- Derby School District (suburban): math 22% / reading 36% proficiency, ranked #127 of 153 in CT (top 83%) — low school quality limits family demand, transient renter base, plan for 1-2y turnover.
- Zoned schools: Irving School (math 12% / reading 22%, grade F, #459 of 553 statewide, top 84%, 306 students, 65% FRL); Derby Middle School (math 20% / reading 40%, grade F, #139 of 175 statewide, top 79%, 291 students, 54% FRL); Derby High School (math 5% / reading 34%, grade F, #165 of 194 statewide, top 87%, 369 students, 51% FRL).
- Market conditions: 40 active listings in the ZIP; solid renter incomes; 502 units permitted in Naugatuck Valley Planning Region in 2024 (171 in 5+ unit buildings).
- At $5,649/mo this rent would consume 86% of the median local household income ($79k/yr) (locally 711% of renters already pay >50% of income on rent) — very limited rent-growth headroom before tenants either downsize or default.
Forward outlook
- Local home prices are declining (-3.0%/yr); year-one equity from $4k of loan paydown is wiped out by about $16k of value loss. Plan a longer hold.
Negotiation context
- Only 7 days on market — expect competitive offers; lowballing is unlikely to land.
- 2 sale attempts since 30y ago with the ask held roughly flat each time — persistent listings suggest the price (not the market) is what's stuck; bring a comps-based counter.
- Current owner paid $156k; list at $550k implies a 254% gain — meaningful room to come down on a strong offer.
Risks & watch-outs
- Climate carrying-cost: major wind risk, 27% chance of damaging wind over 30y; extreme-heat days projected 7→17/yr by 2055 (HVAC capex compounding) — expect insurance premiums to compound above CPI over the hold.
Questions for the listing agent
- Can we see the unit-by-unit rent roll, current vacancy, and any below-market leases? What's the average tenancy length?
- What capital expenditures (roof, boiler, parking lot, exteriors) have been made in the last 5 years, and what's planned in the next 2?
- Is there a deadline driving the sale (1031 exchange, divorce, estate, relocation)? That informs how much negotiation room exists.
- Schools are D-rated, which usually means shorter tenancies and higher turnover. Who's the typical renter profile here, and what's been the actual vacancy rate?
- Crime grade is D in this area — have there been break-ins, vandalism, or insurance claims at this property in the last 3 years? What carrier currently insures it and at what premium?
- What's the average days-on-market for RENTAL listings here right now (not sales)? A rising rental-DOM trend means longer vacancies and softer asking-rent achievability than the comps imply.
- What's the recent tenant-quality profile in this submarket — average credit score on applications, eviction rate, late-payment / NSF rate, and stable-employment percentage? A property-management company in the area should have these aggregated.
- How much new apartment / multifamily construction is in the pipeline within 1–3 miles? Heavy new supply (>2% of stock underway) typically softens rents 12–24 months out; light construction supports rent growth.
Investment metrics
- 1% rule
- 1.03% ✓
- Cap rate
- 8.15%
- Cash-on-cash
- 6.65%
- DSCR
- 1.30
- GRM
- 8.1
CMA / ARV
- ARV (median comp)
- $518,656
- List price
- $550,000
- Delta
- 6.04%
- Verdict
- FAIR
- Comps
- 20 within 1.0 mi
Show comp detail 11 sales within ~0.75 mi
| Address | Dist | Beds/Ba | Sqft | Sold | Price | $/sf | Match |
|---|---|---|---|---|---|---|---|
| 141 Hawkins St | 0.35mi | 6/2.0 (-1) | 2,814 (+0%) | 3mo | $450,000 | $160 | 70 |
| 154 Hawthorne Ave | 0.44mi | 6/3.5 (-1) | 2,652 (-5%) | 5mo | $549,000 | $207 | 62 |
| 199 Elizabeth St | 0.21mi | 7/2.5 | 2,453 (-12%) | 11mo | $475,000 | $194 | 56 |
| 15 Cherry St | 0.35mi | 6/3.0 (-1) | 2,632 (-6%) | 13mo | $439,000 | $167 | 56 |
| 140 Hawthorne Ave | 0.40mi | 6/4.0 (-1) | 3,127 (+12%) | 8mo | $645,000 | $206 | 48 |
| 183 Caroline St | 0.29mi | 6/3.0 (-1) | 2,526 (-10%) | 19mo | $545,000 | $216 | 47 |
| 154-156 Hawthorne Ave | 0.44mi | 6/3.0 (-1) | 2,652 (-5%) | 23mo | $410,000 | $155 | 45 |
| 140-142 Hawthorne Ave | 0.40mi | 6/3.0 (-1) | 2,503 (-11%) | 20mo | $475,000 | $190 | 41 |
| 201 Derby Ave | 0.67mi | 6/2.0 (-1) | 2,669 (-5%) | 16mo | $490,000 | $184 | 37 |
| 15 Atwater Ave | 0.58mi | 7/3.0 | 3,210 (+15%) | 14mo | $580,000 | $181 | 35 |
| 165 Derby Ave | 0.66mi | 6/2.0 (-1) | 2,614 (-7%) | 22mo | $422,500 | $162 | 29 |
Match score weights: distance 35% · size 25% · config 20% · recency 20%. Top-matched comps best support the ARV.
Projected returns pro-forma
-3.0% appreciation · 3.0% rent growth · sell at horizon
- IRR
- -6.1%
- Equity multiple
- 0.77×
- Total profit
- $-34,815
- Equity at exit
- $82,007
- IRR
- 3.5%
- Equity multiple
- 1.26×
- Total profit
- $39,524
- Equity at exit
- $47,554
Cash invested: $154,000 (down + closing). Projections, not guarantees.
Landlord ↔ Tenant lean methodology
- Overall (STATE)
- 27 Tenant-Leaning
- State Connecticut
- 27 Tenant-Leaning · D+7
- County
- — inherits STATE
- City
- — inherits STATE
ZIP-level market 06418
- Home prices YoY
- -19.5%
- Active inventory
- 40
- Price-to-rent
- 24.3×
Monthly cashflow live
- Estimated rent
- $5,649 high interval (Pro) →
- Mortgage (P&I)
- −$2,884
- Tax from tax record
- −$496 /mo · $5,953/yr
- Insurance
- −$229
- HOA
- −$0
- Vacancy / Maint / Mgmt
- −$1,186
- Net cashflow
- $853
Break-even live
Sensitivity live
| Price | -10% $1,165 | -5% $1,009 | +0% $853 | +5% $698 | +10% $542 |
|---|---|---|---|---|---|
| Rent | -10% $407 | -5% $630 | +0% $853 | +5% $1,076 | +10% $1,299 |
| Rate | -1.0pp $1,130 | -0.5pp $993 | base $853 | +0.5pp $711 | +1.0pp $566 |
3-unit breakdown (identical units grouped — click to expand)
| Units | Beds | Baths | Est. rent |
|---|---|---|---|
| 3× units | 2 | 1 | $5,649 |
| #1 | 2 | 1 | $1,883 |
| #2 | 2 | 1 | $1,883 |
| #3 | 2 | 1 | $1,883 |
| Total (3 units) | $5,649 | ||
UW: 25.0% down · 7.5% · 30yr · 1.5% tax · 5.0% vac · 8.0% maint · 8.0% mgmt
Financing live
Cash to close
- Down payment
- $137,500
- Closing costs
- $16,500
- Reserves months
- —
- Total cash needed
- —
Loan-product check · same deal, 3 products live
Conventional
25% down · 7.5% · 30yr
- Down + closing
- —
- Monthly P&I
- —
- Monthly cashflow
- —
- DSCR
- —
- Eligible?
- —
Personal DTI + credit; lowest rate.
DSCR
20% down · 8.5% · 30yr
- Down + closing
- —
- Monthly P&I
- —
- Monthly cashflow
- —
- DSCR
- —
- Eligible?
- —
No personal income docs; deal must DSCR.
Hard money
10% down · 12.0% · 12mo
- Down + closing
- —
- Monthly P&I
- —
- Monthly cashflow
- —
- DSCR
- —
- Eligible?
- —
Short-term bridge; refi at stabilization.
Listing history 5 events
-
2026-05-08status Under Contract 1065-char remark
-
2026-05-02$550,000 Active 1065-char remark
-
2026-04-29historical $550,000 1065-char remark
-
1997-01-31soldstatus $155,500
-
1996-05-04$164,900
ⓘ Source: listings_history table (triggers on properties + properties_extension) + one-shot
backfill from property_details.listing_events for pre-trigger history.
Tax reassessment forecast CT · Partial reset (capped growth)
- Current annual tax
- $5,953 · $496/mo
- Projected year-2 tax
- $8,862 · $738/mo
- Expected delta
- +$2,908/yr (+$242/mo · 48.9%)
ⓘ Screening estimate from a state-policy table — verify with the county assessor before closing.
Climate risk First Street
- Flood 1/10 Low FEMA zone X (unshaded) · 0% chance over 30 yrs
- Wildfire 1/10 Low
- Heat 6/10 Major 7 d/yr ≥98°F today · 17 d/yr by 30 yrs out
- Wind 6/10 Major 27% chance of damaging wind over 30 yrs
- Air quality 4/10 Moderate 4 unhealthy d/yr today · 6 by 30 yrs out
Nearby sold comps map
Loading sold comps map…
Walkable amenities ~0.75 mi
Loading nearby amenities…
Taxation est. · year 1
- Rental income
- $67,788
- − Mortgage interest
- −$30,809
- − Property taxes
- −$5,953
- − Insurance
- −$2,750
- − Repairs & maintenance
- −$5,423
- − Management
- −$5,423
- − Depreciation
- −$16,000
- Taxable income
- $1,430
- Est. tax owed @ 24.0%
- −$343
- After-tax cash flow
- $9,895/yr
For passive investors: Depreciation is non-cash, so a rental often shows a tax loss while cash-flowing — sheltering income. Rental losses are passive: they offset passive income freely, and up to $25,000/yr can offset ordinary (W-2) income if you actively participate and your MAGI is under $100k (phasing out to $0 by $150k); unused losses carry forward. On sale, claimed depreciation is recaptured at up to 25%, and gains may owe capital-gains tax (a 1031 exchange can defer both). Figures are a year-1 estimate at your 24.0% rate — not tax advice; consult a CPA.
Schools (NCES district)
- District
- Derby School District
- NCES district ID
- 0901110
- Math proficiency
- 22% ▼ -8.00%
- Reading proficiency
- 36% ▼ -1.00%
- Median HH income
- $52,988
- Composite
- 25.61/100
- National rank
- #7410
- State rank
- #127 of 153 in CT
Livability — Derby
- Score
- 74/100
- State rank
- #64
- US rank
- #4574
Category grades
Schools grade is shown separately in the Schools card above.
Census & demographics
- Census place
- Derby, CT
- County
- New Haven County · 688,236 people
- City population
- 12,205
- Metro
- New Haven-Milford, CT
- Population (ZIP)
- 12,205
- Household income
- $78,542
- Rent vs Own
- Severe rent burden
- 711.0
Population outlook (Naugatuck Valley County) Hauer SSP2
- By 2040
- 496,846
Race, ethnicity, and origin ACS 2023
- Neighborhood character
- Diverse neighborhood (Simpson 0.59)
- Race & ethnicity
- White 60% Hispanic / Latino 21% Black 10% Two or more races 8% Asian 2%
- Hispanic origin (detail)
- Puerto Rican 12% Dominican 3%
- Common ancestry
- Romanian 8% Russian 3% Slovak 2%
- Foreign-born
- 12% · Canada, China, Jamaica
- Languages at home
- 78% English-only · Spanish 16% Other Indo-European 2% Russian/Polish/Slavic 2%
Political lean MEDSL · Naugatuck Valley
- 2024 margin
- Lean R (+7.4) · D 45.6% · R 53.0% · Other 1.4%
- All cycles
- 2024: R+7.4
Not yet ingested
- Civics
- —
Market trends
- HPI YoY
- ▼ -49.06%
- Current HPI
- 202.3832
- Rent YoY
- —
- Metro
- New Haven-Milford, CT
- State GDP YoY
- ▲ 1.06%
- F500 in state
- 38
Industry mix (Fortune 500 HQ in CT)
| Industry | F500 HQs | Revenue |
|---|---|---|
| Industrial Machinery | 4 | $38B |
|
||
| Insurance | 3 | $71B |
|
||
| Financial Services | 2 | $25B |
|
||
| Transportation / Logistics | 2 | $18B |
|
||
| Healthcare | 1 | $247B |
|
||
| Telecommunications | 1 | $55B |
|
||
Price history
+233.5% since first listed5 events — show timeline
- 2026-05-08 Pending — Smart MLS
- 2026-05-02 Listed $550,000 Smart MLS
- 2026-04-29 Coming Soon $550,000 Smart MLS
- 1997-01-31 Sold (MLS) $155,500 Smart MLS
- 1996-05-04 Listed $164,900 Smart MLS
Property tax history
+1.3%/yrLatest (2022): $5,953 · +0.0% YoY. Source: county tax records.
Cash-flow waterfall
monthlySold comps — $/sqft
last 12 mo · ≤1 miLoading sold comps…