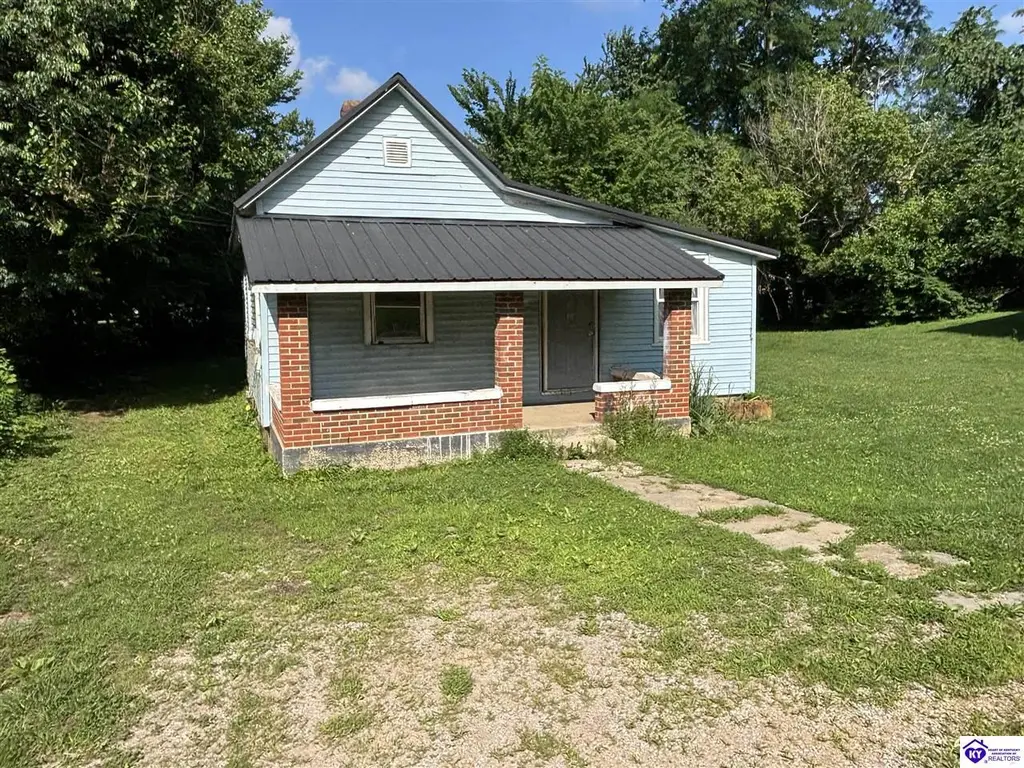
308 Wickliffe Ave · Campbellsville, KY
Flood risk 1/10 · Minimal
- FEMA flood zone
- X (unshaded)
- Chance of flooding over 30 yrs
- 0.0%
- Est. flood insurance / yr
- $507 – $1,088
Fire risk 1/10 · Minimal
- Est. fire insurance / yr
- $839 – $1,559
Heat risk 5/10 · Moderate
- Hot days now (above 104°F)
- 7 days/yr
- Hot days in 30 yrs
- 21 days/yr
Wind risk 3/10 · Minor
- Chance of severe wind over 30 yrs
- 5.0%
Air-quality risk 1/10 · Minimal
- Unhealthy air days now
- 0 days/yr
- Unhealthy air days in 30 yrs
- 0 days/yr
Risk factors via First Street. Map © Google.
Why this score? — see what drove the B- grade
The composite is a weighted blend of 9 inputs, each scored 0–100. Each bar is that input's sub-score; the figure is the points it added to the 100-point composite (weight × sub-score).
- Cash flow +30.0/30.0
- 1% rule +10.0/10.0
- DSCR +10.0/10.0
- ARV discount +7.5/15.0
- Livability +3.8/5.0
- Rent growth +2.5/5.0
- Condition / age +2.5/5.0
- Schools +1.9/10.0
- Appreciation +0.0/10.0
$59,900
🖨 Deal sheet (PDF) 📄 Offer letter ✓ Due diligence
Listing remarks
INVESTORS!!! Two bedroom and one bathroom. Needs some work. This property would be a great rental in the city of Campbellsville. Data believed correct but not guaranteed. Buyer to verify data prior to offer. DISCLAIMER_PVA didn't have the exact age of home
Key facts
- 6,970 sq ft lot
- Built 1959
- Listed 22 days
Property features AI
Exterior
- Parking: No parking
- Utilities: Public water; Public sewer
- Home design: Single-family residence; Residential property
- Construction: Metal roof; Block foundation
- Exterior features: Wooded lot
Interior
- Kitchen: Range; Oven; Refrigerator
- Bathrooms: 1 full bathroom; 2 main-level bathrooms
- Heating & cooling: Natural gas heating; Ceiling fans for cooling
- Interior features: Eat-in kitchen; Ceiling fan(s)
- Laundry & utility: Electric water heater
Neighborhood map
What this means for you Summary
Snapshot
- This is a 2-bed/1.0-bath other listed at $60k.
Deal economics
- At list price, monthly cash flow is $462 ($6k/yr) — positive.
- The deal already cash-flows at list — no discount required.
- Meets the 1% rule at list price ($1k rent vs $60k).
- Recommended offer: $59k (1.5% below list) — sets the bar for market timing.
- Cap rate 15.6% vs local median 3.7% in Campbellsville — top-decile yield for the area; either an underpriced asset or a hidden risk that comps aren't pricing in. Stress-test before assuming the spread holds.
Location & tenants
- Location reads 76/100 on livability (#94 in KY, #3,786 nationally) — a middle-class / working-renter tenant base. Strengths: cost of living A+, housing A+, health & safety A+; Watch: amenities D+, commute F, employment F.
- Campbellsville Independent (town): math 16% / reading 32% proficiency, ranked #152 of 165 in KY (top 92%) — low school quality limits family demand, transient renter base, plan for 1-2y turnover; 65% free/reduced lunch — lower-income household profile, screen leases tightly.
- Market conditions: 186 active listings in the ZIP; 10 units permitted in Taylor County in 2024 (0 in 5+ unit buildings).
Forward outlook
- Local home prices are declining (-3.0%/yr); year-one equity from $414 of loan paydown is wiped out by about $2k of value loss. Plan a longer hold.
- Taylor County population projected at +13% by 2050 — modest demand growth; plan on rents tracking national, not racing it.
- At projected returns (-3.0% appreciation + 3.0% rent growth), your $17k cash investment doubles in ~4 years — after that, you're playing with house money.
Negotiation context
- It's been on market 23 days — a 2% lower offer ($59k) is reasonable based on typical stale-listing flexibility.
Risks & watch-outs
- Watch-outs: built in 1959 — expect roof / HVAC / electrical / plumbing capex.
- Climate carrying-cost: extreme-heat days projected 7→21/yr by 2055 (HVAC capex compounding) — expect insurance premiums to compound above CPI over the hold.
Questions for the listing agent
- Built in 1959 — when were the roof, HVAC, electrical panel, plumbing, and water heater last replaced?
- Is there a deadline driving the sale (1031 exchange, divorce, estate, relocation)? That informs how much negotiation room exists.
- What's the average days-on-market for RENTAL listings here right now (not sales)? A rising rental-DOM trend means longer vacancies and softer asking-rent achievability than the comps imply.
- What's the recent tenant-quality profile in this submarket — average credit score on applications, eviction rate, late-payment / NSF rate, and stable-employment percentage? A property-management company in the area should have these aggregated.
- How much new for-sale + rental construction is in the pipeline within 1–3 miles? Heavy new supply typically softens prices + rents 12–24 months out; constrained supply supports both.
Investment metrics
- 1% rule
- 1.85% ✓
- Cap rate
- 15.55%
- Cash-on-cash
- 33.07%
- DSCR
- 2.47
- GRM
- 4.5
CMA / ARV
No comps found within radius.
Projected returns pro-forma
-3.0% appreciation · 3.0% rent growth · sell at horizon
- IRR
- 28.3%
- Equity multiple
- 2.18×
- Total profit
- $19,752
- Equity at exit
- $8,931
- IRR
- 35.7%
- Equity multiple
- 4.29×
- Total profit
- $55,178
- Equity at exit
- $5,179
Cash invested: $16,772 (down + closing). Projections, not guarantees.
Landlord ↔ Tenant lean methodology
- Overall (STATE)
- 83 Strongly Landlord-Friendly
- State Kentucky
- 83 Strongly Landlord-Friendly · R+16
- County
- — inherits STATE
- City
- — inherits STATE
ZIP-level market 42718
- Home prices YoY
- -30.1%
- Active inventory
- 186
- Price-to-rent
- 4.5×
Monthly cashflow live
- Estimated rent
- $1,109 medium interval (Pro) →
- Mortgage (P&I)
- −$314
- Tax est. 1.5%
- −$75 /mo · $898/yr
- Insurance
- −$25
- HOA
- −$0
- Vacancy / Maint / Mgmt
- −$233
- Net cashflow
- $462
Break-even live
Sensitivity live
| Price | -10% $504 | -5% $483 | +0% $462 | +5% $442 | +10% $421 |
|---|---|---|---|---|---|
| Rent | -10% $375 | -5% $418 | +0% $462 | +5% $506 | +10% $550 |
| Rate | -1.0pp $492 | -0.5pp $477 | base $462 | +0.5pp $447 | +1.0pp $431 |
UW: 25.0% down · 7.5% · 30yr · 1.5% tax · 5.0% vac · 8.0% maint · 8.0% mgmt
Financing live
Cash to close
- Down payment
- $14,975
- Closing costs
- $1,797
- Reserves months
- —
- Total cash needed
- —
Loan-product check · same deal, 3 products live
Conventional
25% down · 7.5% · 30yr
- Down + closing
- —
- Monthly P&I
- —
- Monthly cashflow
- —
- DSCR
- —
- Eligible?
- —
Personal DTI + credit; lowest rate.
DSCR
20% down · 8.5% · 30yr
- Down + closing
- —
- Monthly P&I
- —
- Monthly cashflow
- —
- DSCR
- —
- Eligible?
- —
No personal income docs; deal must DSCR.
Hard money
10% down · 12.0% · 12mo
- Down + closing
- —
- Monthly P&I
- —
- Monthly cashflow
- —
- DSCR
- —
- Eligible?
- —
Short-term bridge; refi at stabilization.
Listing history 17 events
-
2026-06-21days on market $59,900 Active 23 DOM
-
2026-06-21days on market $59,900 Active 22 DOM
-
2026-06-18days on market $59,900 Active 20 DOM
-
2026-06-17days on market $59,900 Active 19 DOM
-
2026-06-16days on market $59,900 Active 18 DOM
-
2026-06-15days on market $59,900 Active 17 DOM
-
2026-06-13days on market $59,900 Active 15 DOM
-
2026-06-12days on market $59,900 Active 14 DOM
-
2026-06-09days on market $59,900 Active 11 DOM
-
2026-06-08days on market $59,900 Active 10 DOM
-
2026-06-07days on market $59,900 Active 9 DOM
-
2026-06-07days on market $59,900 Active 8 DOM
-
2026-06-04days on market $59,900 Active 5 DOM
-
2026-06-02days on market $59,900 Active 4 DOM
-
2026-06-01days on market $59,900 Active 3 DOM
-
2026-05-31days on market $59,900 Active 2 DOM
-
2026-05-28$59,900 Active
ⓘ Source: listings_history table (triggers on properties + properties_extension) + one-shot
backfill from property_details.listing_events for pre-trigger history.
Climate risk First Street
- Flood 1/10 Low FEMA zone X (unshaded) · 0% chance over 30 yrs
- Wildfire 1/10 Low
- Heat 5/10 Major 7 d/yr ≥104°F today · 21 d/yr by 30 yrs out
- Wind 3/10 Moderate 5% chance of damaging wind over 30 yrs
- Air quality 1/10 Low 0 unhealthy d/yr today · 0 by 30 yrs out
Nearby sold comps map
Loading sold comps map…
Walkable amenities ~0.75 mi
Loading nearby amenities…
Taxation est. · year 1
- Rental income
- $13,310
- − Mortgage interest
- −$3,355
- − Property taxes
- −$898
- − Insurance
- −$300
- − Repairs & maintenance
- −$1,065
- − Management
- −$1,065
- − Depreciation
- −$1,743
- Taxable income
- $4,884
- Est. tax owed @ 24.0%
- −$1,172
- After-tax cash flow
- $4,375/yr
For passive investors: Depreciation is non-cash, so a rental often shows a tax loss while cash-flowing — sheltering income. Rental losses are passive: they offset passive income freely, and up to $25,000/yr can offset ordinary (W-2) income if you actively participate and your MAGI is under $100k (phasing out to $0 by $150k); unused losses carry forward. On sale, claimed depreciation is recaptured at up to 25%, and gains may owe capital-gains tax (a 1031 exchange can defer both). Figures are a year-1 estimate at your 24.0% rate — not tax advice; consult a CPA.
Schools (NCES district)
- District
- Campbellsville Independent
- NCES district ID
- 2100930
- Math proficiency
- 16% ▼ -28.00%
- Reading proficiency
- 32% ▼ -16.00%
- Median HH income
- $25,520
- Composite
- 18.83/100
- National rank
- #8864
- State rank
- #152 of 165 in KY
Livability — Campbellsville
- Score
- 76/100
- State rank
- #94
- US rank
- #3786
Category grades
Schools grade is shown separately in the Schools card above.
Census & demographics
- Census place
- Campbellsville, KY
- Population (ZIP)
- 26,461
Population outlook (Taylor County) Hauer SSP2
- Today (2025)
- 27,046 people
- By 2030
- 27,794 · +2.8%
- By 2040
- 29,231 · +8.1%
- By 2050
- 30,486 · +12.7%
- By 2075
- 33,767 · +24.9%
- By 2100
- 34,638 · +28.1%
Race, ethnicity, and origin ACS 2023
- Neighborhood character
- Predominantly White (89%)
- Race & ethnicity
- White 89% Black 5% Two or more races 4% Hispanic / Latino 3%
- Common ancestry
- Slovak 2% Italian 1% Iranian 1%
- Foreign-born
- 1% · Canada
- Languages at home
- 98% English-only · Spanish 1%
Political lean MEDSL · Taylor
- 2024 margin
- Solid R (+56.7) · D 21.0% · R 77.7% · Other 1.3%
- 2008→2024 swing
- -16.1pp toward R · 2008: -40.5pp · 2024: -56.7pp
- All cycles
- 2024: R+56.7 2020: R+51.2 2016: R+51.0 2012: R+39.0 2008: R+40.5
Not yet ingested
- Civics
- —
Market trends
- HPI YoY
- ▼ -94.56%
- Current HPI
- 219.877
- Rent YoY
- —
- Metro
- —
- State GDP YoY
- ▲ 1.81%
- F500 in state
- 4
Industry mix (Fortune 500 HQ in KY)
| Industry | F500 HQs | Revenue |
|---|---|---|
| Healthcare | 1 | $118B |
|
||
| Food / Beverage | 1 | $7B |
|
||
Price history
1 event — show timeline
- 2026-05-28 Listed $59,900 HKARMLS
Property tax history
+1.5%/yrLatest (2025): $98 · -2.0% YoY. Source: county tax records.
Cash-flow waterfall
monthlySold comps — $/sqft
last 12 mo · ≤1 miLoading sold comps…