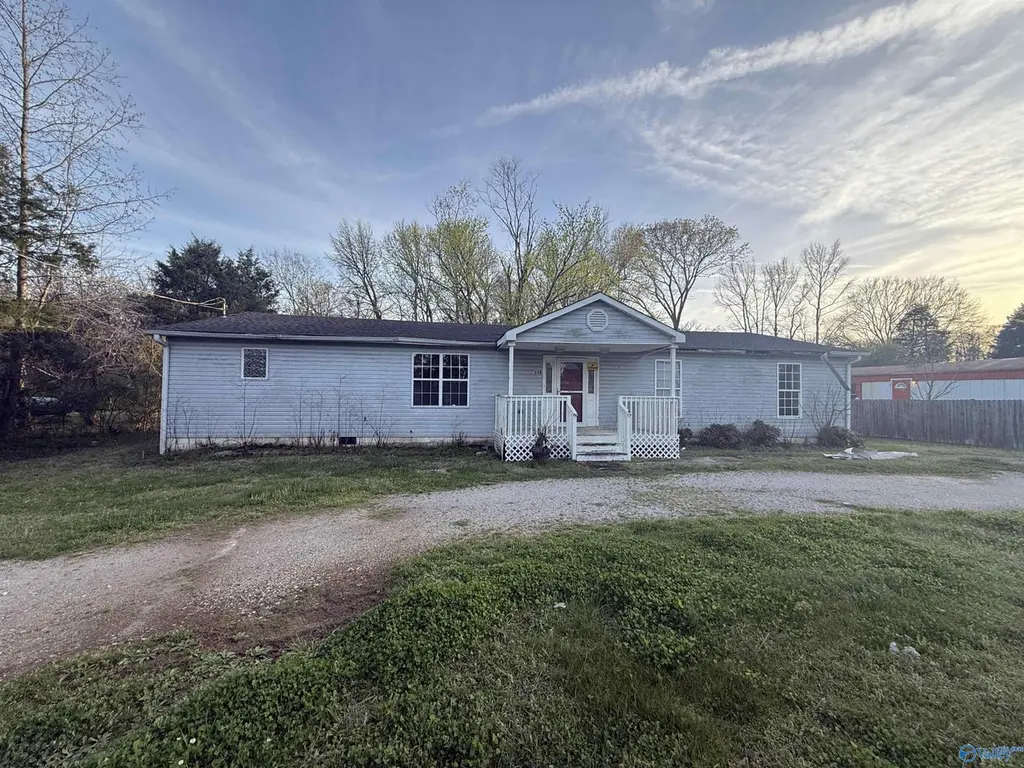
886 Plummer Rd NW · Huntsville, AL
Flood risk 1/10 · Minimal
- FEMA flood zone
- X (unshaded)
- Chance of flooding over 30 yrs
- 0.0%
- Est. flood insurance / yr
- $507 – $1,088
Fire risk 3/10 · Minor
- Est. fire insurance / yr
- $916 – $1,700
Heat risk 5/10 · Moderate
- Hot days now (above 105°F)
- 7 days/yr
- Hot days in 30 yrs
- 19 days/yr
Wind risk 4/10 · Minor
- Chance of severe wind over 30 yrs
- 18.0%
Air-quality risk 2/10 · Minimal
- Unhealthy air days now
- 0 days/yr
- Unhealthy air days in 30 yrs
- 1 days/yr
Risk factors via First Street. Map © Google.
Why this score? — see what drove the B+ grade
The composite is a weighted blend of 9 inputs, each scored 0–100. Each bar is that input's sub-score; the figure is the points it added to the 100-point composite (weight × sub-score).
- Cash flow +30.0/30.0
- DSCR +10.0/10.0
- Appreciation +10.0/10.0
- 1% rule +7.5/10.0
- ARV discount +7.5/15.0
- Livability +4.1/5.0
- Schools +3.7/10.0
- Rent growth +3.1/5.0
- Condition / age +2.5/5.0
$200,000
🖨 Deal sheet 📄 Offer letter ✓ Due diligence
Listing remarks MLS
Opportunity awaits in this rapidly growing Huntsville location! This 1.4-acre, unrestricted county property within the city offers outstanding flexibility and potential. The existing home is being sold AS-IS, with the primary value in the land, creating an excellent opportunity to reimagine, rebuild, or redevelop. Ideally located near MidCity District, Redstone Arsenal Gate 9, Research Blvd, and I-565, the property provides quick access to major employers, shopping, dining, and entertainment. With space and a prime location in a high-demand area, the possibilities are wide open. All information TBV; buyer to verify all details.
Key facts
- 1.4-acre property
- 1.4 acre lot
- Listed 96 days
Tags
Neighborhood map
What this means for you Summary
Snapshot
- This is a 4-bed/1.0-bath single-family listed at $200k.
Deal economics
- At list price, monthly cash flow is $812 ($10k/yr) — positive.
- The deal already cash-flows at list — no discount required.
- Meets the 1% rule at list price ($3k rent vs $200k).
- Recommended offer: $182k (9.0% below list) — sets the bar for market timing.
- Cap rate 11.2% vs local median 3.8% in Huntsville — top-decile yield for the area; either an underpriced asset or a hidden risk that comps aren't pricing in. Stress-test before assuming the spread holds.
Location & tenants
- Location reads 82/100 on livability (#3 in AL, #1,082 nationally) — a professional / high-income tenant draw. Strengths: commute A+, cost of living A+, housing A+; Watch: crime F.
- Madison County (rural): math 27% / reading 56% proficiency, ranked #19 of 129 in AL (top 15%) — families likely to look elsewhere, expect single-tenant / working-renter base with shorter leases.
- Market conditions: Rents rising (+2.6%/yr); 213 active listings in the ZIP; 7 comparable units currently listed for rent nearby; rentals lingering (median 44d on market — plan ~5-8 weeks vacancy on turnover, expect pricing pressure); 71% of comp listings sitting > 30 days — soft ceiling on asking rent; solid renter incomes; 4,709 units permitted in Madison County in 2024 (1,186 in 5+ unit buildings).
- This rent runs 35% of the median local income ($87k/yr) — at the standard rent-burdened threshold; future hikes will face affordability resistance.
Forward outlook
- In year one you build about $21k of equity ($1k loan paydown + $20k appreciation (10.0% local appreciation)).
- Madison County population projected at +18% by 2050 — long-run rental-demand tailwind backs the buy-and-hold thesis.
- At projected returns (10.0% appreciation + 2.6% rent growth), your $56k cash investment doubles in ~2 years — after that, you're playing with house money.
- By year 2, paydown + projected appreciation supports a ~$34k cash-out refi (75% LTV) — recoverable capital for the next deal without selling this one.
Negotiation context
- It's been on market 97 days — a 9% lower offer ($182k) is reasonable based on typical stale-listing flexibility.
Risks & watch-outs
- Climate carrying-cost: extreme-heat days projected 7→19/yr by 2055 (HVAC capex compounding) — expect insurance premiums to compound above CPI over the hold.
Questions for the listing agent
- It's been on market 97 days. Have you received any prior offers? Is the seller open to a 9% concession, seller financing, or rate buy-down credit?
- Built in 1978 — when were the roof, HVAC, electrical panel, plumbing, and water heater last replaced?
- Why hasn't it sold? Are there any deal-killer items the seller is aware of (foundation, flood, title, zoning, code violations)?
- Is there a deadline driving the sale (1031 exchange, divorce, estate, relocation)? That informs how much negotiation room exists.
- Crime grade is F in this area — have there been break-ins, vandalism, or insurance claims at this property in the last 3 years? What carrier currently insures it and at what premium?
- What's the average days-on-market for RENTAL listings here right now (not sales)? A rising rental-DOM trend means longer vacancies and softer asking-rent achievability than the comps imply.
- What's the recent tenant-quality profile in this submarket — average credit score on applications, eviction rate, late-payment / NSF rate, and stable-employment percentage? A property-management company in the area should have these aggregated.
- How much new for-sale + rental construction is in the pipeline within 1–3 miles? Heavy new supply typically softens prices + rents 12–24 months out; constrained supply supports both.
Investment metrics
- 1% rule
- 1.25% ✓
- Cap rate
- 11.17%
- Cash-on-cash
- 17.41%
- DSCR
- 1.77
- GRM
- 6.6
CMA / ARV
- ARV (median comp)
- $427,678
- List price
- $200,000
- Delta
- -53.24%
- Verdict
- UNDERPRICED
- Comps
- 20 within 1.0 mi
Show comp detail 12 sales within ~0.75 mi
| Address | Dist | Beds/Ba | Sqft | Sold | Price | $/sf | Match |
|---|---|---|---|---|---|---|---|
| 907 Binding Br | 0.12mi | 3/2.0 (-1) | 2,374 (-2%) | 3mo | $425,000 | $179 | 81 |
| 105 Turtle Bank Ct | 0.21mi | 4/3.0 | 2,460 (+2%) | 12mo | $495,000 | $201 | 68 |
| 908 Binding Br | 0.12mi | 3/3.0 (-1) | 2,414 (+0%) | 17mo | $440,000 | $182 | 67 |
| 1104 Corner Brk NW | 0.14mi | 3/2.5 (-1) | 2,345 (-3%) | 13mo | $440,000 | $188 | 67 |
| 1006 Split Rock Cv | 0.09mi | 3/2.0 (-1) | 2,596 (+8%) | 10mo | $475,000 | $183 | 66 |
| 1034 Split Rock Cv | 0.22mi | 3/2.0 (-1) | 2,251 (-7%) | 8mo | $426,900 | $190 | 63 |
| 126 Navaho Trl | 0.47mi | 3/2.0 (-1) | 2,459 (+2%) | 4mo | $353,000 | $144 | 62 |
| 143 Preswick Pl | 0.47mi | 4/2.0 | 2,200 (-9%) | 1mo | $325,000 | $148 | 59 |
| 929 Binding Br NW | 0.25mi | 3/2.0 (-1) | 2,215 (-8%) | 10mo | $424,900 | $192 | 58 |
| 126 Vaughnwood Trce | 0.59mi | 4/2.5 | 2,565 (+6%) | 15mo | $425,000 | $166 | 43 |
| 114 Cedar Falls Ct | 0.68mi | 3/2.0 (-1) | 2,211 (-8%) | 11mo | $390,000 | $176 | 37 |
| 209 NW Williston Dr NW | 0.54mi | 4/3.0 | 2,700 (+12%) | 14mo | $375,000 | $139 | 35 |
Match score weights: distance 35% · size 25% · config 20% · recency 20%. Top-matched comps best support the ARV.
Projected returns pro-forma
10.0% appreciation · 2.57% rent growth · sell at horizon
- IRR
- 37.0%
- Equity multiple
- 3.85×
- Total profit
- $159,486
- Equity at exit
- $180,176
- IRR
- 31.7%
- Equity multiple
- 8.62×
- Total profit
- $426,637
- Equity at exit
- $388,556
Cash invested: $56,000 (down + closing). Projections, not guarantees.
Landlord ↔ Tenant lean methodology
- Overall (STATE)
- 90 Strongly Landlord-Friendly
- State Alabama
- 90 Strongly Landlord-Friendly · R+15
- County
- — inherits STATE
- City
- — inherits STATE
ZIP-level market 35806
- Home prices YoY
- 20.0%
- Rents YoY
- 2.6%
- Active inventory
- 213
- Price-to-rent
- 6.6×
Monthly cashflow live
- Estimated rent
- $2,507 high interval (Pro) →
- Mortgage (P&I)
- −$1,049
- Tax from tax record
- −$36 /mo · $429/yr
- Insurance
- −$83
- HOA
- −$0
- Vacancy / Maint / Mgmt
- −$526
- Net cashflow
- $812
Break-even live
UW: 25.0% down · 7.5% · 30yr · 1.5% tax · 5.0% vac · 8.0% maint · 8.0% mgmt
Financing live
Cash to close
- Down payment
- $50,000
- Closing costs
- $6,000
- Reserves months
- —
- Total cash needed
- —
Loan-product check · same deal, 3 products live
Conventional
25% down · 7.5% · 30yr
- Down + closing
- —
- Monthly P&I
- —
- Monthly cashflow
- —
- DSCR
- —
- Eligible?
- —
Personal DTI + credit; lowest rate.
DSCR
20% down · 8.5% · 30yr
- Down + closing
- —
- Monthly P&I
- —
- Monthly cashflow
- —
- DSCR
- —
- Eligible?
- —
No personal income docs; deal must DSCR.
Hard money
10% down · 12.0% · 12mo
- Down + closing
- —
- Monthly P&I
- —
- Monthly cashflow
- —
- DSCR
- —
- Eligible?
- —
Short-term bridge; refi at stabilization.
Rent comps 7 comps
| Address | Beds | Baths | Sqft | Rent | $/sqft | DOM | Units | Dist |
|---|---|---|---|---|---|---|---|---|
| 1589 Old Monrovia Rd NW Huntsville, AL | 2.0–3.0 | 2.5–3.5 | 1657 | $2,448 | $1.48 | 13d | 17 | 0.97mi |
| 171 Kingswood Dr Huntsville, AL | 4.0 | 2.5 | 2850 | $2,500 | $0.88 | 13d | 1 | 0.99mi |
| 67 Town Center Dr NW Huntsville, AL | 3.0 | 2.5 | 2970 | $2,495 | $0.84 | 43d | 1 | 1.29mi |
| 445 Providence Main St NW Unit 409a Huntsville, AL | 3.0 | 2.5 | 2797 | $3,995 | $1.43 | 43d | 1 | 1.30mi |
| 8223 Stone Mill Dr NW Huntsville, AL | 3.0 | 2.5 | 2046 | $2,300 | $1.12 | 43d | 1 | 1.39mi |
| 21 Stone Mason Way NW Huntsville, AL | 4.0 | 3.5 | 1778 | $2,700 | $1.52 | 43d | 1 | 1.43mi |
| 102 Fred Atkinson Rd Huntsville, AL | 4.0 | 3.0 | 3022 | $2,700 | $0.89 | 43d | 1 | 1.47mi |
Listing history 14 events
-
2026-06-18days on market $200,000 Active 97 DOM
-
2026-06-17days on market $200,000 Active 96 DOM
-
2026-06-16days on market $200,000 Active 95 DOM
-
2026-06-15days on market $200,000 Active 94 DOM
-
2026-06-14days on market $200,000 Active 92 DOM
-
2026-06-10days on market $200,000 Active 89 DOM
-
2026-06-09days on market $200,000 Active 88 DOM
-
2026-06-08days on market $200,000 Active 87 DOM
-
2026-06-07days on market $200,000 Active 86 DOM
-
2026-06-02days on market $200,000 Active 81 DOM
-
2026-06-01days on market $200,000 Active 80 DOM
-
2026-05-31days on market $200,000 Active 79 DOM
-
2026-05-30days on market $200,000 Active 78 DOM
-
2026-03-14$200,000 Active 635-char remark
Show marketing remark (635 chars)
Opportunity awaits in this rapidly growing Huntsville location! This 1.4-acre, unrestricted county property within the city offers outstanding flexibility and potential. The existing home is being sold AS-IS, with the primary value in the land, creating an excellent opportunity to reimagine, rebuild, or redevelop. Ideally located near MidCity District, Redstone Arsenal Gate 9, Research Blvd, and I-565, the property provides quick access to major employers, shopping, dining, and entertainment. With space and a prime location in a high-demand area, the possibilities are wide open. All information TBV; buyer to verify all details.
ⓘ Source: listings_history table (triggers on properties + properties_extension) + one-shot
backfill from property_details.listing_events for pre-trigger history.
Tax reassessment forecast AL · Resets to sale price
- Current annual tax
- $429 · $36/mo
- Projected year-2 tax
- $820 · $68/mo
- Expected delta
- +$391/yr (+$33/mo · 91.2%)
ⓘ Screening estimate from a state-policy table — verify with the county assessor before closing.
Climate risk First Street
- Flood 1/10 Low FEMA zone X (unshaded) · 0% chance over 30 yrs
- Wildfire 3/10 Moderate
- Heat 5/10 Major 7 d/yr ≥105°F today · 19 d/yr by 30 yrs out
- Wind 4/10 Moderate 18% chance of damaging wind over 30 yrs
- Air quality 2/10 Low 0 unhealthy d/yr today · 1 by 30 yrs out
Nearby sold comps map
Loading sold comps map…
Walkable amenities ~0.75 mi
Loading nearby amenities…
Taxation est. · year 1
- Rental income
- $30,079
- − Mortgage interest
- −$11,203
- − Property taxes
- −$429
- − Insurance
- −$1,000
- − Repairs & maintenance
- −$2,406
- − Management
- −$2,406
- − Depreciation
- −$5,818
- Taxable income
- $6,816
- Est. tax owed @ 24.0%
- −$1,636
- After-tax cash flow
- $8,112/yr
For passive investors: Depreciation is non-cash, so a rental often shows a tax loss while cash-flowing — sheltering income. Rental losses are passive: they offset passive income freely, and up to $25,000/yr can offset ordinary (W-2) income if you actively participate and your MAGI is under $100k (phasing out to $0 by $150k); unused losses carry forward. On sale, claimed depreciation is recaptured at up to 25%, and gains may owe capital-gains tax (a 1031 exchange can defer both). Figures are a year-1 estimate at your 24.0% rate — not tax advice; consult a CPA.
Schools (NCES district)
- District
- Madison County
- NCES district ID
- 0102220
- Math proficiency
- 27% ▼ -32.00%
- Reading proficiency
- 56% ▼ -1.00%
- Median HH income
- $66,058
- Composite
- 37.15/100
- National rank
- #4483
- State rank
- #19 of 129 in AL
Livability — Huntsville
- Score
- 82/100
- State rank
- #3
- US rank
- #1082
Category grades
Schools grade is shown separately in the Schools card above.
Census & demographics
- County
- Madison County · 380,832 people
- City population
- 220,435
- Metro
- Huntsville, AL
- Population (ZIP)
- 29,161
- Household income
- $86,768
- Rent vs Own
- Severe rent burden
- 1249.0
Population outlook (Madison County) Hauer SSP2
- Today (2025)
- 392,086 people
- By 2030
- 409,788 · +4.5%
- By 2040
- 440,557 · +12.4%
- By 2050
- 460,990 · +17.6%
- By 2075
- 502,872 · +28.3%
- By 2100
- 513,623 · +31.0%
Race, ethnicity, and origin ACS 2023
- Neighborhood character
- Diverse neighborhood (Simpson 0.57)
- Race & ethnicity
- White 58% Black 30% Hispanic / Latino 5% Two or more races 5% Asian 4%
- Hispanic origin (detail)
- Mexican 2% Puerto Rican 2%
- Common ancestry
- Slovak 2% Italian 2% Serbian 2%
- Foreign-born
- 7% · Canada, Vietnam, China
- Languages at home
- 93% English-only · Spanish 2% Other Indo-European 1% Other Asian/Pacific 1%
Political lean MEDSL · Madison
- 2024 margin
- Lean R (+9.0) · D 44.7% · R 53.7% · Other 1.6%
- 2008→2024 swing
- +6.0pp toward D · 2008: -14.9pp · 2024: -9.0pp
- All cycles
- 2024: R+9.0 2020: R+8.0 2016: R+16.8 2012: R+18.7 2008: R+14.9
Not yet ingested
- Civics
- —
Market trends
- HPI YoY
- ▲ 71.67%
- Current HPI
- 430.5866
- Rent YoY
- ▲ 2.57%
- Metro
- Huntsville, AL
- State GDP YoY
- ▲ 2.94%
- F500 in state
- 4
Industry mix (Fortune 500 HQ in AL)
| Industry | F500 HQs | Revenue |
|---|---|---|
| Financial Services | 1 | $8B |
|
||
| Healthcare | 1 | $5B |
|
||
Price history
1 event — show timeline
- 2026-03-14 Listed $200,000 VMLS
Property tax history
+8.0%/yrLatest (2024): $429 · -1.5% YoY. Source: county tax records.
Cash-flow waterfall
monthlySold comps — $/sqft
last 12 mo · ≤1 miLoading sold comps…