7901 E State Route 69 #72 · Prescott Valley, AZ
Flood risk 1/10 · Minimal
- FEMA flood zone
- X (unshaded)
- Chance of flooding over 30 yrs
- 0.0%
- Est. flood insurance / yr
- $507 – $1,088
Fire risk 5/10 · Moderate
- Est. fire insurance / yr
- $610 – $1,132
Heat risk 4/10 · Minor
- Hot days now (above 94°F)
- 1 days/yr
- Hot days in 30 yrs
- 4 days/yr
Wind risk 1/10 · Minimal
- Chance of severe wind over 30 yrs
- —
Air-quality risk 1/10 · Minimal
- Unhealthy air days now
- 0 days/yr
- Unhealthy air days in 30 yrs
- 0 days/yr
Risk factors via First Street. Map © Google.
Why this score? — see what drove the B- grade
The composite is a weighted blend of 9 inputs, each scored 0–100. Each bar is that input's sub-score; the figure is the points it added to the 100-point composite (weight × sub-score).
- Cash flow +30.0/30.0
- 1% rule +10.0/10.0
- DSCR +10.0/10.0
- ARV discount +7.5/15.0
- Livability +3.1/5.0
- Schools +2.9/10.0
- Rent growth +2.7/5.0
- Condition / age +2.2/5.0
- Appreciation +0.0/10.0
$86,000
🖨 Deal sheet (PDF) 📄 Offer letter ✓ Due diligence
Listing remarks MLS
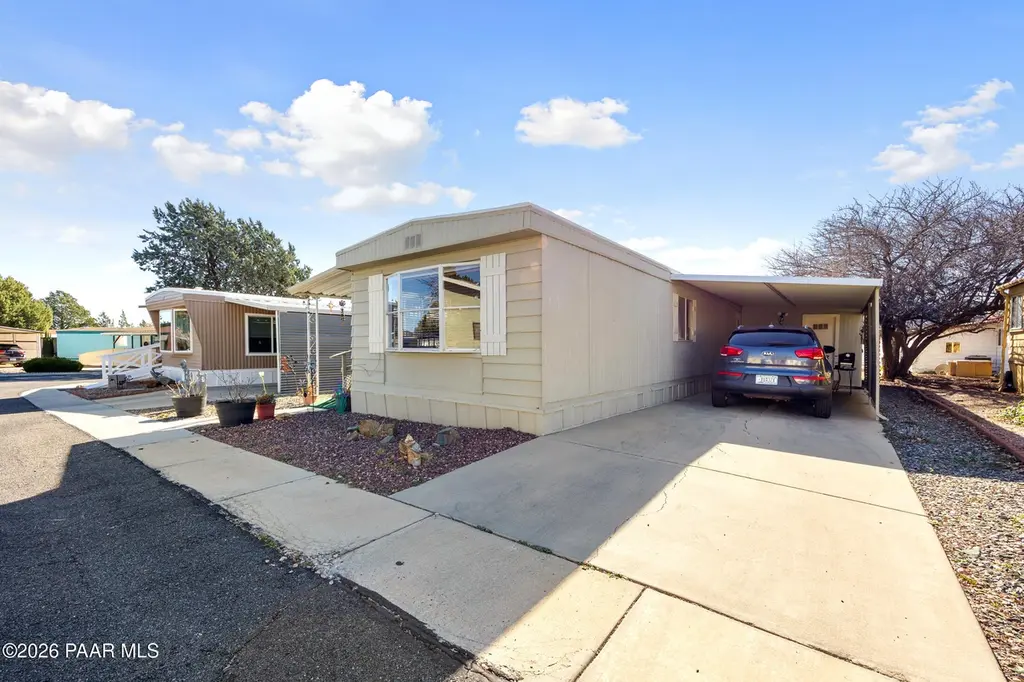
Affordable 2-bedroom home that's cozy and move-in ready, perfect for easy living .The added Arizona room provides extra space, along with a convenient carport. Low-maintenance and ideally located in this desirable 55+ park-- Lot rent includes water, trash & sewer $693.40 schedule your showing today!
Key facts
- Arizona room
- Carport
- Parking
Tags
Neighborhood map
What this means for you Summary
Snapshot
- This is a 2-bed/1.0-bath single-family listed at $86k. Condition is rated fair.
Deal economics
- At list price, monthly cash flow is $751 ($9k/yr) — positive.
- The deal already cash-flows at list — no discount required.
- Meets the 1% rule at list price ($2k rent vs $86k).
- Recommended offer: $76k (12.0% below list) — sets the bar for market timing.
- Cap rate 16.8% vs local median 3.2% in Prescott Valley — top-decile yield for the area; either an underpriced asset or a hidden risk that comps aren't pricing in. Stress-test before assuming the spread holds.
Location & tenants
- Location reads 62/100 on livability (#126 in AZ) — a middle-class / working-renter tenant base. Strengths: housing A+, crime A-; Watch: schools C-, amenities F, commute F.
- Humboldt Unified District (4469) (suburban): math 31% / reading 37% proficiency, ranked #94 of 249 in AZ (top 38%) — families likely to look elsewhere, expect single-tenant / working-renter base with shorter leases.
- Market conditions: Rents flat; 447 active listings in the ZIP; 19 comparable units currently listed for rent nearby; rentals at typical pace (median 22d on market — plan ~3-4 weeks tenant-placement turnaround); 42% of comp listings sitting > 30 days — soft ceiling on asking rent; 2,062 units permitted in Yavapai County in 2024 (98 in 5+ unit buildings).
Forward outlook
- Local home prices are declining (-3.0%/yr); year-one equity from $595 of loan paydown is wiped out by about $3k of value loss. Plan a longer hold.
- Yavapai County population projected at +10% by 2050 — modest demand growth; plan on rents tracking national, not racing it.
- At projected returns (-3.0% appreciation + 1.0% rent growth), your $24k cash investment doubles in ~4 years — after that, you're playing with house money.
Negotiation context
- It's been on market 133 days — a 12% lower offer ($76k) is reasonable based on typical stale-listing flexibility.
Risks & watch-outs
- Climate carrying-cost: moderate wildfire risk — expect insurance premiums to compound above CPI over the hold.
Questions for the listing agent
- It's been on market 133 days. Have you received any prior offers? Is the seller open to a 12% concession, seller financing, or rate buy-down credit?
- Have any recent inspections been done? Can we get a copy of the seller's disclosures and any deferred-maintenance estimates?
- Built in 1978 — when were the roof, HVAC, electrical panel, plumbing, and water heater last replaced?
- Why hasn't it sold? Are there any deal-killer items the seller is aware of (foundation, flood, title, zoning, code violations)?
- Is there a deadline driving the sale (1031 exchange, divorce, estate, relocation)? That informs how much negotiation room exists.
- What's the average days-on-market for RENTAL listings here right now (not sales)? A rising rental-DOM trend means longer vacancies and softer asking-rent achievability than the comps imply.
- What's the recent tenant-quality profile in this submarket — average credit score on applications, eviction rate, late-payment / NSF rate, and stable-employment percentage? A property-management company in the area should have these aggregated.
- How much new for-sale + rental construction is in the pipeline within 1–3 miles? Heavy new supply typically softens prices + rents 12–24 months out; constrained supply supports both.
Investment metrics
- 1% rule
- 1.98% ✓
- Cap rate
- 16.77%
- Cash-on-cash
- 37.41%
- DSCR
- 2.66
- GRM
- 4.2
CMA / ARV
- ARV (median comp)
- $283,242
- List price
- $86,000
- Delta
- -69.64%
- Verdict
- UNDERPRICED
- Comps
- 18 within 1.0 mi
Show comp detail 5 sales within ~0.75 mi
| Address | Dist | Beds/Ba | Sqft | Sold | Price | $/sf | Match |
|---|---|---|---|---|---|---|---|
| 7901 E State Route 69 #58 | 0.06mi | 2/1.0 | 784 (-7%) | 4mo | $101,500 | $129 | 82 |
| 7901 E State Route 69 #77 | 0.06mi | 2/2.0 | 900 (+7%) | 1mo | $148,000 | $164 | 81 |
| 7901 E State Route 69 #38 | 0.00mi | 2/1.5 | 910 (+8%) | 6mo | $68,950 | $76 | 79 |
| 7901 E State Route 69 #47 | 0.00mi | 2/2.0 | 896 (+7%) | 11mo | $55,000 | $61 | 76 |
| 11250 E State Route 69 2183 | 0.46mi | 2/2.0 | 880 (+5%) | 14mo | $136,000 | $155 | 55 |
Match score weights: distance 35% · size 25% · config 20% · recency 20%. Top-matched comps best support the ARV.
Projected returns pro-forma
-3.0% appreciation · 0.97% rent growth · sell at horizon
- IRR
- 31.0%
- Equity multiple
- 2.27×
- Total profit
- $30,489
- Equity at exit
- $12,823
- IRR
- 37.1%
- Equity multiple
- 4.11×
- Total profit
- $74,786
- Equity at exit
- $7,436
Cash invested: $24,080 (down + closing). Projections, not guarantees.
Landlord ↔ Tenant lean methodology
- Overall (STATE)
- 87 Strongly Landlord-Friendly
- State Arizona
- 87 Strongly Landlord-Friendly · R+3
- County
- — inherits STATE
- City
- — inherits STATE
ZIP-level market 86314
- Home prices YoY
- -32.3%
- Rents YoY
- 1.0%
- Active inventory
- 447
- Price-to-rent
- 4.2×
Monthly cashflow live
- Estimated rent
- $1,702 high interval (Pro) →
- Mortgage (P&I)
- −$451
- Tax est. 1.5%
- −$108 /mo · $1,290/yr
- Insurance
- −$36
- HOA
- −$0
- Vacancy / Maint / Mgmt
- −$358
- Net cashflow
- $751
Break-even live
Sensitivity live
| Price | -10% $810 | -5% $780 | +0% $751 | +5% $721 | +10% $691 |
|---|---|---|---|---|---|
| Rent | -10% $616 | -5% $683 | +0% $751 | +5% $818 | +10% $885 |
| Rate | -1.0pp $794 | -0.5pp $772 | base $751 | +0.5pp $728 | +1.0pp $706 |
UW: 25.0% down · 7.5% · 30yr · 1.5% tax · 5.0% vac · 8.0% maint · 8.0% mgmt
Financing live
Cash to close
- Down payment
- $21,500
- Closing costs
- $2,580
- Reserves months
- —
- Total cash needed
- —
Loan-product check · same deal, 3 products live
Conventional
25% down · 7.5% · 30yr
- Down + closing
- —
- Monthly P&I
- —
- Monthly cashflow
- —
- DSCR
- —
- Eligible?
- —
Personal DTI + credit; lowest rate.
DSCR
20% down · 8.5% · 30yr
- Down + closing
- —
- Monthly P&I
- —
- Monthly cashflow
- —
- DSCR
- —
- Eligible?
- —
No personal income docs; deal must DSCR.
Hard money
10% down · 12.0% · 12mo
- Down + closing
- —
- Monthly P&I
- —
- Monthly cashflow
- —
- DSCR
- —
- Eligible?
- —
Short-term bridge; refi at stabilization.
Rent comps 19 comps
| Address | Beds | Baths | Sqft | Rent | $/sqft | DOM | Units | Dist |
|---|---|---|---|---|---|---|---|---|
| 2885 N Panorama Dr Prescott Valley, AZ | 2.0 | 2.0 | 1056 | $1,800 | $1.70 | 14d | 1 | 0.10mi |
| 2885 N Panorama Dr Prescott Valley, AZ | 2.0 | 2.0 | 1056 | $1,800 | $1.70 | 44d | 1 | 0.10mi |
| 3230 N Victor Rd Unit C Prescott Valley, AZ | 2.0 | 1.0 | 850 | $1,350 | $1.59 | 14d | 1 | 0.35mi |
| 3148 N Navajo Dr Unit C Prescott Valley, AZ | 2.0 | 1.5 | 1024 | $1,425 | $1.39 | 22d | 1 | 0.54mi |
| 3131 N Main St Prescott Valley, AZ | 1.0–3.0 | 1.0–2.0 | 935 | $1,722 | $1.84 | 14d | 33 | 0.59mi |
| 3290 N Bumblebee Dr Unit A Prescott Valley, AZ | 2.0 | 2.0 | 1050 | $1,550 | $1.48 | 14d | 1 | 0.60mi |
| 8683 E Commons Cir Prescott Valley, AZ | 1.0–2.0 | 1.0–2.0 | 834 | $1,785 | $2.14 | 14d | 5 | 0.78mi |
| 8132 E Lakeshore Dr Unit B Prescott Valley, AZ | 2.0 | 2.0 | 890 | $1,400 | $1.57 | 44d | 1 | 0.81mi |
| 3028 N Corrine Dr Unit A Prescott Valley, AZ | 2.0 | 1.0 | 889 | $1,600 | $1.80 | 22d | 1 | 0.82mi |
| 3123 N Corrine Dr Apt B Prescott Valley, AZ | 2.0 | 2.0 | 1111 | $1,595 | $1.44 | 44d | 1 | 0.91mi |
| 3830 N Windsong Dr Prescott Valley, AZ | 1.0–3.0 | 1.0–2.0 | 1097 | $2,034 | $1.85 | 14d | 22 | 0.94mi |
| 3231 N Corrine Dr Unit B Prescott Valley, AZ | 2.0 | 2.0 | 948 | $1,500 | $1.58 | 44d | 1 | 0.98mi |
| 3184 N Truwood Dr Unit D Prescott Valley, AZ | 2.0 | 1.0 | 600 | $1,100 | $1.83 | 22d | 1 | 0.99mi |
| 3279 N Corrine Dr Unit A Prescott Valley, AZ | 2.0 | 1.0 | 738 | $1,400 | $1.90 | 44d | 1 | 1.01mi |
| 8396 E Stevens Dr Unit B Prescott Valley, AZ | 2.0 | 2.0 | 978 | $2,000 | $2.04 | 44d | 1 | 1.03mi |
| 8396 E Stevens Dr Unit A Prescott Valley, AZ | 2.0 | 2.0 | 950 | $2,000 | $2.11 | 44d | 1 | 1.03mi |
| 3866 E Teri Ct Unit A Prescott Valley, AZ | 3.0 | 2.0 | 1050 | $1,675 | $1.60 | 14d | 1 | 1.08mi |
| 3901 N Main St Prescott Valley, AZ | 1.0–3.0 | 1.0–2.0 | 978 | $1,910 | $1.95 | 14d | 16 | 1.34mi |
| 4357 N Miner Rd Prescott Valley, AZ | 2.0 | 2.0 | 960 | $1,600 | $1.67 | 44d | 1 | 1.45mi |
Listing history 15 events
-
2026-06-18days on market $86,000 Active 133 DOM
-
2026-06-17days on market $86,000 Active 132 DOM
-
2026-06-16days on market $86,000 Active 131 DOM
-
2026-06-15days on market $86,000 Active 130 DOM
-
2026-06-14days on market $86,000 Active 128 DOM
-
2026-06-13days on market $86,000 Active 127 DOM
-
2026-06-10days on market $86,000 Active 125 DOM
-
2026-06-09days on market $86,000 Active 124 DOM
-
2026-06-08days on market $86,000 Active 123 DOM
-
2026-06-07days on market $86,000 Active 122 DOM
-
2026-06-02days on market $86,000 Active 117 DOM
-
2026-06-01days on market $86,000 Active 116 DOM
-
2026-05-31days on market $86,000 Active 115 DOM
-
2026-05-30days on market $86,000 Active 114 DOM
-
2026-02-05$86,000 Active 305-char remark
Show marketing remark (305 chars)
Affordable 2-bedroom home that's cozy and move-in ready, perfect for easy living .The added Arizona room provides extra space, along with a convenient carport. Low-maintenance and ideally located in this desirable 55+ park-- Lot rent includes water, trash & sewer $693.40 schedule your showing today!
ⓘ Source: listings_history table (triggers on properties + properties_extension) + one-shot
backfill from property_details.listing_events for pre-trigger history.
Climate risk First Street
- Flood 1/10 Low FEMA zone X (unshaded) · 0% chance over 30 yrs
- Wildfire 5/10 Major
- Heat 4/10 Moderate 1 d/yr ≥94°F today · 4 d/yr by 30 yrs out
- Wind 1/10 Low
- Air quality 1/10 Low 0 unhealthy d/yr today · 0 by 30 yrs out
Nearby sold comps map
Loading sold comps map…
Walkable amenities ~0.75 mi
Loading nearby amenities…
Taxation est. · year 1
- Rental income
- $20,430
- − Mortgage interest
- −$4,817
- − Property taxes
- −$1,290
- − Insurance
- −$430
- − Repairs & maintenance
- −$1,634
- − Management
- −$1,634
- − Depreciation
- −$2,502
- Taxable income
- $8,122
- Est. tax owed @ 24.0%
- −$1,949
- After-tax cash flow
- $7,058/yr
For passive investors: Depreciation is non-cash, so a rental often shows a tax loss while cash-flowing — sheltering income. Rental losses are passive: they offset passive income freely, and up to $25,000/yr can offset ordinary (W-2) income if you actively participate and your MAGI is under $100k (phasing out to $0 by $150k); unused losses carry forward. On sale, claimed depreciation is recaptured at up to 25%, and gains may owe capital-gains tax (a 1031 exchange can defer both). Figures are a year-1 estimate at your 24.0% rate — not tax advice; consult a CPA.
Condition & rehab AI · 12 photos
This home is move-in ready with some moderate repairs needed, particularly in the kitchen and exterior. Painting and updating the kitchen and exterior would significantly enhance its value.
Repairs flagged
- Moderate Kitchen cabinets — Worn appearance
- Moderate Bathroom fixtures — Dated appearance
- Moderate Exterior siding — Weathered appearance
Value-add opportunities
- Both Paint interior walls — Fresh paint enhances curb appeal and interior aesthetics
- Both Replace worn kitchen cabinets — New cabinets improve functionality and aesthetics
- Both Replace worn exterior siding — Fresh siding enhances curb appeal and structural integrity
Renovation cost estimate screening
| Repair item | Severity | Est. cost |
|---|---|---|
| Kitchen cabinets · Worn appearance | Moderate | $3,000–15,000 |
| Bathroom fixtures · Dated appearance | Moderate | $3,000–15,000 |
| Exterior siding · Weathered appearance | Moderate | $3,000–15,000 |
| Total estimated repair cost · 3 items | $9,000–45,000 |
Value-add ROI direction
- Both Paint interior walls — Fresh paint enhances curb appeal and interior aesthetics ↑
- Both Replace worn kitchen cabinets — New cabinets improve functionality and aesthetics ↑
- Both Replace worn exterior siding — Fresh siding enhances curb appeal and structural integrity ↑
ⓘ Cost ranges are severity-bucket heuristics (US national rule-of-thumb). Get contractor quotes + a written scope before underwriting a rehab budget.
Schools (NCES district)
- District
- Humboldt Unified District (4469)
- NCES district ID
- 0403870
- Math proficiency
- 31% ▼ -13.00%
- Reading proficiency
- 37% ▼ -14.00%
- Median HH income
- $45,326
- Composite
- 29.06/100
- National rank
- #6605
- State rank
- #94 of 249 in AZ
Livability — Prescott Valley
- Score
- 62/100
- State rank
- #126
- US rank
- #16160
Category grades
Schools grade is shown separately in the Schools card above.
Census & demographics
- Census place
- Prescott Valley, AZ
- County
- Yavapai County · 190,406 people
- City population
- 63,155
- Metro
- Prescott Valley-Prescott, AZ
- Population (ZIP)
- 40,317
- Household income
- $69,208
- Rent vs Own
- Severe rent burden
- 1236.0
Population outlook (Yavapai County) Hauer SSP2
- Today (2025)
- 241,389 people
- By 2030
- 249,523 · +3.4%
- By 2040
- 259,966 · +7.7%
- By 2050
- 264,736 · +9.7%
- By 2075
- 269,334 · +11.6%
- By 2100
- 256,505 · +6.3%
Race, ethnicity, and origin ACS 2023
- Neighborhood character
- Predominantly White (71%)
- Race & ethnicity
- White 71% Hispanic / Latino 22% Two or more races 15% Asian 1% Native American 1%
- Hispanic origin (detail)
- Mexican 20%
- Common ancestry
- Slovak 4% Lithuanian 3% Romanian 3%
- Foreign-born
- 8% · Canada
- Languages at home
- 83% English-only · Spanish 15%
Political lean MEDSL · Yavapai
- 2024 margin
- Solid R (+33.9) · D 32.6% · R 66.5%
- 2008→2024 swing
- -9.5pp toward R · 2008: -24.4pp · 2024: -33.9pp
- All cycles
- 2024: R+33.9 2020: R+29.3 2016: R+31.4 2012: R+30.7 2008: R+24.4
Not yet ingested
- Civics
- —
Market trends
- HPI YoY
- ▼ -176.27%
- Current HPI
- 370.04
- Rent YoY
- ▲ 0.97%
- Metro
- Prescott Valley-Prescott, AZ
- State GDP YoY
- ▲ 4.54%
- F500 in state
- 20
Industry mix (Fortune 500 HQ in AZ)
| Industry | F500 HQs | Revenue |
|---|---|---|
| Technology | 2 | $13B |
|
||
| Mining / Metals | 1 | $23B |
|
||
| Environmental Services | 1 | $16B |
|
||
| Metals / Steel | 1 | $14B |
|
||
| Technology Distribution | 1 | $9B |
|
||
| Homebuilding | 1 | $8B |
|
||
Price history
1 event — show timeline
- 2026-02-05 Listed $86,000 PAARMLS as Distributed by MLS Grid
Cash-flow waterfall
monthlySold comps — $/sqft
last 12 mo · ≤1 miLoading sold comps…