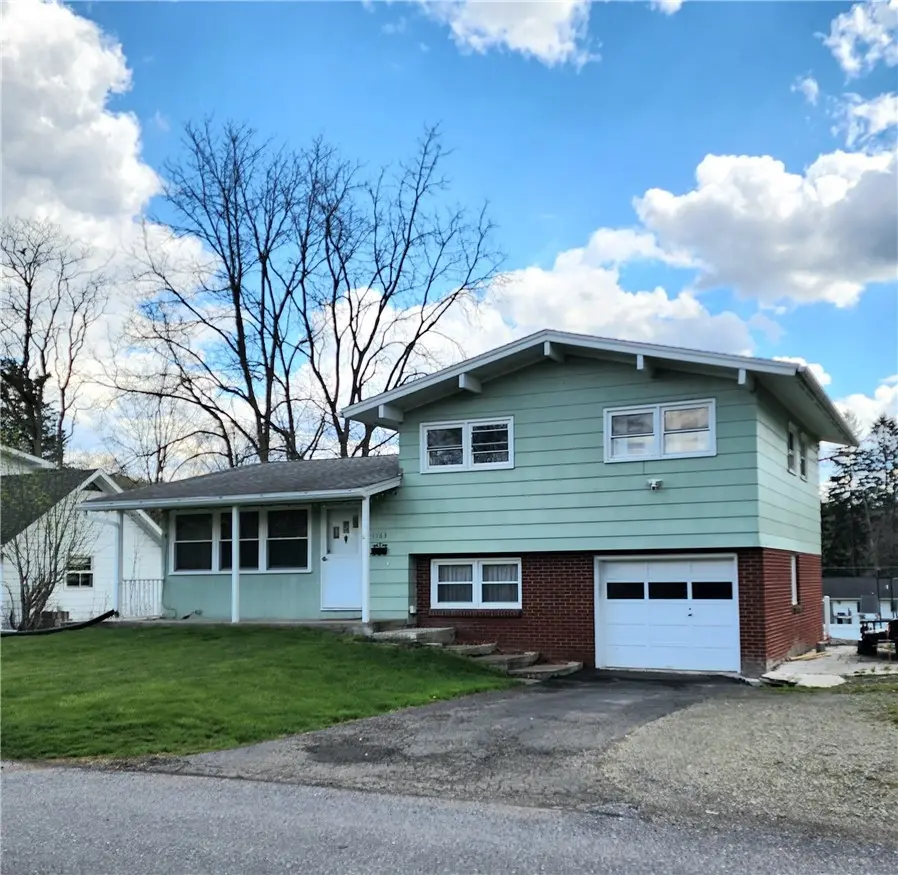
1163 Cherry Street Ext · Wellsboro, PA
Flood risk 1/10 · Minimal
- FEMA flood zone
- X (unshaded)
- Chance of flooding over 30 yrs
- 0.0%
- Est. flood insurance / yr
- $473 – $860
Fire risk 2/10 · Minimal
- Est. fire insurance / yr
- $511 – $949
Heat risk 3/10 · Minor
- Hot days now (above 91°F)
- 8 days/yr
- Hot days in 30 yrs
- 18 days/yr
Wind risk 2/10 · Minimal
- Chance of severe wind over 30 yrs
- —
Air-quality risk 2/10 · Minimal
- Unhealthy air days now
- 0 days/yr
- Unhealthy air days in 30 yrs
- 1 days/yr
Risk factors via First Street. Map © Google.
Why this score? — see what drove the D- grade
The composite is a weighted blend of 9 inputs, each scored 0–100. Each bar is that input's sub-score; the figure is the points it added to the 100-point composite (weight × sub-score).
- ARV discount +10.2/15.0
- Appreciation +10.0/10.0
- Schools +4.1/10.0
- Livability +3.8/5.0
- Cash flow +3.4/30.0
- Rent growth +2.5/5.0
- Condition / age +2.5/5.0
- 1% rule +0.0/10.0
- DSCR +0.0/10.0
$229,900
🖨 Deal sheet (PDF) 📄 Offer letter ✓ Due diligence
Listing remarks
Welcome to 1163 Cherry Street Extension in Wellsboro—where comfort, updates, and space come together in this inviting split-level home. This well-maintained property features 4 spacious bedrooms and 2 full bathrooms, offering plenty of room for family, guests, or a home office setup. The heart of the home is the beautifully updated kitchen, designed with modern finishes and functionality in mind—perfect for both everyday living and entertaining. Major mechanical upgrades provide peace of mind, including a brand-new furnace and hot water heater, along with a new washer and dryer for added convenience. Step outside onto the deck and enjoy views of the generously sized yard—i
Key facts
- New furnace
- New washer and dryer
- New hot water heater
Tags
Property features AI
Exterior
- Parking: Attached garage; 1 garage space
- Security: Owned security system; Radon mitigation system
- Utilities: Public water connected; Sewer connected; Cable available
- Home design: 4 stories; Existing property; Resale
- Construction: Block foundation; Copper plumbing; See remarks for additional construction details
- Exterior features: Deck; Fence (partial); Blacktop driveway; Rectangular residential lot; City street frontage
Interior
- Kitchen: Gas oven; Gas range; Microwave; Refrigerator
- Bedrooms: 1 bedroom on the main level
- Flooring: Hardwood; Vinyl; Varies
- Bathrooms: 2 full bathrooms (1 on the main level)
- Heating & cooling: Gas heating; Baseboard heating; Hot water heating
- Interior features: Separate/formal dining room; Bedroom on main level; Partially finished basement with walk-out access
- Laundry & utility: Laundry in basement; Dryer; Gas water heater
Neighborhood map
What this means for you Summary
Snapshot
- This is a 3-bed/2.5-bath single-family listed at $230k.
Deal economics
- At list price, monthly cash flow is $-701 ($-8k/yr) — negative.
- To cash-flow at today's rent, offer at most $106k (53.9% below list).
- To meet the 1% rule (rent ≥ 1% of price), the offer needs to be $106k (53.9% below list).
- Recommended offer: $106k (53.9% below list) — sets the bar for 1% rule.
Location & tenants
- Location reads 75/100 on livability (#426 in PA, #3,882 nationally) — a middle-class / working-renter tenant base. Strengths: crime A+, cost of living A+, health & safety A+; Watch: amenities F, commute F, employment D-.
- Wellsboro Area SD (rural): math 37% / reading 58% proficiency, ranked #230 of 539 in PA (top 43%) — families likely to look elsewhere, expect single-tenant / working-renter base with shorter leases.
- Zoned schools: Don Gill El Sch (math 33% / reading 51%, grade F, #883 of 1,518 statewide, top 61%, 318 students, 55% FRL); Rock L Butler Ms (math 32% / reading 61%, grade D+, #172 of 512 statewide, top 35%, 480 students, 50% FRL); Wellsboro Area Hs (math 77%, 439 students, 45% FRL) — zoned schools average 50% FRL vs 31% district-wide (20 pts higher); higher-poverty schools than district average — tighter screening recommended.
- Market conditions: 35 active listings in the ZIP; 2 comparable units currently listed for rent nearby; 32 units permitted in Tioga County in 2024 (0 in 5+ unit buildings).
Forward outlook
- In year one you build about $25k of equity ($2k loan paydown + $23k appreciation (10.0% local appreciation)).
- Tioga County population projected at -20% by 2050 — secular population decline; favor cash flow + early exit over multi-decade hold.
- By year 2, paydown + projected appreciation supports a ~$40k cash-out refi (75% LTV) — recoverable capital for the next deal without selling this one.
Negotiation context
- It's been on market 58 days — a 3% lower offer ($223k) is reasonable based on typical stale-listing flexibility.
- 8 sale attempts since 12y ago with the ask held roughly flat each time — persistent listings suggest the price (not the market) is what's stuck; bring a comps-based counter.
- Current owner paid $145k; list at $230k implies a 59% gain — meaningful room to come down on a strong offer.
Questions for the listing agent
- What do current leases actually rent for vs. the listed asking? Can we see a recent rent roll and the last 12 months of T-12 income?
- It's been on market 58 days. Have you received any prior offers? Is the seller open to a 54% concession, seller financing, or rate buy-down credit?
- Built in 1960 — when were the roof, HVAC, electrical panel, plumbing, and water heater last replaced?
- Is there a deadline driving the sale (1031 exchange, divorce, estate, relocation)? That informs how much negotiation room exists.
- Schools are A-rated — typically a magnet for longer-tenancy family renters. What's the average tenant stay here, and is there a school-zone premium baked into asking?
- The area grade is low — what's the realistic commute time and amenity access for the typical tenant pool here? Any planned neighborhood developments (good or bad) we should know about?
- What's the average days-on-market for RENTAL listings here right now (not sales)? A rising rental-DOM trend means longer vacancies and softer asking-rent achievability than the comps imply.
- What's the recent tenant-quality profile in this submarket — average credit score on applications, eviction rate, late-payment / NSF rate, and stable-employment percentage? A property-management company in the area should have these aggregated.
- How much new for-sale + rental construction is in the pipeline within 1–3 miles? Heavy new supply typically softens prices + rents 12–24 months out; constrained supply supports both.
Investment metrics
- 1% rule
- 0.46% ✗
- Cap rate
- 2.63%
- Cash-on-cash
- -13.06%
- DSCR
- 0.42
- GRM
- 18.1
CMA / ARV
- ARV (median comp)
- $244,788
- List price
- $229,900
- Delta
- -6.08%
- Verdict
- FAIR
- Comps
- 20 within 1.0 mi
Show comp detail 3 sales within ~0.75 mi
| Address | Dist | Beds/Ba | Sqft | Sold | Price | $/sf | Match |
|---|---|---|---|---|---|---|---|
| 12 Kelsey St | 0.04mi | 4/1.0 (+1) | 1,404 (+4%) | 2mo | $140,000 | $100 | 78 |
| 44 West Water St | 0.25mi | 4/2.0 (+1) | 1,400 (+4%) | 20mo | $181,500 | $130 | 57 |
| 60 Pearl St | 0.47mi | 3/1.5 | 1,218 (-9%) | 17mo | $181,000 | $149 | 44 |
Match score weights: distance 35% · size 25% · config 20% · recency 20%. Top-matched comps best support the ARV.
Projected returns pro-forma
10.0% appreciation · 3.0% rent growth · sell at horizon
- IRR
- 15.2%
- Equity multiple
- 2.25×
- Total profit
- $80,557
- Equity at exit
- $207,112
- IRR
- 14.8%
- Equity multiple
- 5.23×
- Total profit
- $272,300
- Equity at exit
- $446,645
Cash invested: $64,372 (down + closing). Projections, not guarantees.
Landlord ↔ Tenant lean methodology
- Overall (STATE)
- 62 Landlord-Friendly
- State Pennsylvania
- 62 Landlord-Friendly · EVEN
- County
- — inherits STATE
- City
- — inherits STATE
ZIP-level market 16901
- Home prices YoY
- 4.6%
- Active inventory
- 35
- Price-to-rent
- 18.1×
Monthly cashflow live
- Estimated rent
- $1,060 medium interval (Pro) →
- Mortgage (P&I)
- −$1,206
- Tax from tax record
- −$237 /mo · $2,842/yr
- Insurance
- −$96
- HOA
- −$0
- Vacancy / Maint / Mgmt
- −$223
- Net cashflow
- $-701
Break-even live
Sensitivity live
| Price | -10% $-571 | -5% $-636 | +0% $-701 | +5% $-766 | +10% $-831 |
|---|---|---|---|---|---|
| Rent | -10% $-785 | -5% $-743 | +0% $-701 | +5% $-659 | +10% $-617 |
| Rate | -1.0pp $-585 | -0.5pp $-642 | base $-701 | +0.5pp $-760 | +1.0pp $-821 |
UW: 25.0% down · 7.5% · 30yr · 1.5% tax · 5.0% vac · 8.0% maint · 8.0% mgmt
Financing live
Cash to close
- Down payment
- $57,475
- Closing costs
- $6,897
- Reserves months
- —
- Total cash needed
- —
Loan-product check · same deal, 3 products live
Conventional
25% down · 7.5% · 30yr
- Down + closing
- —
- Monthly P&I
- —
- Monthly cashflow
- —
- DSCR
- —
- Eligible?
- —
Personal DTI + credit; lowest rate.
DSCR
20% down · 8.5% · 30yr
- Down + closing
- —
- Monthly P&I
- —
- Monthly cashflow
- —
- DSCR
- —
- Eligible?
- —
No personal income docs; deal must DSCR.
Hard money
10% down · 12.0% · 12mo
- Down + closing
- —
- Monthly P&I
- —
- Monthly cashflow
- —
- DSCR
- —
- Eligible?
- —
Short-term bridge; refi at stabilization.
Rent comps 2 comps
| Address | Beds | Baths | Sqft | Rent | $/sqft | DOM | Units | Dist |
|---|---|---|---|---|---|---|---|---|
| 18 Pearl St Wellsboro, PA | 2.0 | 1.0 | 1200 | $750 | $0.62 | 45d | 1 | 0.76mi |
| 10 Cone St Wellsboro, PA | 2.0 | 1.0 | 1763 | $1,600 | $0.91 | 45d | 1 | 1.13mi |
Listing history 33 events
-
2026-06-21days on market $229,900 Active 58 DOM
-
2026-06-21days on market $229,900 Active 57 DOM
-
2026-06-18days on market $229,900 Active 55 DOM
-
2026-06-17days on market $229,900 Active 54 DOM
-
2026-06-16days on market $229,900 Active 53 DOM
-
2026-06-15days on market $229,900 Active 52 DOM
-
2026-06-13days on market $229,900 Active 50 DOM
-
2026-06-12days on market $229,900 Active 49 DOM
-
2026-06-09days on market $229,900 Active 46 DOM
-
2026-06-08days on market $229,900 Active 45 DOM
-
2026-06-08days on market $229,900 Active 44 DOM
-
2026-06-07days on market $229,900 Active 43 DOM
-
2026-06-04days on market $229,900 Active 40 DOM
-
2026-06-02days on market $229,900 Active 39 DOM
-
2026-06-01days on market $229,900 Active 38 DOM
-
2026-05-31days on market $229,900 Active 37 DOM
-
2026-04-24$229,900 Active 954-char remark
-
2024-11-06price $214,000
-
2024-09-17status Active
-
2024-09-11historical Active Under Contract
-
2024-09-05price $234,900
-
2024-08-19$239,900 Active
-
2024-07-12historical
-
2024-05-22status Active
-
2024-04-29historical Active Under Contract
-
2024-04-25price $234,900
-
2024-01-22price $239,500
-
2023-10-14$244,900 Active
-
2023-10-14$239,500
-
2021-05-07soldstatus $145,000
-
2020-09-09$149,900
-
2014-05-23soldstatus $126,500
-
2014-05-05$135,900
ⓘ Source: listings_history table (triggers on properties + properties_extension) + one-shot
backfill from property_details.listing_events for pre-trigger history.
Tax reassessment forecast PA · Partial reset (capped growth)
- Current annual tax
- $2,842 · $237/mo
- Projected year-2 tax
- $3,237 · $270/mo
- Expected delta
- +$395/yr (+$33/mo · 13.9%)
ⓘ Screening estimate from a state-policy table — verify with the county assessor before closing.
Climate risk First Street
- Flood 1/10 Low FEMA zone X (unshaded) · 0% chance over 30 yrs
- Wildfire 2/10 Low
- Heat 3/10 Moderate 8 d/yr ≥91°F today · 18 d/yr by 30 yrs out
- Wind 2/10 Low
- Air quality 2/10 Low 0 unhealthy d/yr today · 1 by 30 yrs out
Nearby sold comps map
Loading sold comps map…
Walkable amenities ~0.75 mi
Loading nearby amenities…
Taxation est. · year 1
- Rental income
- $12,720
- − Mortgage interest
- −$12,878
- − Property taxes
- −$2,842
- − Insurance
- −$1,150
- − Repairs & maintenance
- −$1,018
- − Management
- −$1,018
- − Depreciation
- −$6,688
- Taxable loss
- −$12,873
- Est. tax savings @ 24.0%
- +$3,089
- After-tax cash flow
- $-5,321/yr
For passive investors: Depreciation is non-cash, so a rental often shows a tax loss while cash-flowing — sheltering income. Rental losses are passive: they offset passive income freely, and up to $25,000/yr can offset ordinary (W-2) income if you actively participate and your MAGI is under $100k (phasing out to $0 by $150k); unused losses carry forward. On sale, claimed depreciation is recaptured at up to 25%, and gains may owe capital-gains tax (a 1031 exchange can defer both). Figures are a year-1 estimate at your 24.0% rate — not tax advice; consult a CPA.
Schools (NCES district)
- District
- Wellsboro Area SD
- NCES district ID
- 4225170
- Math proficiency
- 37% ▼ -12.00%
- Reading proficiency
- 58% ▼ -15.00%
- Median HH income
- $48,861
- Composite
- 40.52/100
- National rank
- #3710
- State rank
- #230 of 539 in PA
Livability — Wellsboro
- Score
- 75/100
- State rank
- #426
- US rank
- #3882
Category grades
Schools grade is shown separately in the Schools card above.
Census & demographics
- Census place
- Wellsboro, PA
- City population
- 10,416
- Population (ZIP)
- 10,416
Population outlook (Tioga County) Hauer SSP2
- Today (2025)
- 40,253 people
- By 2030
- 38,795 · -3.6%
- By 2040
- 35,376 · -12.1%
- By 2050
- 32,081 · -20.3%
- By 2075
- 24,341 · -39.5%
- By 2100
- 17,180 · -57.3%
Race, ethnicity, and origin ACS 2023
- Neighborhood character
- Predominantly White (95%)
- Race & ethnicity
- White 95% Hispanic / Latino 2% Two or more races 2%
- Common ancestry
- Romanian 6% Slovak 2% Iranian 2%
- Foreign-born
- 3% · Canada
- Languages at home
- 96% English-only · Spanish 1% Chinese 1% German/W. Germanic 1%
Political lean MEDSL · Tioga
- 2024 margin
- Solid R (+51.8) · D 23.6% · R 75.4% · Other 1.0%
- 2008→2024 swing
- -24.3pp toward R · 2008: -27.4pp · 2024: -51.8pp
- All cycles
- 2024: R+51.8 2020: R+51.2 2016: R+53.6 2012: R+34.8 2008: R+27.4
Not yet ingested
- Civics
- —
Market trends
- HPI YoY
- ▲ 11.05%
- Current HPI
- 252.4252
- Rent YoY
- —
- Metro
- —
- State GDP YoY
- ▲ 1.68%
- F500 in state
- 34
Industry mix (Fortune 500 HQ in PA)
| Industry | F500 HQs | Revenue |
|---|---|---|
| Healthcare | 2 | $309B |
|
||
| Insurance | 2 | $27B |
|
||
| Telecommunications / Media | 1 | $124B |
|
||
| Industrial Distribution | 1 | $22B |
|
||
| Financial Services | 1 | $20B |
|
||
| Chemicals / Materials | 1 | $18B |
|
||
Price history
+69.2% since first listed17 events — show timeline
- 2026-04-24 Listed $229,900 UNYREIS
- 2024-11-06 Price Changed $214,000 NMPA
- 2024-09-17 Relisted — NMPA
- 2024-09-11 Contingent — NMPA
- 2024-09-05 Price Changed $234,900 NMPA
- 2024-08-19 Listed $239,900 NMPA
- 2024-07-12 Listing Removed — UNYREIS
- 2024-05-22 Relisted — NMPA
- 2024-04-29 Contingent — NMPA
- 2024-04-25 Price Changed $234,900 NMPA
- 2024-01-22 Price Changed $239,500 NMPA
- 2023-10-14 Listed $239,500 UNYREIS
- 2023-10-14 Listed $244,900 NMPA
- 2021-05-07 Sold (MLS) $145,000 NMPA
- 2020-09-09 Listed $149,900 NMPA
- 2014-05-23 Sold (MLS) $126,500 NMPA
- 2014-05-05 Listed $135,900 NMPA
Property tax history
-0.3%/yrLatest (2026): $2,842 · +5.7% YoY. Source: county tax records.
Cash-flow waterfall
monthlySold comps — $/sqft
last 12 mo · ≤1 miLoading sold comps…